

To investigate whether the clinical tests used in routine eye examinations can identify adults whose reading rate increases with their preferred coloured overlay(s).
MethodsRoutine optometric tests were used to measure 73 undergraduate students’ refractive error, visual acuity, stereo-acuity, amplitude of accommodation, near point of convergence, associated heterophoria at near, colour vision and ocular motility. Participants chose an overlay or combination of overlays with colour optimal for clarity, and completed the Wilkins Rate of Reading Test with and without an overlay(s) of this colour.
ResultsOverall, there was a significant increase in reading speed with overlay (t(72)=−5.26, p<0.0005). Twenty-six participants (36%) increased their reading rate by >5% with their chosen coloured overlay(s). Ten participants (14%) had a reading speed increase of >10%. The increase in reading speed was not significantly associated with any clinical finding.
ConclusionTests which are completed in routine eye examinations did not identify those participants who benefitted from coloured overlays in terms of reading speed.
Investigar si las pruebas clínicas utilizadas durante los exámenes oculares rutinarios pueden identificar a aquellos adultos cuya velocidad de lectura se incrementa con uno o varios filtros del color identificado como preferido por el paciente.
MétodosSe utilizaron pruebas optométricas rutinarias para medir el error refractivo, la agudeza visual, la agudeza estereoscópica, la amplitud de acomodación, el punto próximo de convergencia, la heteroforia en cerca asociada, la visión del color y la motilidad ocular en 73 estudiantes universitarios. Los participantes utilizaron un filtro, o una combinación de filtros con el color óptimo en términos de claridad, y completaron el Wilkins Rate of Reading Test, con o sin el o los filtros de dicho color.
ResultadosEn general, se produjo un incremento significativo de la velocidad lectora con el filtro (t(72)=-5,26, p<0,0005). Veintiséis participantes (36%) incrementaron su índice de lectura en un >5% con el o los filtros coloreados escogidos. Diez participantes (14%) obtuvieron un incremento de la velocidad lectora de>10%. El incremento de la velocidad lectora no se asoció significativamente a ningún otro hallazgo clínico.
ConclusiónLas pruebas que se realizaron durante los exámenes oculares rutinarios no identificaron a aquellos participantes que se beneficiaron de los filtros coloreados en términos de velocidad lectora.
Visual stress is a condition characterised by symptoms of asthenopia and visual perceptual distortions when observing striped patterns,1 including lines of text.1–6 Visual stress during reading was first characterised by Meares7 and Irlen8 and has also been termed Meares–Irlen syndrome.3,5,9–13 The aetiology of visual stress has yet to be fully elucidated.
In the United Kingdom, people are usually screened for visual stress only if they report their subjective symptoms to optometrists, teachers or other professionals, who are aware of visual stress. Once referred (normally to an optometrist), patients undergo a thorough assessment of binocular vision which may be followed by an assessment of pattern glare. Patients then choose their preferred coloured overlays, and undergo tests of reading speed with and without the chosen overlay or combination of overlays. A diagnosis of visual stress is made if the coloured overlays immediately improve reading speed and/or if there is voluntary sustained use of the chosen overlays.2,10,11,14,15 This screening method is very subjective and ignores those people who benefit from coloured overlays without reporting symptoms of visual stress. There is no generally accepted criterion for the percentage increase in rate of reading necessary to justify prescribing coloured overlays, although a 5% increase is commonly used.16 Kriss and Evans suggest that a criterion of 10% is most appropriate.10 The appropriateness, however, depends upon the sensitivity and specificity required.16 Some individuals with specific learning difficulties,17 dyslexia,10,18 poor reading ability,19,20 migraine21,22 and autism23 show a benefit from coloured filters. Patients who would benefit from coloured filters but do not report their symptoms are not currently identified, and many individuals benefit from overlays without initially being aware of their symptoms. The present paper aims to investigate whether there are indications of visual stress in the results of the clinical tests used in routine eye examinations.
Blaskey et al.24 investigated the effect of vision therapy compared to Irlen filters, in a sample of children and adults, but only selected participants with vision problems. Evans25 stressed the importance of eye examinations to identify those patients whose symptoms indicative of visual stress are in fact due to other, optometric, issues. Other studies investigating the optometric correlates of visual stress have been undertaken with children.12,26,27 Only one of these studies27 used an unselected sample and the participants in this sample were not refracted. In the following study adult participants were included regardless of existing ocular and ocular-motor conditions and participants wore their optimum refractive correction throughout the experimental procedure. This was the first study to use an unselected sample of adults, who wore their optimal refractive correction throughout the testing.
MethodsParticipantsThe participants were recruited by advertisement from the first and second year undergraduate student population attending a university, which made no mention of visual stress symptoms of any kind. The participants were recruited without any knowledge of whether they experienced symptoms of visual stress. All individuals were included regardless of any visual, refractive or ocular-motor abnormalities or symptoms of visual stress, apart from one participant with epilepsy. Seventy-three participants (19 male and 54 female), aged between 18 and 30 years (mean 20.2 years, SD 2.4 years), were included.
A small additional sample of three students (two females aged 18 and 19 and one male aged 25) who were prescribed coloured filters by the university's eye clinic, and had used them for at least 6 months, underwent the same battery of optometric tests. Their results were analysed separately.
All procedures conformed to the tenets of the Declaration of Helsinki and were approved by the University Ethics Committee. All participants gave written informed consent after an explanation of the research study.
ProcedureThe tests were conducted in the following order:
Distance vision (uncorrected) was measured using a Snellen chart backlit with luminance of 160cd/m2, at 6m. Near vision was measured at 0.4m using a card with N-print notation. These are still the most common tests in community optometric practice in the UK, and were therefore chosen instead of the superior logMAR charts which are beginning to be used as part of computer-based charts.28 Monocular vision (right eye and then left eye) was always measured before binocular vision and distance before near vision. The visual acuity recorded was the smallest line on the chart for which the participant read all the letters correctly to replicate clinical testing procedures, rather than single letter scoring. An objective measurement of the participants’ ametropia was provided by static retinoscopy. Monocular subjective refractions, including best vision sphere, duochrome, Jackson cross-cylinder (in minus cylinder form) and +1.00DS blur techniques, were used to refine the retinoscopy result. A binocular balance of accommodation was performed using the monocular fogging balance (modified Humphriss) technique.29 All of the following tests, except ocular motility, were performed with this refractive correction in a trial frame, set to the appropriate inter-pupillary distance and the vertex distance recorded.
The same charts and procedures were used to measure distance and near visual acuities.
The TNO stereo test (16th Edition, Laméris Ootech BV, Nieuwegein, Netherlands) was performed at 0.4m. Plates V–VII were presented (480″ to 15″).30
The amplitude of accommodation was measured using a RAF rule (Haag-Streit, Harlow, UK). Participants were asked to keep looking at the N5 text while it was moved towards them. The dioptric average of the push-up amplitude (sustained blur point) and push-down amplitude (point of clarity after blur) was calculated for each participant. This basic measure of accommodation is most commonly used in optometric clinics. Accommodative lag and facility were not measured, as they are not routinely assessed in clinical practice in the UK.31
The near point of convergence (NPC) was also performed using a RAF rule. Participants were asked if the linear target was single at the far end of the rule. They were then asked to keep viewing the linear target and to report if it appeared double as it was moved closer to them. If the participant reported diplopia they were asked if they could make the image single again. When the diplopia was sustained the break point was recorded. The recovery point was recorded in centimetres and an average calculated.
The Mallett Fixation Disparity Unit (i.O.O Sales Ltd., London, UK) was used at 0.4m to measure associated heterophoria. A polarised visor was placed in front of the participants’ refractive correction. They were asked to read the text and identify whether they saw two nonius vertical lines. The participants were asked if the top line was aligned with the central target or to one side, and the question repeated with regard to the bottom line. Any disparity in relation to the central ‘x’ was aligned with the minimum amount of prism in the appropriate base direction, to measure horizontal heterophoria, in steps of 0.5 prism dioptres.32 The procedure was repeated to measure vertical associated heterophoria. Binocular instability was not recorded.
The Intuitive Overlays pack (i.O.O Sales Ltd., London, UK) was used by each participant to select their preferred single coloured overlay placed at 0.4m using the procedures in the manual. A second set of overlays was used to allow participants to select a combination of two overlays if it further improved the comfort and clarity of the text. The participants sat at a desk lit by a mixture of the fluorescent room light and a task light (Osram Dulux S; 500lux). The Intuitive Overlays were used because they sample the hue angle and saturation in the CIE 1976 diagram systematically and comprehensively.1,14,17,20,33 They are also commonly used for visual stress assessments in optometric practice.31
Participants’ rate of reading was measured using the Wilkins Rate of Reading Test (i.O.O Sales Ltd., London, UK) (WRRT). This test consists of passages of randomly ordered high frequency words, closely spaced to elicit symptoms of visual stress. The WRRT is reliable and valid.16,27,34 To control for learning and fatigue effects, an ABBA testing procedure was used. The participants’ rate of reading was measured with their chosen overlay, without any overlay, without any overlay again and then with the chosen overlay one more time. If the participant did not choose a coloured overlay they completed the WRRT ‘with’ condition with a grey overlay. Four different passages were used – one for each test condition. If the participant reached the end of the passage within the minute allocated they were instructed to continue reading from the beginning of the passage immediately. The number of words read correctly per minute was recorded for each condition, with any errors, omitted words and omitted lines discounted. Averages for both the ‘with’ and ‘without’ overlay conditions were calculated.
The 24-plate edition of the Ishihara Test (Kanehara Trading Inc., Tokyo, Japan) was used to detect the presence of any red/green colour vision defect. The test was held at 0.75m and each plate was shown for 3s.
Participants’ ocular motility was assessed using the large aperture on a Keeler ophthalmoscope with full illumination. The ophthalmoscope was held at a distance of 0.4m from the eye and then moved along that radius in horizontal, vertical and oblique directions in a cross formation, taking approximately 15s from one extreme of the binocular field to the other. Nine diagnostic positions of gaze were assessed to evaluate any ocular deviation.35 Participants were asked to report any blur, discomfort or diplopia, while following the light and keeping their head still. The examiner observed the corneal reflexes.
The classifications for abnormal optometric findings are listed in Table 1.
Optometric findings considered abnormal.
| Criteria for ocular abnormalities |
|---|
| A distance visual acuity (with optimal correction) in either eye worse than 6/6A near visual acuity (with optimal correction) in either eye worse than N5Stereoacuity worse than 60″An average amplitude of accommodation that did not meet the Duane–Hoffstetter formula for probable amplitude of accommodation (minimum amplitude of accommodation must be more than 15–0.25age)A near point of convergence more distal than 10cmAny slip evident on fixation disparity at nearAny report of blurring or diplopia on motility assessment |
Fig. 1 shows each participant's average reading speed with and without their individually selected coloured overlays.

Points above the diagonal line show those participants who read more quickly with their chosen overlays. For the group as a whole, reading speed increased significantly with an overlay (mean=167.8, SD=29.9) compared to without (mean=162.0, SD=30.9), t(72)=5.26, p<0.0005. Twenty-six (36%) participants increased their reading speed by more than 5% with their individually selected coloured overlays, and in 10 of these the reading speed increase was greater than 10%. One participant had a reduction in reading speed >5% with their chosen overlay compared to without.
Ten participants with a reading rate increase >5% (38% of the group) had an ocular abnormality as defined in Table 1, compared to 13 participants with ≤5% improvement in reading speed (28% of the group). The cut-off values in Table 1 were chosen based on normal values.28 There was no significant association between the presence of ocular abnormality and participants’ reading rate increase (p=0.43, Fisher's exact test, two-tail).
The refractive corrections were expressed as a dioptric power matrix for data analysis, so the vector components could be treated in a simple algebraic manner.36 The distant visual acuities were converted into logMAR values. The stereoacuity in arc seconds was converted into log form to reduce the skew in the distribution of the data.
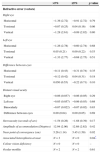
Table 2 summarises the findings. There were no statistically significant differences in the test results other than for associated heterophoria.
Results for clinical tests shown separately as a function of reading speed increase.
| >5% | ≤5% | p value | |
|---|---|---|---|
| Refractive error (vectors) | |||
| Right eye | |||
| Horizontal | −1.36 (2.72) | −0.91 (2.72) | 0.79 |
| Torsional | −0.07 (0.25) | 0.04 (0.16) | 0.06 |
| Vertical | −1.28 (2.61) | −0.89 (2.82) | 0.80 |
| Left eye | |||
| Horizontal | −1.26 (2.78) | −0.60 (2.74) | 0.68 |
| Torsional | 0.05 (0.21) | 0.00 (0.22) | 0.53 |
| Vertical | −1.33 (2.77) | −0.68 (2.75) | 0.51 |
| Difference between eyes | |||
| Horizontal | −0.11 (0.43) | −0.31 (0.74) | 0.35 |
| Torsional | −0.12 (0.42) | 0.04 (0.31) | 0.18 |
| Vertical | 0.050 (0.55) | −0.22 (0.71) | 0.10 |
| Distant visual acuity | |||
| Right eye | −0.06 (0.037) | −0.06 (0.05) | 0.29 |
| Left eye | −0.05 (0.057) | −0.06 (0.03) | 0.68 |
| Binocularly | −0.07 (0.022) | −0.07 (0.02) | 0.83 |
| Difference between eyes | 0.00 (0.04) | 0.00 (0.05) | 0.69 |
| Stereoacuity (seconds of arc) | −1.54 (0.26) | −1.68 (0.39) | 0.17 |
| Amplitude of accommodation (Dioptres) | 12.94 (2.06) | 12.68 (2.62) | 0.42 |
| Near point of convergence (cm) | 5.26 (1.14) | 5.45 (1.59) | 0.92 |
| Associated heterophoria at near | N=3 | N=0 | 0.04* |
| Colour vision deficiency | N=0 | N=0 | – |
| Ocular motility | N=2 | N=2 | 0.61 |
The above analysis was repeated with a more conservative criterion for the change in reading speed (>10%) and the findings were essentially unchanged.
The three individuals who were prescribed coloured filters demonstrated reading speed increases of 6.3%, 7.2% and 15.4% with overlays. All participants had a small refractive error, which conventionally would not be corrected by spectacle or contact lenses. They all had normal visual acuity, stereoacuity, binocular amplitude of accommodation, near point of convergence, ocular motility and colour vision. One participant had one prism dioptre of associated heterophoria at near.
DiscussionTwenty-six of the 73 students read >5% more quickly with their chosen overlay. The proportion (36%) did not differ significantly from the proportion obtained in previous studies: 38/113 (34%)11 and 15/26 (58%) (non-dyslexic students37).
Tests which are completed in routine eye examinations did not identify those participants who benefitted from coloured overlays with the possible exception of associated heterophoria at near.
Evans et al.26 reported optometric measures of 16 children who reported benefit from coloured overlays, and who used their overlays without prompting for 3 weeks. They compared them with 25 control children. They found that the mean amplitude of accommodation, convergent and divergent reserves and stereoacuity were all reduced compared to the controls, although the differences were not clinically significant. However, children with clinically significant refractive errors or ocular motor anomalies were excluded from both groups. Evans et al.12 analysed the optometric measures of 53 of the 68 children used in the double masked study by Wilkins et al.38 The participants in this study all used overlays. Children with decompensated heterophoria or blurred vision secondary to uncorrected refractive or accommodative anomalies were excluded. They reported that the children who used overlays had normal refractive errors and heterophorias but slightly reduced amplitudes of accommodation and reduced vergence and poor stereoacuity relative to age norms in the literature.
In two studies, Scott et al.27 investigated entire classes of school children aged 10–12 or 7–11, and these studies are therefore free of the sample bias of previous work. The children underwent an orthoptic examination (Study 1) or an optometric examination (Study 2). Each study found differences between children who used overlays and those who did not, but the only findings to occur consistently in both studies were reduced binocular amplitude of accommodation and associated heterophoria in children who used overlays.
In the present study, three of the 26 students who read >5% more quickly with an overlay and one of the three who habitually used overlays exhibited a clinically significant associated heterophoria. Of the five studies that have investigated optometric findings in overlay users (including the present study), all have revealed vergence difficulties (fusional reserves and/or associated heterophoria). Although dissociated tests (for example cover test) are used in clinical practice, associated heterophorias, measured using the Mallett test, are used to prescribe prismatic correction, if required, and provide a more natural measure of ocular-motor status due to the binocular fixation. For this reason, associated heterophorias were measured, although the authors recognise that they are not always included in routine eye examinations. The results on the Mallett Unit test were categorised as abnormal if there was a misalignment of the nonius lines, suggesting a decompensated heterophoria. Although the cover test was not performed, no participants exhibited suppression on the Mallett unit suggesting that no heterotropias were present.
While the association between overlay use and associated heterophoria would appear to be consistent across studies, the association is weak. Many individuals who benefit from overlays have adequate fusional reserves and no associated heterophoria. Although an association seems to exist, albeit weakly, the associated heterophoria may directly contribute to the difficulty in reading, contribute to the visual stress that leads to the reading difficulty or be present but not affect reading at all (being a non-causal correlate of visual stress25). Conversely, associated heterophorias or binocular instability could be secondary to visual stress, causing perceptual instability that impairs the fusion lock.4
Symptom questionnaires and assessments of pattern sensitivity are most commonly used to identify whether symptomatic patients would benefit from coloured filters,39 but are not routinely used in optometric practice as a screening tool, so are not discussed or investigated further in this paper.
In conclusion, this study found that tests used in routine eye examinations did not identify people who benefitted from coloured overlays. A quick and more objective screening procedure should be developed, so those asymptomatic individuals who would benefit from colour are not overlooked.
Financial or other relationshipsArnold Wilkins invented the Intuitive Overlays when he was employed by the Medical Research Council. The Council hold the rights and pay an Award to Inventors based on sales. The remaining authors have no conflicts of interest to declare.
This research was funded as part of a College of Optometrists’ Scholarship.
The study and data accumulation were carried out in conformity with all national, federal or state laws. Informed consent was obtained and the study was in adherence to the tenets of the Declaration of Helsinki.
This research was funded as part of a College of Optometrists’ Scholarship.


