


To compare the computed optical performance of prototype lenses designed using deliberate manipulation of higher-order spherical aberrations to extend depth-of-focus (EDOF) with two commercial multifocals.
MethodsEmmetropic, presbyopic, schematic eyes were coupled with prototype EDOF and commercial multifocal lenses (Acuvue Oasys for presbyopia, AOP, Johnson & Johnson & Air Optix Aqua multifocal, AOMF, Alcon). For each test configuration, the through-focus retinal image quality (TFRIQ) values were computed over 21 vergences, ranging from −0.50 to 2.00D, in 0.125D steps. Analysis was performed considering eyes with three different inherent aberration profiles: five different pupils and five different lens decentration levels.
ResultsExcept the LOW design, the AOP lenses offered ‘bifocal’ like TFRIQ performance. Lens performance was relatively independent to pupil and aberrations but not centration. Contrastingly, AOMF demonstrated distance centric performance, most dominant in LOW followed by MED and HIGH designs. AOMF lenses were the most sensitive to pupil, aberrations and centration. The prototypes demonstrated a ‘lift-off’ in the TFRIQ performance, particularly at intermediate and near, without trading performance at distance. When compared with AOP and AOMF, EDOF lenses demonstrated reduced sensitivity to pupil, aberrations and centration.
ConclusionWith the through focus retinal image quality as the gauge of optical performance, we demonstrated that the prototype EDOF designs were less susceptible to variations in pupil, inherent ocular aberrations and decentration, compared to the commercial designs. To ascertain whether these incremental improvements translate to a clinically palpable outcome requires investigation through human trials.
Comparar el rendimiento óptico computado de los prototipos de lentes de contacto diseñadas mediante manipulación deliberada de aberraciones esféricas de alto orden para conseguir la profundidad de foco extendida (EDOF) con dos lentes multifocales comerciales.
MétodosSe adaptaron lentes de contacto con prototipo EDOF, y lentes multifocales comerciales a ojos esquemáticos présbitas emétropes (Acuvue Oasys para presbicia, AOP, Johnson & Johnson & Air Optix Aqua multifocal, AOMF, Alcon). Para cada configuración de la prueba se obtuvieron los valores de la calidad de imagen de la retina a través del foco (TFRIQ) en 21 vergencias, que oscilaron entre -0,5 y 2D, en pasos de 0,125D. Se llevó a cabo el análisis considerando los ojos con tres perfiles de aberración diferentes: cinco pupilas diferentes y cinco niveles de descentramiento de lentes distintos.
ResultadosExceptuando el diseño LOW, las lentes AOP aportaron un rendimiento TFRIQ de tipo ‘bifocal’. El desempeño de las lentes fue relativamente independiente de la pupila y aberraciones, pero no del descentramiento. Por contra, AOMF demostró un rendimiento céntrico en visión lejana, más dominante en el diseño LOW, seguido de los diseños MED y HIGH. Las lentes AOMF fueron más sensibles a la pupila, aberraciones y centrado. Los prototipos demostraron un efecto de mejora en el rendimiento TFRIQ, particularmente en visión intermedia y próxima, sin pérdida de rendimiento en visión lejana. Al compararlas con las lentes AOP y AOMF, las lentes EDOF demostraron una reducción de la sensibilidad al factor pupila, las aberraciones y el centrado.
ConclusiónCon la calidad de imagen de la retina a través del foco, como medida del rendimiento óptico, demostramos que los diseños del prototipo EDOF fueron menos susceptibles a las variaciones de la pupila, las aberraciones oculares inherentes, y al descentramiento, en comparación a los diseños comerciales. Se precisa más investigación futura, mediante ensayos en humanos, para verificar si estas mejoras incrementales se trasladan a resultados clínicamente evaluables.
Presbyopia currently affects more than 20% of the world's population.1 Whether it is due to the cosmetic advantages that contact lenses (CLs) offer over spectacles,2 a more demanding lifestyle in this digital era,3 increased practitioner confidence to fit newer multifocal CLs (MFCLs) lenses,4 or a combination of the above, uptake of presbyopic MFCLs appears to have gained momentum in recent years.5–7
Current simultaneous image MFCLs can be broadly classified into three types: center-distance, center-near and concentric ring bifocals. The power distribution as a function of the optic zone diameter in the former two designs is monotonic (i.e. there is a smooth transition of power from distance to near zone or vice versa); while the latter design uses a non-monotonic power distribution, which is often classified as a zonal refractive design.8,9 The merits and demerits of visual performance with such conventional optical designs have been thoroughly explored.4,10–23 Recently, our group have pilot tested extended depth of focus (EDOF) designs, achieved through manipulation of higher order spherical aberration terms using non-linear, optimization algorithms that aimed to minimize the merit function defined by through focus retinal image quality (TFRIQ).24 Preliminary investigations on the visual performance in presbyopes fitted with EDOF CLs after a short term (1h) exposure have been reported.25,26 However, a detailed theoretical investigation on how the performance of the proposed EDOF CLs differ from the commercial designs like center-near designs and concentric bifocals has not been reported.
There are several proposed methods that enable vision scientists and lens designers to gauge the optical performance of simultaneous image MFCLs.27 These methods include schematic optical modeling using ray tracing and in vitro testing of lenses on a bench-top, life-sized, physical model eye.27,28 In this paper, the first of two parts, we report a theoretical evaluation of the optical performance of a proposed EDOF CLs designed to correct presbyopia. The optical performance of the proposed designs is then compared to the modeled performance of two commercial multifocal alternatives: ACUVUE® OASYS® for Presbyopia (AOP, Johnson & Johnson, USA) and AIR OPTIX® Aqua Multifocal (AOMF, Alcon, USA). To emulate real world performance, we aim to evaluate the TFRIQ calculations on a schematic model eye at various pupils, inherent aberrations and decentration levels. In part 2 of the paper, we report data on presbyopic visual performance with proposed EDOF CLs compared to commercial alternatives, obtained from dispensing clinical studies.
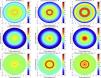
MethodsLens designs (power profiles)Fig. 1 shows the power profiles of all the study lenses, described in detail elsewhere.9,26,29 The AOMF lenses have a monotonic power distribution across the optic zone radius. On the other hand, the AOP lens is a concentric-ring zonal bifocal. In contrast to commercials, the EDOF CLs have series of smooth, non-monotonic, aperiodic, power variation across the optic zone that was designed using deliberate manipulation of multiple HOSA terms. Here, the objective was to achieve an extension of depth of focus that would facilitate a balanced visual performance across a range of predefined dioptric distances. The profiles in each column of Fig. 1 are designed to satisfy presbyopes with LOW, MED and HIGH-add requirements.
Transformation of lens designs (power profiles) into Zemax compatible surfaces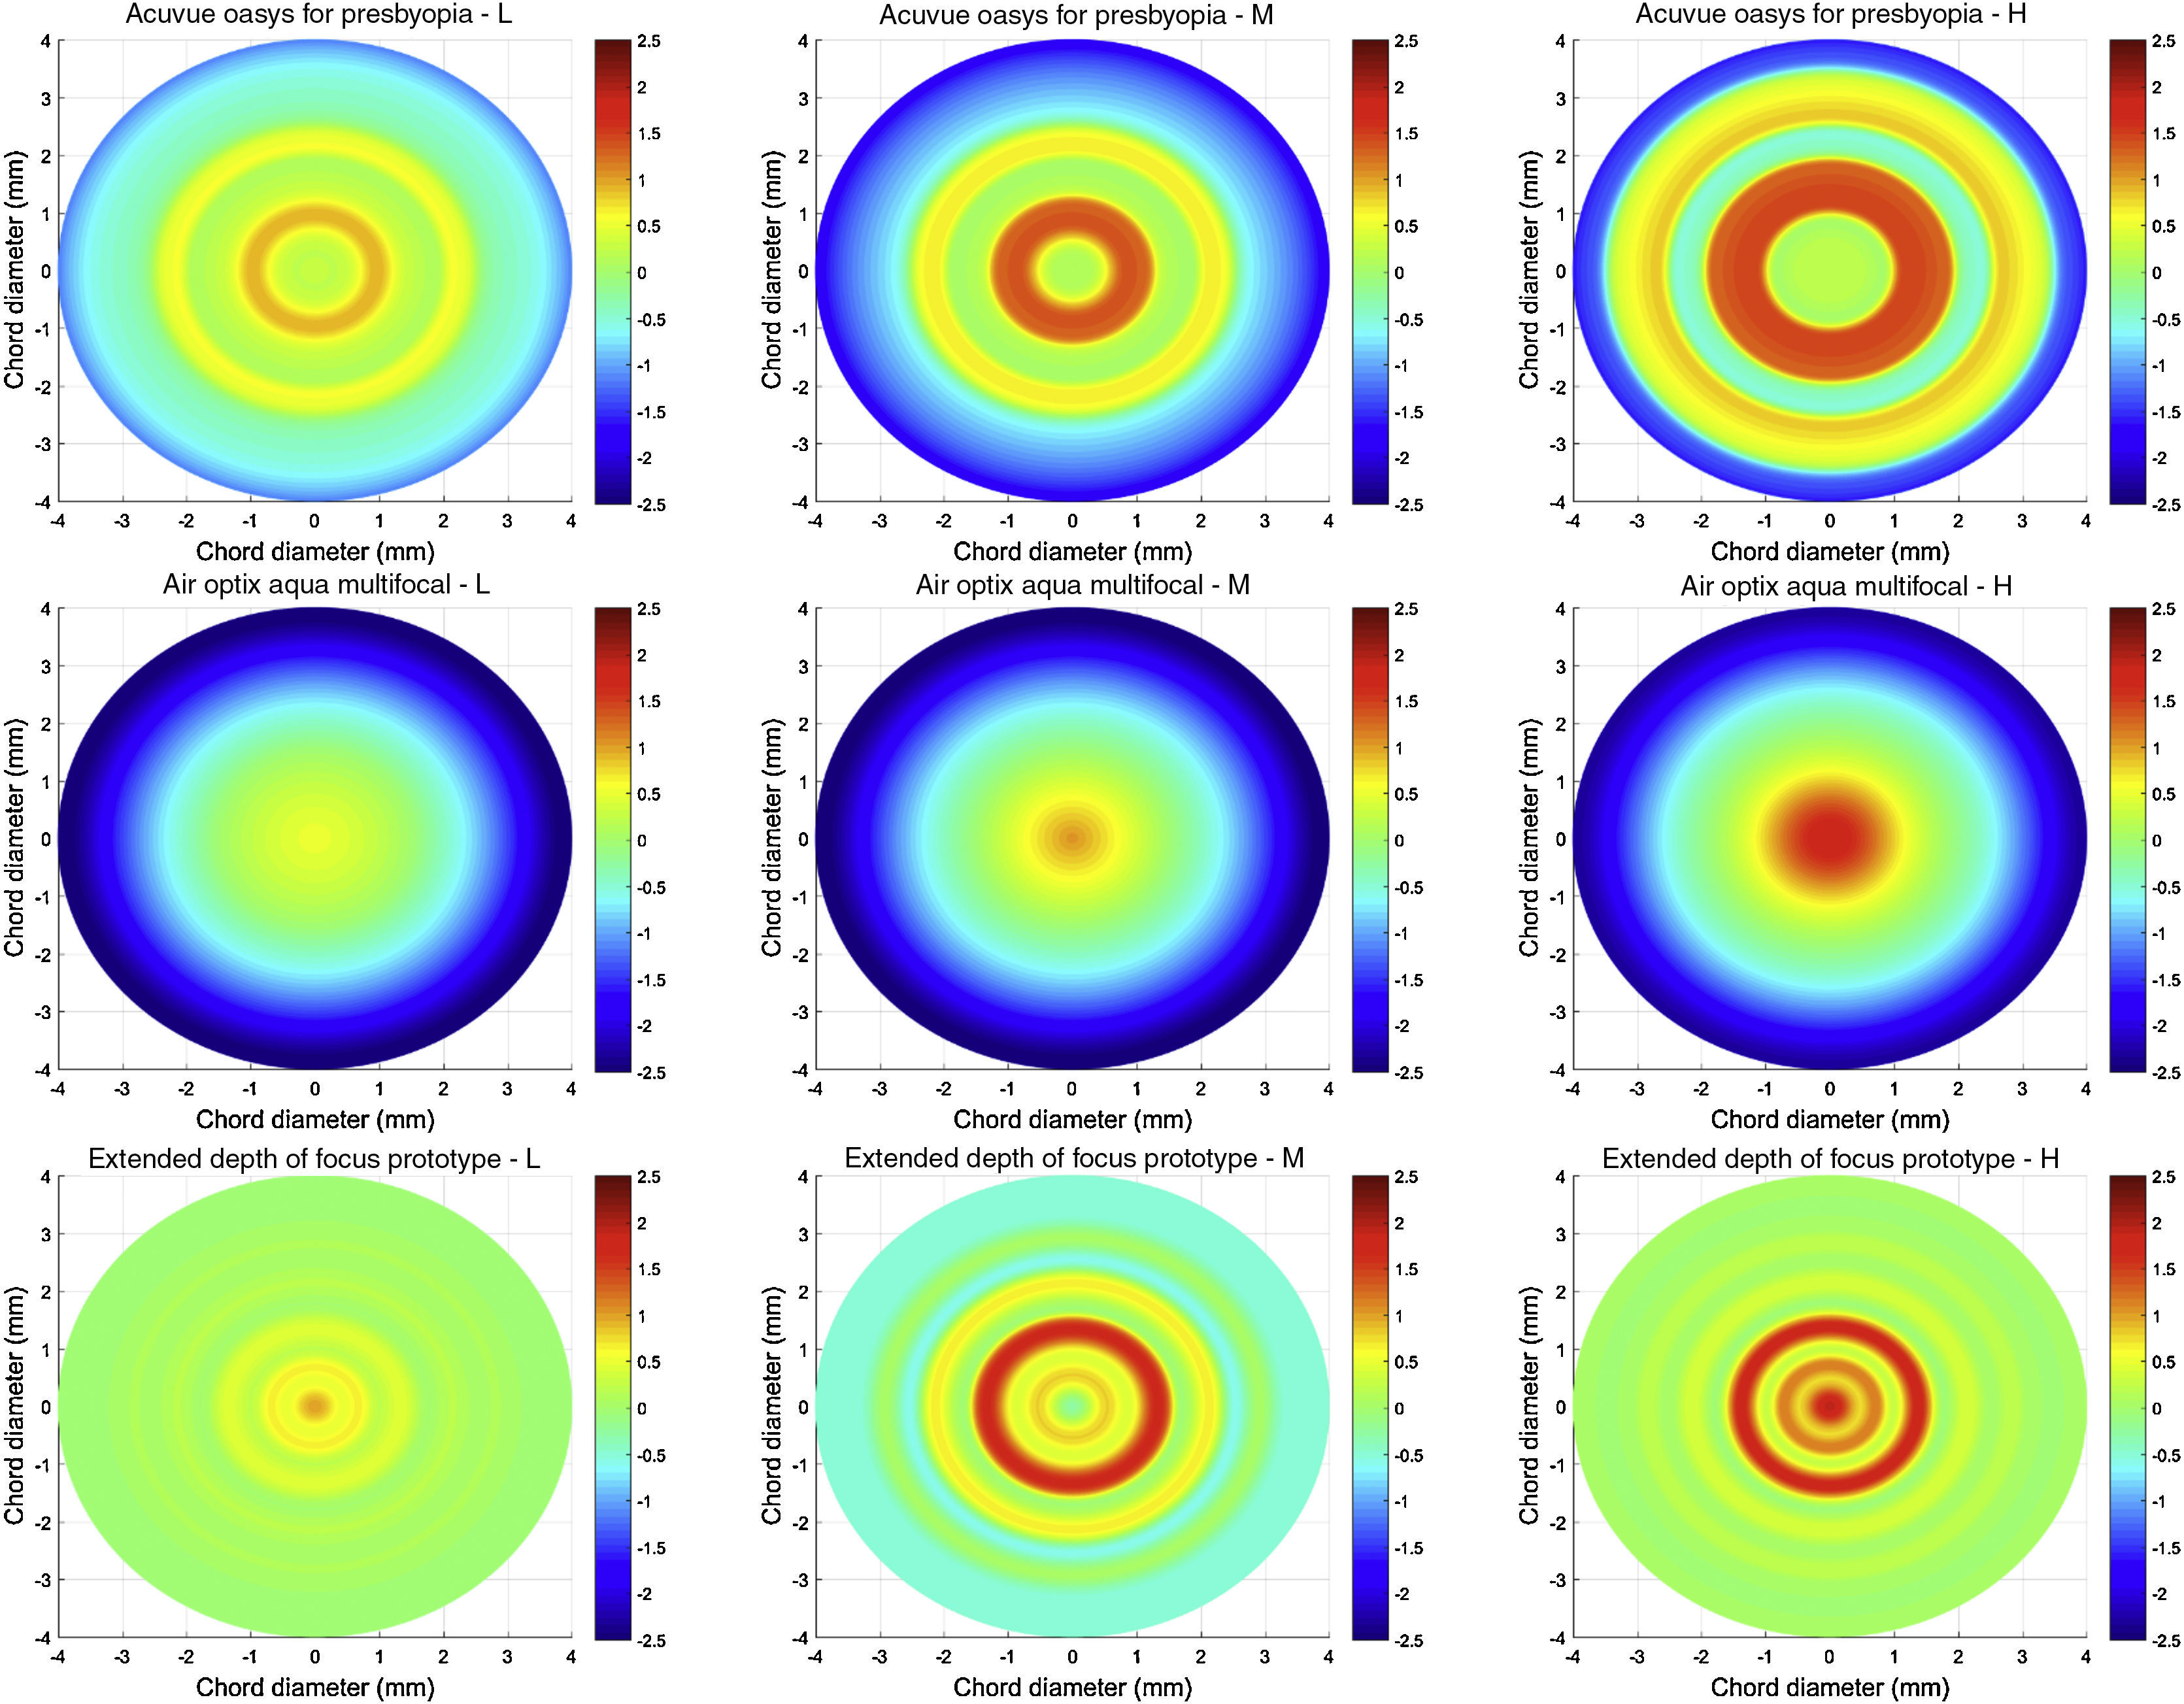
The optical designs of the study lenses (described in Fig. 1) were obtained from the physical lens measurements performed using NIMO TR1504 (Lambda-X, Nivelles, Belgium).9 To model the commercial and prototype designs, the optical designs were transformed to appropriate surface shapes in Zemax ray tracing software (Optic Studio 16 SP1, professional version) before proceeding with the image quality computations. This transformation was accomplished using a custom-written application that routed Zemax through Matlab (MathWorks® 2015b, USA) via dynamic data exchange interface. This program offers the user a graphical user interface to elect a base curve (defined as a standard conic section), central thickness, refractive index, and a target power profile. To achieve the target power profile, the in-built damped least-squared optimization routine of Zemax was employed to facilitate the optimization of the front surface of the correcting CL, which was described as a ‘super conic’ surface. During the optimization routine, the sagittal power across the optic zone diameter was obtained as an interim output. Whenever a local minimum was achieved, the front surface was tested for its accuracy by comparing the target and output power profiles using the summated square error metric. The optimization was deemed complete when the lenses achieved a summated square error ≤0.05D, calculated over the entire optic zone diameter.
Modeling presbyopic schematic eyesThe Navarro–Escudero30 eye was modified to mimic presbyopic eyes with no residual accommodation. These modifications were based on unaccommodated emmetropic eyes, refractive error dependent models, corneal and lens shapes and concomitant changes with the age, and in vitro lenticular refractive index (RI) measurements.27,28,31–43 The effect of residual accommodation was not taken into account. Further details of the model are reported elsewhere.27,33,44 All the ray-tracing routines were performed in Zemax (Optic Studio 16 SP1, professional version 2016) executed through Matlab (MathWorks 2015b) via dynamic data exchange interface.
Ray tracing through combination of contact lens and model eyesSoft CLs wrap the eye in its flexed state,45,46 and consequently, the back surface of a correcting lens would then be aligned with cornea, provided the fit is acceptable. Hence, we chose to design the lenses in their flexed state, with a base curve radius of 7.75mm, asphericity equal to −0.25 and refractive index of 1.42, over an 8mm optic zone. Only the optical zone of the CLs was modeled, the peripheral carrier zone of the CL was ignored. The CLs chosen for this modeling exercise had emmetropic distance prescription whose central thickness was fixed at 0.100mm.
At first, we modified the baseline Navarro–Escudero schematic model eye to produce an aberration free model. In the interest of brevity, only an emmetropic, presbyopic model eye was considered in this experiment. However, these same methods could also be used to test presbyopic eyes with myopia or hyperopia. To avoid unnecessary complexity, tear film dynamics expected in a real eye, were ignored. The two commercial MFCLs and the prototype EDOF CLs (each of their respective LOW, MED and HIGH designs), described in earlier sections, were used to correct the emmetropic presbyopic schematic model eye. All the test lenses were well centered on the corneal surface, and ‘into-the-eye’ ray tracing method was adapted to analyze the optical performance of the test lens+model eye combinations.44 A monochromatic reference wavelength of 0.589μm was chosen for all calculations. The pupil surface was made the aperture stop, and a 512×512-ray grid on the entrance pupil was used in all calculations. The ray tracing was performed in a real, robust ray aiming, cache mode as described elsewhere.33,44 The entrance pupil was modeled to emulate the effects of the human Stiles–Crawford effect using a simple Gaussian function with a standard deviation of −0.115, as described elsewhere.47,48
Modeling effects of different pupils, inherent aberrations and decentration levelsTo mimic the diversity observed in normal eyes and generalize our results to the population, we have modeled three levels of inherent aberration profiles. The distribution of inherent spherical aberration in the relaxed eyes is well characterized.49–61 The inherent spherical aberrations were modeled based on 5th, 50th and 95th percentiles of the normative distribution, which translate to approximately −0.10μm, 0.10μm and +0.30μm at 6mm pupil.44 In addition to spherical aberration, normal eyes have considerable amounts of on-axis, asymmetric, higher order aberrations (HOA, e.g. horizontal/vertical coma and trefoil).49 Therefore, to further align our models to the real world observations, we supplemented the aberration models with mean values of coma [horizontal: +0.143μm and VERTICAL: +0.09μm] and trefoil [horizontal: +0.106μm and vertical: +0.081μm] at 6mm pupil from published data.49 These three levels of inherent aberration models are referred here and elsewhere in the manuscript as Models 1, 2 and 3. The inherent ocular aberrations once modeled, were dialed into the CL+eye system via customized Matlab routines. For each test configuration, the TFRIQ metrics were computed over target vergences, ranging from −0.50D to 2.00D in 0.125D steps. To make the modeling more realistic, the entire analysis was performed for five different pupils, ranging from 3 to 5mm, in 0.5mm steps. To further mimic reality, in addition to the well-centered CL on eye scenario, the TFRIQ values were also computed for four preset CL vertical decentrations: 0.125mm, 0.250mm, 0.375mm and 0.500mm at 3.5mm pupil. When studying the effects of lens decentration, the asymmetric HOA were ignored from the three models.
Measures of the optical performanceFor each configuration, the exit pupil raw wavefront (512×512 array) was numerically propagated to the Fourier plane to yield a point spread function. The modulation transfer function was computed as the real part of optical transfer function, obtained after Fourier transformation of the point spread function. The real part of the optical transfer function weighted with the neural contrast sensitivity function was calculated, within spatial frequency bounds of 0–30cycles/°. The ratio of the volumes under the product of the optical transfer function and the contrast sensitivity function calculated with a given correction to the diffraction limited case was defined as the retinal image quality (RIQ), defined as visual Strehl ratio (VSOTF), described in detail elsewhere.27,44,62–64 A natural log transformation was applied to the RIQ computations. The lower the log transformed RIQ, the poorer the optical performance of the system.
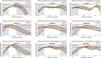
ResultsAnalysis of overall optical performanceFigs. 2–4 are presented as a montage of 9 graphs assembled into a 3-by-3 matrix. These graphs illustrate the computed TFRIQ values as a function of the following test variables: pupil (Fig. 2), inherent aberrations (Fig. 3) and lens decentration (Fig. 4), respectively.
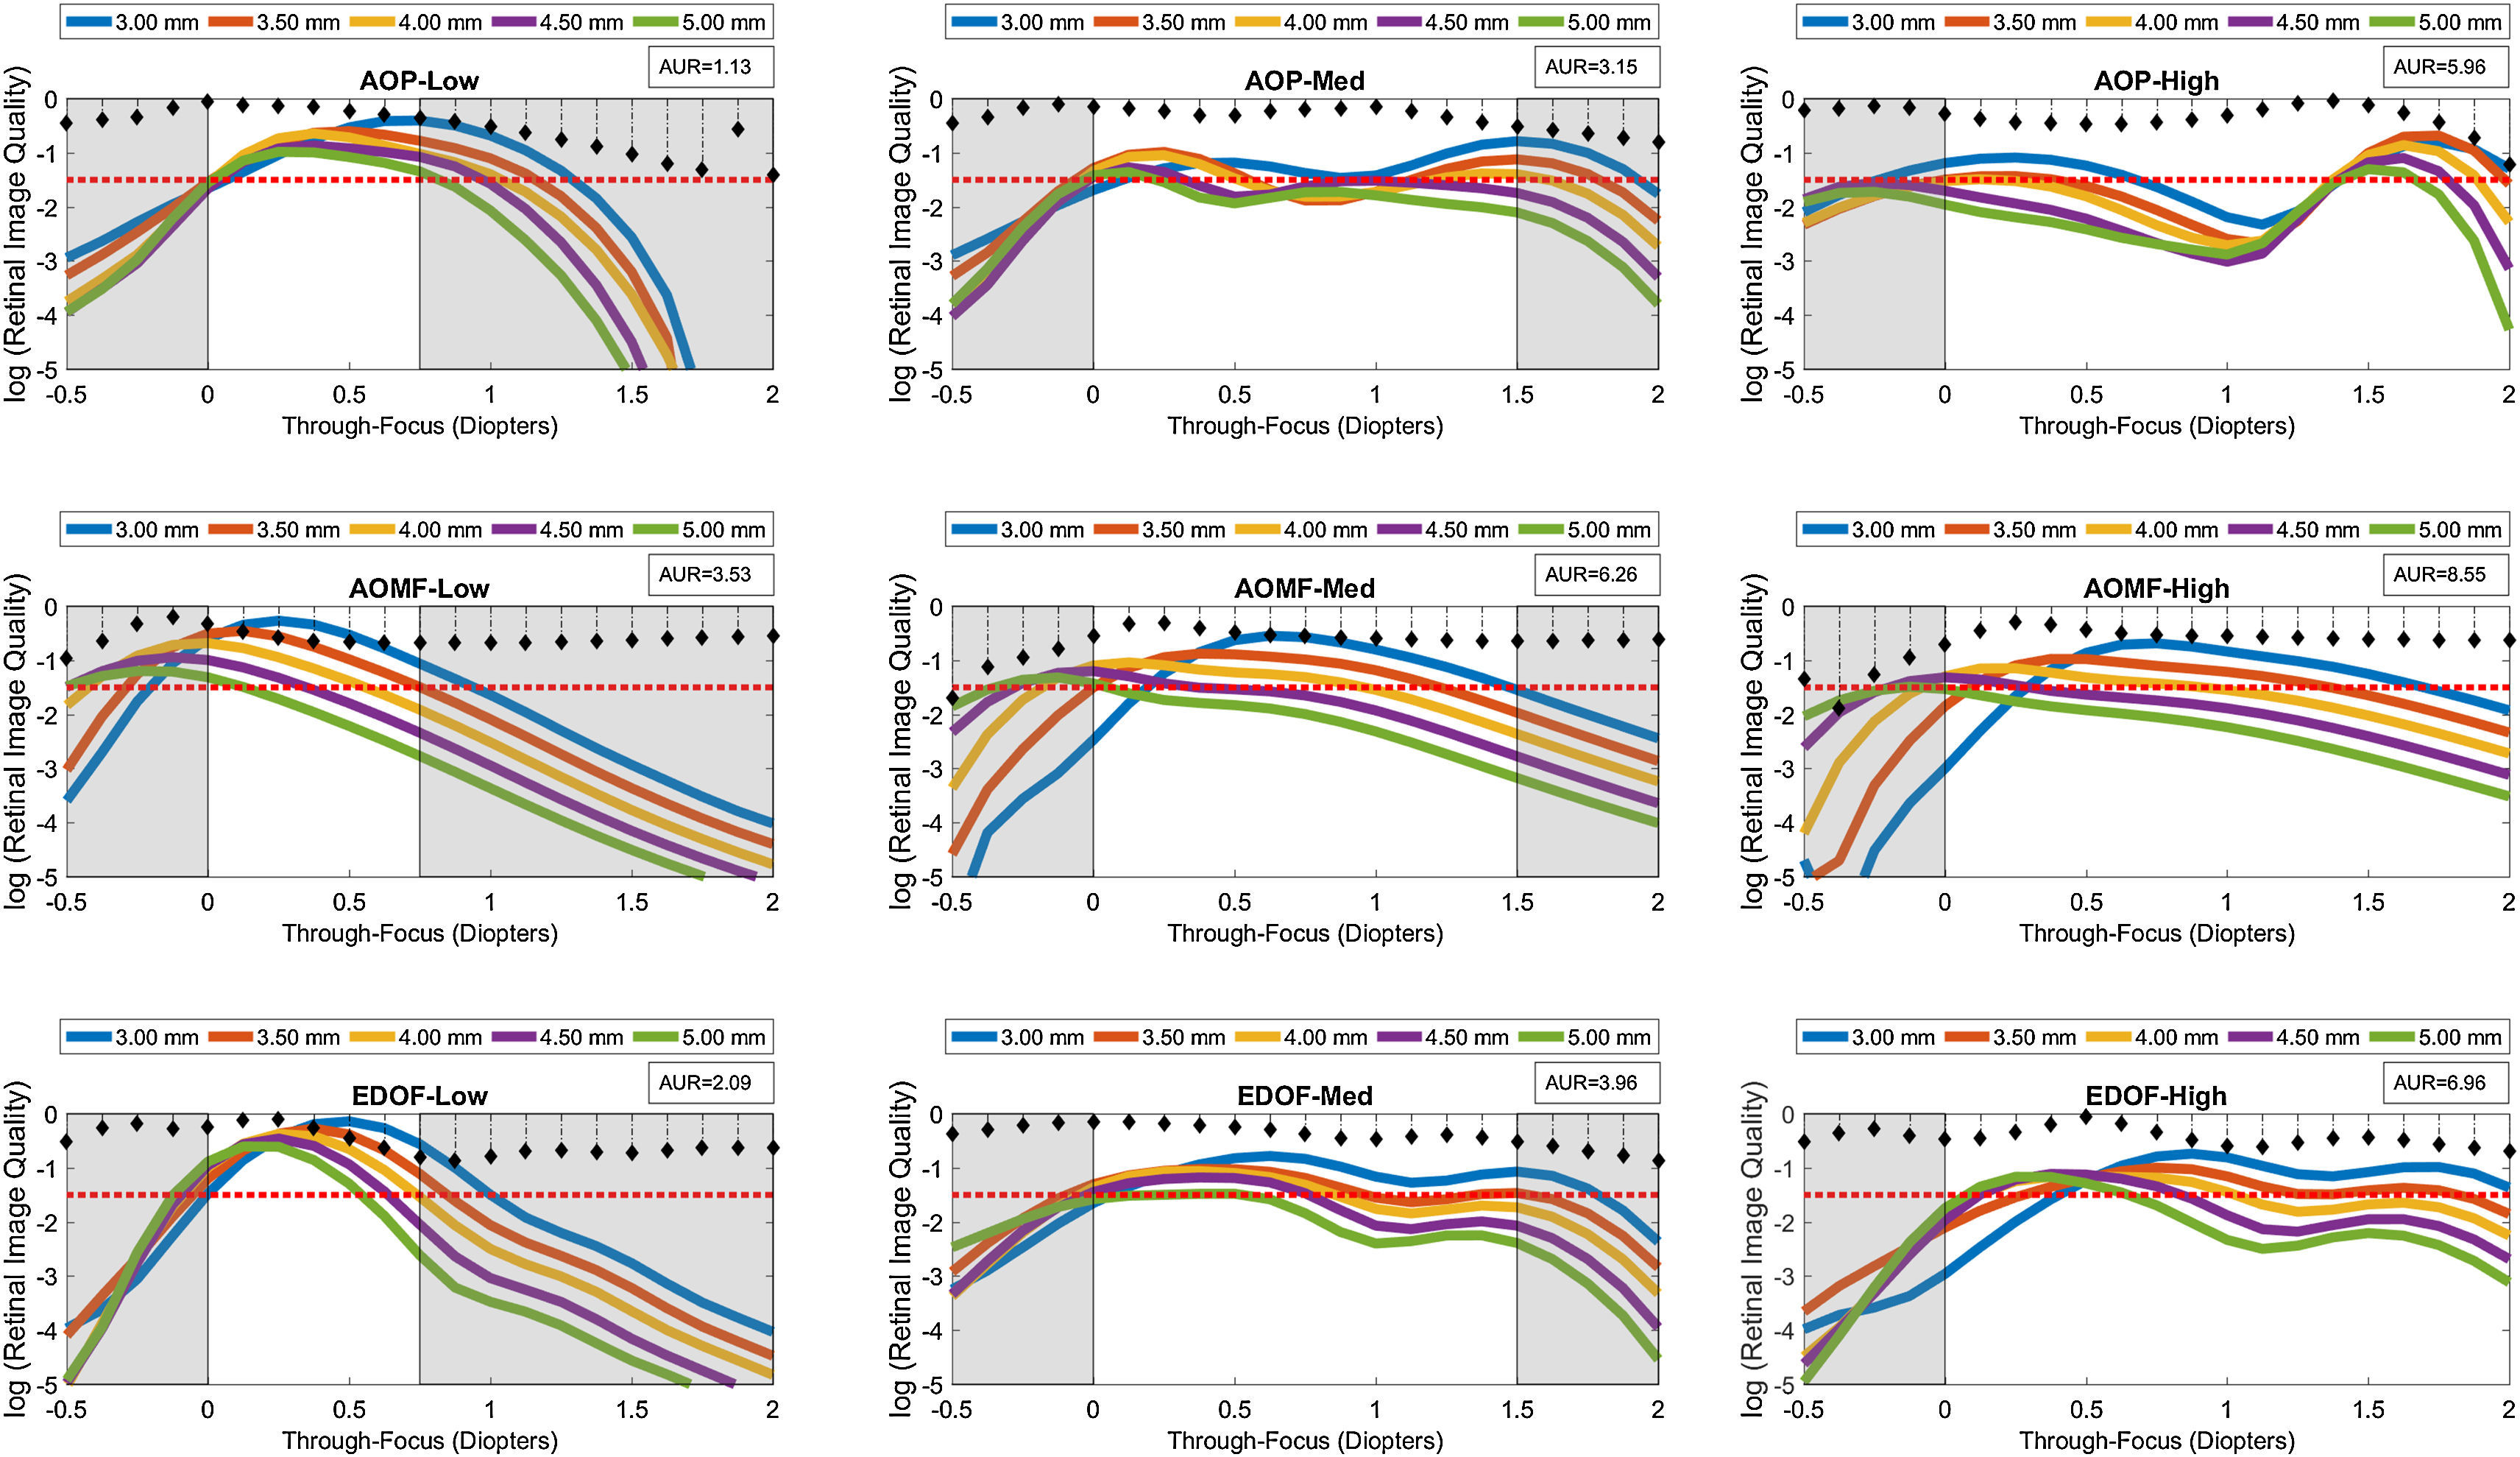
Log transformed through password-focus retinal image quality values computed as a function of 5 pupil diameters: from 3 to 5mm in 0.5mm steps. This data represents computations performed on the schematic eye embedded with Model 2 inherent aberrations. The correcting lens was well-centered over the cornea. A red dashed line across subgraphs indicates the ideal threshold RIQ. The bounded area under the perpendicular lines drawn from X-axis (absolute value) is inscribed at the corner of each sub-graphs indicate the variance of TFRIQ between the five pupil diameters.
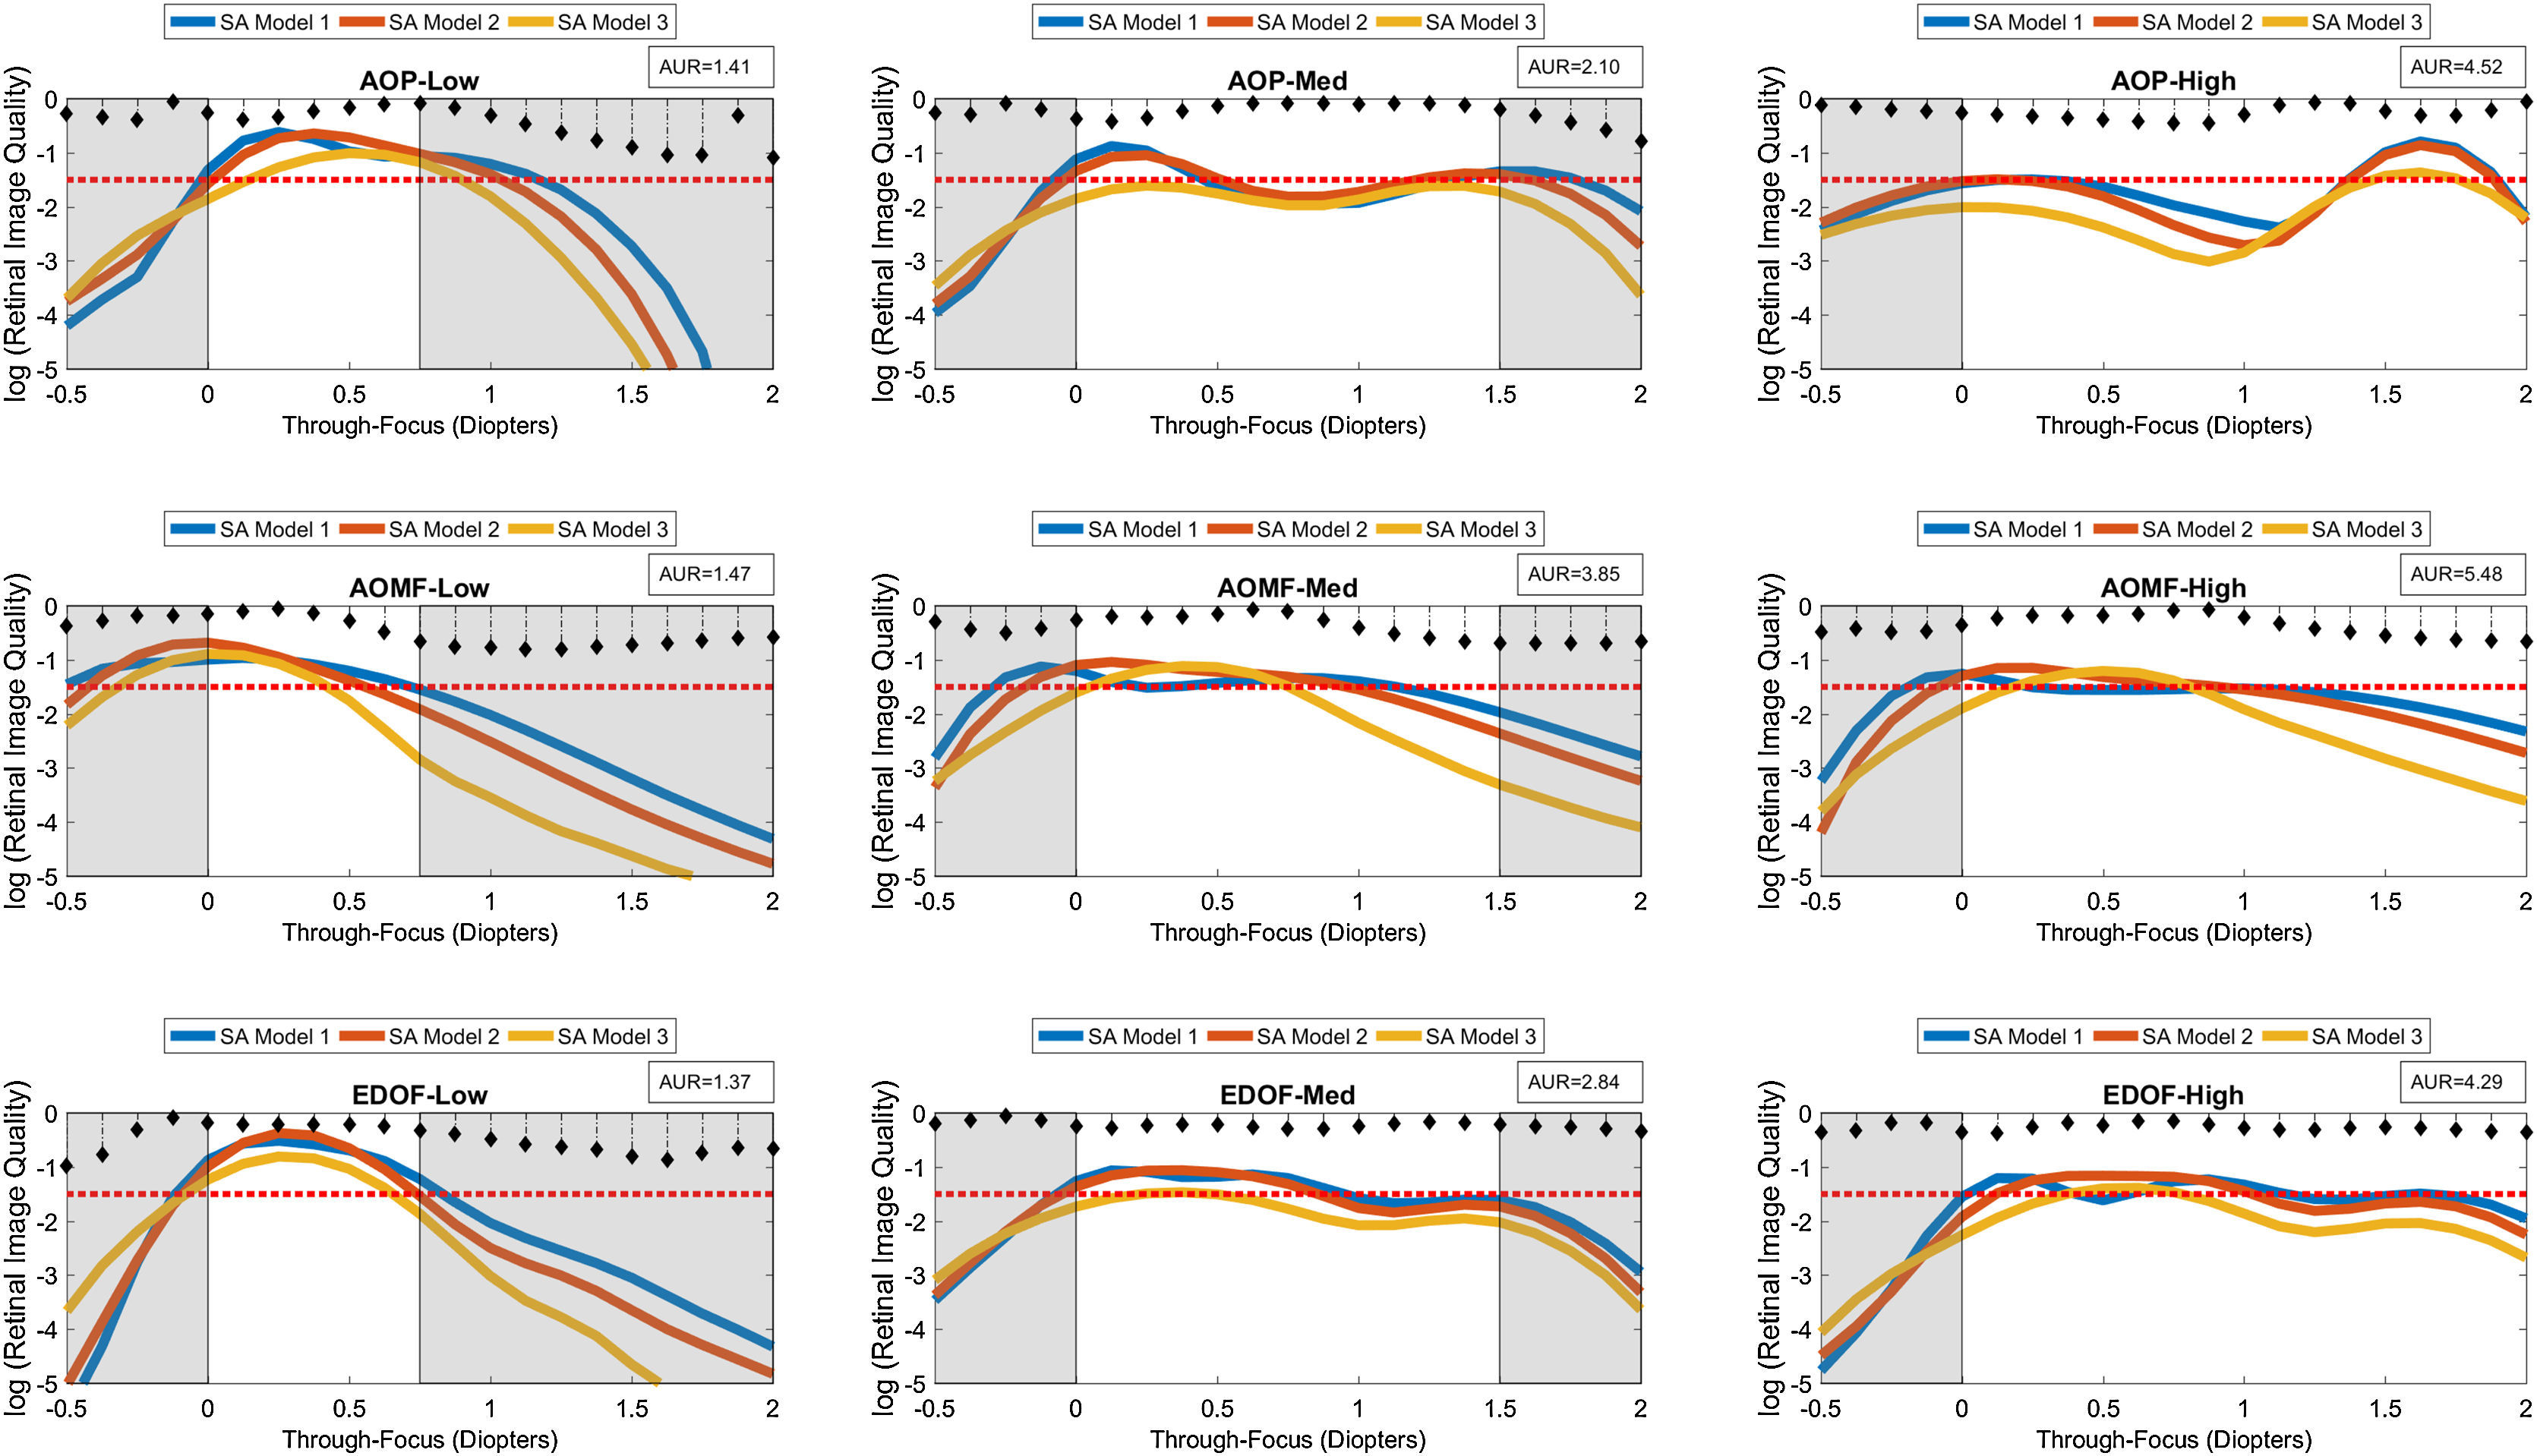
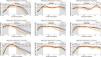
Log transformed through-focus retinal image quality values computed as a function of 3 inherent aberration models: Models 1–3. This data represents computations performed on the schematic eye with 4mm pupil. The correcting lens was well-centered over the cornea. A red dashed line across sub-graphs indicates the ideal threshold RIQ. The bounded area under the perpendicular lines drawn from X-axis (absolute value) is inscribed at the corner of each sub-graphs indicate the variance of TFRIQ between the three aberration models.
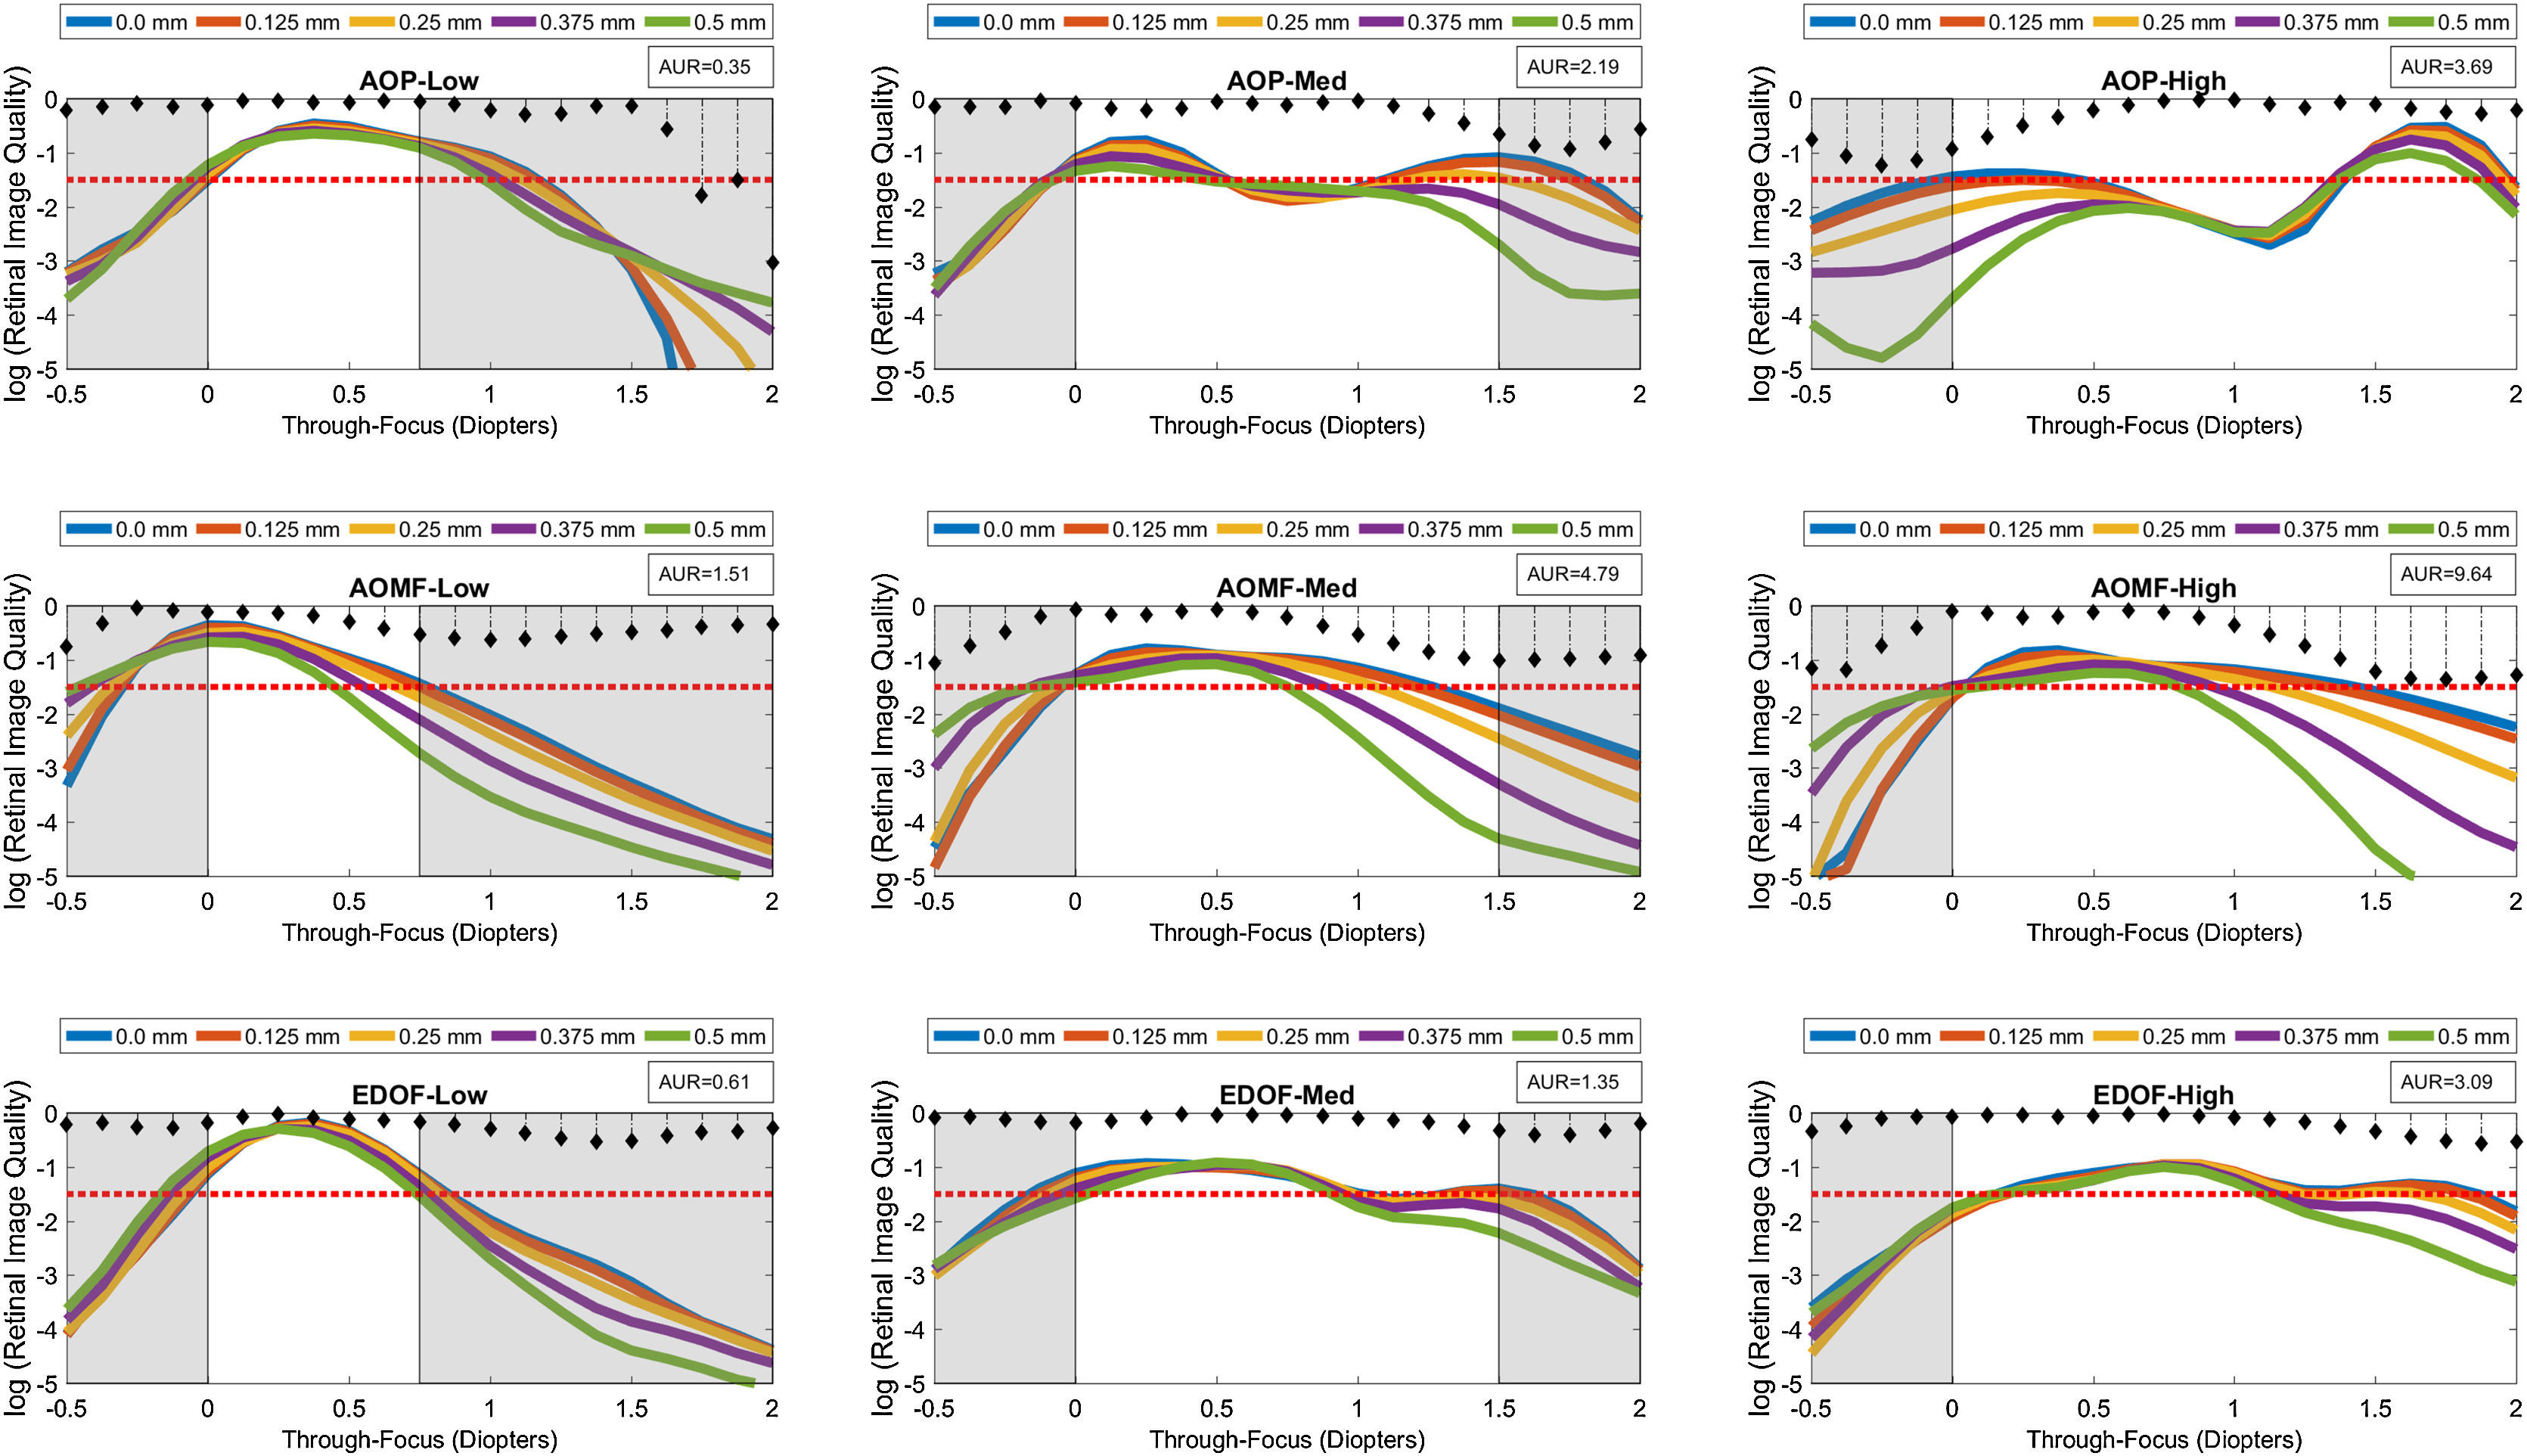
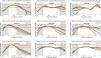
Log transformed through-focus retinal image quality values computed as a function of 5 preset lens centration positions: 0.0–0.50mm in 0.125mm steps. This data represents computations performed on the schematic eye embedded with Model 2 inherent aberrations (excluding asymmetric HOA) at 3.5mm pupil diameter. A red dashed line across sub-graphs indicates the ideal threshold RIQ. The bounded area under the perpendicular lines drawn from X-axis (absolute value) is inscribed at the corner of each sub-graphs indicate the variance of TFRIQ between the five decentration levels.
The rows of the 3-by-3 matrix represent computed performance for AOP, AOMF and EDOF lenses; while the columns represent data for lens types designed to cater for participants with LOW, MED and HIGH add requirements, respectively. The section in ‘white’ ribbons on each of the sub-graphs of Figs. 2–4, highlight the intended range of vision correction for those specific study lenses. The lengths of ‘white’ ribbons for LOW, MED and HIGH correspond to vergence ranges: 0–0.75D, 0–1.50D and 0–2.00D, respectively.
Intended bifocality, multifocality or extension of depth of focus can only be achieved at an expense of loss of RIQ at an alternate distance. Successful design of an ‘ideal’ simultaneous image multifocals for a presbyope attempts to minimize the compromise at any given distance. An eye (free of HOA), when imposed with approximately ∼0.375D of defocus at 4mm pupil would yield a computed log transformed RIQ of −1.50. Given that most people can clinically tolerate up to approximately 0.25D blur without significantly affecting their visual performance, a log transformed RIQ value of −1.50 log units was selected to be the ideal threshold for this simulation. A red dotted line plotted along the horizontal dimension (anchored at the proposed ideal threshold) is offered on every graph to enable the reader to differentiate the performance between the individual lens types. To further facilitate overall appreciation of the TFRIQ, in each of the sub-graphs of Figs. 2–4, the standard deviation of the TFRIQ measure, as function of the defined variable is shown with a ‘stem’ plot (perpendicular lines drawn from X-axis). In addition, for each test case, the area (absolute value) bounding the ‘stem’ plot calculated over the defined white ribbon length (AUR), was inscribed onto the top-right section of the each sub-graph. For any given variable (e.g. pupil size, inherent aberrations and lens decentration), the lower the AUR, the greater the insensitivity of TFRIQ to the changes in that particular variable (i.e. more consistent the optical performance of the lens).
To demonstrate how the optical performance varies as a function of three independent variables, one could populate an exhaustive number of permutations of possible performance plots involving the proposed variables: pupil, inherent aberrations and lens centration. In the interest of brevity, we choose to only represent three distinct examples that closely represent population data. Firstly, to demonstrate effects of change in pupil on the through focus performance, we locked the remaining two variables. Hence, data in Fig. 2 represents the test case, when the correcting CL is well-centered on the schematic eye embedded with population mean aberration levels defined by Model 2 (which includes both symmetric and asymmetric HOA). Secondly, to demonstrate the effects of change in inherent aberration profiles of the corrected eyes on the through focus performance, we froze the pupil to 4mm and again considered a well centered correcting CL scenario (Fig. 3). Lastly, to demonstrate the effects of lens decentration on performance (Fig. 4), we choose to present data for 3.5mm pupil on an eye with aberrations defined by Model 2, however the asymmetric HOA were ignored for this step.
The information required to facilitate comparison of three study lenses was condensed into Figs. 2–4. For each figure, at first, the results are reported from the top-left, sub-graph. Later, to gauge performance of one lens type against the other, results are compared against their corresponding counterparts based on add design, along the same column. Later, this procedure is repeated across the other two columns of the figure. Two descriptive metrics are used as tools to compare results within in sub-graphs and also across the columns (add type) and rows (lens-types); (a) the TFRIQ performance comparison with the ideal scenario (red-dashed line); and (b) the standard deviation plot of the TRIQ as function of a specific test variable (numerical value, AUR). As this simulation experiment treats emmetropic presbyopia, plano distance prescription was chosen for all lenses. However, it is noticeable from Fig. 1 that the AOMF designs, particularly LOW and MED have excessive negative power that could potentially make its ‘effective’ distance prescription in the myopic direction. Therefore, to make the comparisons between the study lenses reasonable and more importantly to account for a potential over refraction with lenses that employ monotonic power profiles, the TFRIQ performance obtained with AOMF LOW and MED designs were shifted to the right by 0.25D.
As seen in Fig. 2, the TFRIQ calculations obtained with the AOP LOW design satisfies the ideal threshold of −1.5 log units for all pupils. This observation also holds partially true for the EDOF LOW design, at least for pupils ≤4mm. However, the actual RIQ values obtained with the EDOF LOW seem to be higher than those obtained with the AOP LOW. With an appropriate offset, as seen in the highlighted ‘white’ sections of the sub-graphs, AOMF LOW satisfies the threshold requirements. Considering the variability of TFRIQ values with change in pupil, the AOP LOW design seems to the best performer (AUR=1.13), followed by the EDOF LOW (AUR=2.09) and the AOMF LOW (AUR=3.53) designs. Although not critical for a LOW design, it is worthwhile to note that the TFRIQ curves obtained with the AOMF LOW and EDOF LOW seem to have a ‘lift-off’ on the right hand side of the TFRIQ curve. This would theoretically translate to better performance for near vergences. Exactly the opposite is observed with the AOP LOW design, where a dip on the right hand side of TFRIQ curve is observed.
Considering the MED designs (i.e. second column of Fig. 2), we notice that the TFRIQ curves of the AOP MED design becomes bimodal (two distinct peaks) in nature, which is a pattern clearly appreciated for pupils less than 4mm. This would theoretically translate to improved optical performance at vergence of 1.50 D, which comes at an expense of poor performance at vergences of about 0.75D. However, the bimodal pattern of the TFRIQ curves seem to fade away for pupils >4mm. Unlike the AOP MED design, the EDOF MED sits close to the ideal threshold requirement, without inducing bimodality, at least for pupils less than 4mm. For pupils >4mm, the TFRIQ curve produces an infliction point at a vergence range of 1.00D but it is not distinct enough to create a ‘bimodal’ pattern observed with AOP MED. However, it is important to notice that the near peak obtained with the EDOF MED slips marginally lower than its AOP MED counterpart. The AOMF MED design fails to fully satisfy the requirements of an ideal scenario at all pupils. Again, based on the variability measure, the AOP MED design (AUR=3.15) outperforms the EDOF MED (3.96) and AOMF MED (6.26) designs.
Next, we examine the results obtained with the HIGH designs (i.e. third column of Fig. 2). These graphs clearly reveal that the previous trends with MED designs are reproduced here. The bimodal nature of AOP HIGH in this case is evident for all pupils. The EDOF HIGH design remains close to the ideal case scenario, but that statement does not hold true for pupils greater than 4mm. Again, for pupils >4mm, the EDOF HIGH produces an appreciable infliction point, at about 1.00D target vergence, however it does not present characteristics of a bimodal pattern seen with AOP HIGH. The performance of the AOMF HIGH design seems to be largely pupil dependent and its performance approaches ideal threshold only for specific pupil×vergence pairs. For example, a favorable pattern is observed when considering near vergence with 3mm pupil or far vergence with 5mm pupil. However, the converse pattern emerges when performance is computed at far vergence with 5mm pupil or at near vergence with 3mm pupil. Again, the AOP HIGH design demonstrates least variability in the shape of TFRIQ as a function of change in pupil size (AUR=5.96), closely followed by the EDOF HIGH (AUR=6.96) with the AOMF HIGH (AUR=8.55) design a distant third. The performance of AOMF design does not exhibit bimodal nature at any of the pupils tested.
Fig. 3 showcases the TFRIQ performance values computed for three different inherent aberration models at 4mm pupil, with a well-centered correcting CL. Here, the AOP LOW design not only satisfies the ideal criterion but also demonstrates minimal variance in TFRIQ values obtained with the three inherent aberration models (AUR=1.41). The same observation holds true for the EDOF LOW design (AUR=1.37). Amongst the LOW designs, AOMF LOW (AUR=1.47) demonstrates greatest variance in TFRIQ values between the three inherent aberration models but it is not distinctly different from the performance of AOP or EDOF designs.
The AOP MED holds to the pattern of the AOP LOW, producing a minimal variance in the TFRIQ response within the three aberration models (AUR=2.10), and also meets the ideal threshold requirements for two out of three SA models. However, both these test cases with AOP MED produce a valley in the through focus output. Again, the AOMF MED design (AUR=3.85) produces greatest variance in TFRIQ, as a function of the three aberration models. It just meets the threshold requirement for Model 1, provided an additional offset of 0.25D is applied to the TFRIQ curves. However, this observation does not hold true for results obtained with Models 2 and 3. Unlike the AOP and AOMF designs, the EDOF MED design remains closer to the ideal threshold requirement. This holds true for all three models. Further, it also demonstrates smaller variance across the three aberration models (AUR=2.84) than AOMF design.
The patterns produced by AOP HIGH, AOMF HIGH and EDOF HIGH are very similar to those obtained by their respective MED design counterparts. The TFRIQ curve obtained with the AOP HIGH design is again distinctly bimodal, with the maximum peak-to-trough variation of approximately 1.5 log units. The amplitude of the bimodal curve does not seem to be strongly associated with the three inherent aberration models. The EDOF HIGH design (AUR=4.29) produces least variability between the TFRIQ values obtained with three different inherent aberration levels, closely followed by AOP HIGH (AUR=4.52) with AOMF HIGH (AUR=5.48).
Fig. 4 depicts the TFRIQ values computed at various preset correcting CL centration positions. The performance values were obtained over a 3.5mm pupil diameter, on a schematic eye embedded with a population mean of on-axis spherical aberration (i.e. Model 2 without asymmetric HOA terms). The AOP and EDOF LOW also remains close to the ideal case for most CL decentration levels tested. Conversely, AOMF LOW offers a TFRIQ function that seems to be slightly sensitive to lens decentration compared to AOP and EDOF. The AOP LOW demonstrates performance that is most insensitive to lens centration (AUR=0.35), closely followed by the EDOF LOW design (AUR=0.61). The sensitivity of the performance of AOMF LOW design (AUR=1.51) to lens centration is approximately 3 times that obtained with the AOP and EDOF LOW designs.
Unlike the AOP LOW design, the AOP MED performance is susceptible to lens decentration. A 0.50mm decentration produced a 1.5 log unit change in the RIQ at 1.50D target vergence. On the other hand, the EDOF MED design demonstrated robust performance with lens decentration. The AOMF MED was the most vulnerable of the three designs, a 0.50mm decentration produced a RIQ change of about 2.5 log units at 1.50D target vergence. The variance in TFRIQ as a function of lens decentration levels obtained with AOMF MED (4.79) is approximately 2–3 times more than those obtained with the EDOF MED design AOP MED (2.19) and (AUR=1.35), respectively.
Next, we examine the results of HIGH designs (i.e. column 3 of Fig. 4). Here, the AOMF HIGH lens is the poorest performer with regard to the sensitivity of the TFRIQ curve as a function of lens decentration. A 0.50mm decentration sharply upset the shape of the entire TFRIQ curve, which seems to affect target vergences encompassing 1.00 to 2.00D. Any further decentration would further accentuates the gap between the obtained TFRIQ and the ideal response, pushing the lens to behave like a single vision lens. The AOP HIGH design also appears to be sensitive to lens centration. However, when compared to AOMF HIGH, the effect of decentration on the degradation of the TFRIQ shape with AOP HIGH seems to limit itself to only distance target vergences. The performance of the EDOF HIGH lens seems to be the most robust of the three HIGH designs. The variance in the TFRIQ values as a function of lens centration, obtained with AOMF HIGH (AUR=9.64) are approximately 3 times of that obtained with AOP HIGH (3.69) and EDOF HIGH (3.09).
DiscussionThe impetus for the development of our current theoretical model was to determine the functional capacity of lenses designed with multiple higher order spherical aberrations under varying pupil size, inherent ocular aberrations and lens decentration.27,28,44,55,65 Performance of the EDOF lenses was compared with that of commercial lenses designed with monotonic or concentric power distribution across the optic zone diameter.9,29
To accomplish this task, various scenarios were simulated to reflect reality. Undoubtedly, pupil responses to ambient lighting assert undue influence when evaluating presbyopic correction. Computing the optical performance at various pupils, ranging from 3 to 5mm, should encompass most daily living conditions experienced by presbyopes. Knowing that lens alignment with the pupil center or the corneal geometric center is imperfect, we included a number of preset lens decentered positions. Our previous work indicates that eyes having the same refractive prescriptions but different inherent spherical aberration perform differently when fitted with identical designs.44 We not only took these learnings into account for our current theoretical modeling, but also expanded the concept to include asymmetric aberrations, described here.49
Marsack et al. have proposed numerous (31) retinal image quality metrics to quantify the visual performance of a human eye.63 Their work suggests that visual Strehl ratio in the Fourier domain is the best surrogate of visual performance as it is designed to capture both optical and neural components of the visual processing. For this reason, we have chosen to use this proposed metric for the current modeling exercise. Further, to be able to palpate smaller differences between the lens types, the retinal image quality scale has been log transformed as suggested by Ravikumar et al.66
When an optical system, free of HOA, is imposed with defocus, every location in the entrance pupil has an identical power, which would need only one spherical refraction to correct all pupils. However, introducing spherical aberration forces the best focus (i.e. the refractive correction needed) to become pupil dependent. This observation becomes relevant to those designs that employ monotonic power profiles to ameliorate presbyopic symptoms, particularly the AOMF design in the current experiment. In such instances, an over refraction may become necessary to gauge the ‘true’ through-focus performance. To facilitate a fair comparison of the through-focus performance measures obtained with AOMF designs with the rest of the study lenses, a deliberate offset was made to ‘mimic’ an over refraction of +0.25D for the LOW and MED designs.
Summarizing the results for LOW designs, the performance of the AOP LOW and EDOF LOW stand out for the following reasons: (a) close to the ideal threshold; (b) relatively insensitive to variation in pupil; (c) relatively invariant across different inherent aberrations and (d) performance relatively invariant to lens centration. However, the actual RIQ values obtained by the EDOF LOW designs were marginally higher than AOP LOW. The AOMF LOW design met the threshold requirements, however its performance was twice as more sensitive to pupil than AOP and EDOF counterparts. Clearly, AOMF LOW's performance was distance-centric (as it had highest RIQ values at the distance vergences amongst all the lenses), which made it more akin to single vision than a MFCL. The increased sensitivity of AOMF LOW's TFRIQ to inherent aberration levels and lens centration, further separates AOMF design as a presbyopic lens.
If one were to speculate and extrapolate these optical performance attributes to real world, the AOMF LOW would offer excellent distance performance, like any other single vision, but may not offer much help at near, especially for ‘genuine’ presbyopes, unless they are prescribed with an over-plus refraction. The pupil dependent changes observed suggest inadequate aid at near vergences exacerbated under lower illumination conditions. Further, the small variability in performance with different inherent aberration profiles may be polarizing when applied to a population. In other words, participants with favorable inherent aberration profiles (i.e. low inherent spherical aberration) would benefit from the lenses while those with substantially positive inherent spherical aberration may experience an effect similar to wearing a single vision lens.
On the other hand, presbyopes wearing the AOP LOW or EDOF LOW designs can expect to achieve improvements at near, even in the low-illumination conditions. Additionally, the minimal variance observed in the performance with different inherent aberrations profiles indicates a more predictable outcome across an unselected population. Whether the improvements at near expected with the AOP LOW or EDOF LOW design come at the expense of significant loss (subjective perception) at any other distance needs to be explored in a clinical trial.
Next, we summarize the results for MED and HIGH designs. Unlike the stand out performance observed with the AOP LOW design, the modeled through focus performance responses with the AOP MED and HIGH designs failed to satisfy the ideal threshold response at most pupil sizes. One may argue that they have partially satisfied the ideal curve requirement, at least when gauged in terms of the range of vergences spanned by the TFRIQ curve (where RIQ>−1.50 log units). However, the biggest caveat in their performance is adherence to a ‘bimodal’ trait, more obvious in HIGH than MED. When transformed to a real world setting, this would result in improved performance at near at an expense of performance at intermediate. Further, the performance of the AOP MED and HIGH designs were found to be sensitive to lens decentration. Despite this potential shortcoming, the performance stands relatively invariant to pupil changes and inherent aberrations; whether these positive attributes put the ‘bimodal’ caveat under a shadow would need further clinical investigation.
The AOMF MED and HIGH designs portray attributes that are similar to AOMF LOW design. When compared with corresponding counterparts of AOP and EDOF, performance of AOMF was not only the most sensitive to pupil, but also to inherent aberrations and lens centration. In contrast, the EDOF MED and HIGH designs not only demonstrated reduced sensitivity to pupil and inherent aberrations, but also remained relatively less sensitive to lens centration, when compared to AOP and AOMF. The EDOF MED and HIGH designs distinguish themselves from their AOP counterparts, by not exhibiting bimodality, thus driving them closer to the ideal response. Again, whether the theoretical improvements observed at intermediate and near vergences translate to participant subjective preference of the EDOF MED and HIGH over AOP and AOMF counterparts needs clinical investigation.
The concept of all refractive, simultaneous-image, presbyopic lenses is underpinned by deliberate introduction of multiple powers over a preferred pupil diameter. This is done in an attempt to offer depth-of-focus to the corrected eye. However, it is of paramount importance to note that the magnitudes and signs of the induced aberrations play a critical role in executing the fine balancing act of maintaining retinal image quality over a critical threshold, across the preferred range of target vergences.44 For a deeper understanding on this subject, let us deliberate two simple illustrations. For a specific pupil diameter, if the higher order aberrations of the correcting lens were similar in magnitude to the inherent ocular aberrations (but opposite in sign) then these aberrations would compensate each other, resulting in a low aberrated optical system. This scenario would unsurprisingly precipitate a much better performance for one specific distance but at the expense of poor performance at other distances.44,67 This can be appreciated when AOMF designs were coupled with schematic eyes embedded with aberrations defined by Model 3. Both AOP and EDOF, which do not rely on a monotonic power distribution, result in a performance that is relatively insensitive to inherent aberrations compared to AOMF.
On the other hand, when the accumulated total aberrations (CL+eye system) go beyond a critical threshold, the retinal image quality at one or more distances over the preferred vergences will be diminished to such an extent that its relative measure with respect to any other distances may become unappreciable. This effect can be appreciated by examining the performance obtained with the AOP HIGH design. As the design was predominantly loaded with power compensation for two vergences (distance and near), the accrual of their total aberrations creates an appreciable massive ‘trough’ in the through focus performance, corresponding to an intermediate vergence.27 This would clinically translate to improved performance at near, however with a significant compromise at intermediate. Also, such high levels of aberrations, concentrated in annular ‘chunks’ of the optic zone, would also result in performance that can become exceedingly sensitive to lens centration. Conversely, concentric designs offer performance that is relatively insensitive to pupil compared with monotonic power profile distributions.
Both of the outcomes (performance akin to single vision and performance which is bimodal), would not alleviate the ‘genuine’ presbyopic symptoms, where visual needs span a continuum of distances from far to near. The current theoretical modeling reveals that approaches which either: utilize a monotonic power profile variation (i.e. predominantly involving primary spherical aberration); or employing a concentric-ring type multifocal (where the distribution of power is allocated in distinct zones) suffer undesirable compromises in the through-focus performance resulting from differences in pupil size, inherent aberrations and lens centration. This modeling demonstrates that utilizing the approach that involves deliberately induced multiple, higher-order spherical aberration terms, resulting in a non-monotonic, aperiodic, refractive power profile design may render the performance of such designs less susceptible to variations in pupil, aberrations and centration. However, these optical performance predictions need to be validated by clinical outcomes, which we intend to do in part 2 of this manuscript.
ConclusionWith the computed through focus retinal image quality as the gauge of optical performance, we have demonstrated that lenses designed with deliberately induced multiple, higher-order, spherical aberration terms theoretically render visual performance less susceptible to variations in pupil, inherent ocular aberrations and lens decentration. Especially, when compared to commercial alternatives that are designed based on monotonic power changes or concentric power distribution across the optic zone radius. Whether these incremental improvements to the through focus retinal image quality and its relative insensitivity toward change in pupil, inherent aberrations and decentration actually translate to a clinically palpable outcome needs thorough investigation via human clinical trials.
Conflicts of interestThis project is entirely funded by the Brien Holden Vision Institute and the Institute has proprietary interests in the intellectual property governing extended depth-of-focus contact lenses (Patent application number WO2014059465 A1) and receives royalties from the sale of center-near contact lenses described in this manuscript.
The authors would like to acknowledge Ms. Perera and Dr. Kim for help with actual lens measurements and Ms. J. Sha for help with post-processing the data. Author extends thanks to Mr. D. Tilia, Dr. P. Erickson and Dr. J. Flanagan for reviewing the manuscript.


