


Myopia is considered to be the most common refractive error occurring in children and young adults, around the world. Motivated to elucidate how the process of emmetropization is disrupted, potentially causing myopia and its progression, researchers have shown great interest in peripheral refraction. This study assessed the effect of the myopia type, either refractive or axial, on peripheral refraction and aberration profiles.
MethodsUsing customized schematic eye models for myopia in a ray tracing algorithm, peripheral aberrations, including the refractive error, were calculated as a function of myopia type.
ResultsIn all the selected models, hyperopic shifts in the mean spherical equivalent (MSE) component were found whose magnitude seemed to be largely dependent on the field angle. The MSE profiles showed larger hyperopic shifts for the axial type of myopic models than the refractive ones and were evident in -4 and -6 D prescriptions. Additionally, greater levels of astigmatic component (J180) were also seen in axial-length-dependent models, while refractive models showed higher levels of spherical aberration and coma.
ConclusionThis study has indicated that myopic eyes with primarily an axial component may have a greater risk of progression than their refractive counterparts albeit with the same degree of refractive error. This prediction emerges from the presented theoretical ray tracing model and, therefore, requires clinical confirmation.
Se considera que la miopía es el error refractivo más frecuente a nivel mundial en niños y en adultos jóvenes. Con el objetivo de esclarecer de qué modo se ve perturbado el proceso de emetropización, potencialmente dando lugar a la aparición de miopía y a su progresión, los investigadores se han mostrado muy interesados en estudiar la refracción periférica. Este estudio evalúa en qué medida la refracción periférica y los perfiles de aberración dependen del tipo de miopía predominante, ya sea refractiva o axial.
MétodosPartiendo de modelos de ojo esquemáticos adaptados al caso de la miopía y utilizando un algoritmo de trazado de rayos, se calcularon las aberraciones periféricas, incluyendo el error refractivo, en función del tipo de miopía.
ResultadosEn todos los modelos estudiados, se observó un cambio o desplazamiento hipermetrópico en el equivalente esférico medio (EEM), cuyo valor parecía depender mayormente del ángulo analizado (excentricidad). En los perfiles de EEM se aprecia que dicho desplazamiento hipermetrópico es mayor para los modelos de miopía de tipo axial que para los de tipo refractivo, diferencia que se hace evidente en los casos correspondientes a -4 D y a -6 D. Además, se observó que el coeficiente asociado al término de astigmatismo (J180) presentaba un valor más alto en los modelos con un mayor peso de la miopía axial, mientras que en los modelos predominantemente refractivos se obtuvieron mayores niveles de aberración esférica y de coma.
ConclusionesEste estudio ha concluido que aquellos ojos miopes donde prima la componente axial pueden presentar un mayor riesgo de progresión que ojos miopes que tengan errores refractivos similares pero donde prime la componente refractiva. Esta predicción surge de los resultados teóricos obtenidos en modelos de ojos utilizando un algoritmo de trazado de rayos, por lo que necesitan ser confirmados experimentalmente en el entorno clínico.
Myopia (i.e. short-sightedness) is a common refractive error affecting millions around the world.1,2 It is known that higher degrees of myopia are often coupled with devastating pathological conditions like retinal detachment, maculopathy and glaucoma that can result in loss of functional vision.3,4 Even though the etiology of myopia is still being debated, there is good evidence that the development and progression of myopia is somehow linked with the nature and quality of both the central and the peripheral retinal images. Unlike the fovea, the peripheral retina does not play a vital role in resolution tasks. However, its role in spatial detection and other activities is accredited noteworthy.5,6 For this reason, the role of peripheral refraction in myopic development is not surprising. Peripheral blurred images produced by hyperopic and/or astigmatic defocus leading to myopic development have been proved in many animal studies.7-9 Rempt et al.10 were the first to perform eccentric retinoscopic measurements and presented the peripheral refraction profiles as skiagrams. From these, a link between peripheral refraction and myopia in humans was established by Hoogerheide et al,11 when they discovered that young emmetropic pilots with relative hypermetropic shifts in the periphery developed myopia after their training. Since then, many researchers,12-14,15 [Love J, et al. IOVS 2000;41(Suppl): S302.Abstract 1592]) have been considering and conducting animal and clinical experiments to investigate this correlation. Today, the recent developments in clinical instrumentation and technology have precipitated an enormous interest in peripheral refraction.16,18 Considerable human research is being carried out to study the hypothesis that defocus and astigmatism in the retinal periphery may influence the development and progression of myopia. These studies12-21 have reported diverse peripheral refraction patterns with various levels of ametropia. However, most suggest that emmetropes and hypermetropes have relative myopic shifts in the periphery, while myopes have relative hypermetropic shifts. Moreover, large levels of astigmatism of about 5–7 D were found at around 50° peripheral field angle in emmetropic invivo eyes, however with large individual variations.
Traditionally, myopia has been classified as either refractive or axial in nature.1,2 The refractive-type errors are attributed to curvature changes in cornea and lens, and/or refractive index shifts in one or more ocular media. Axial myopia refers to the errors brought about by the change in aqueous and vitreous chamber depths, i.e. increased axial length. The effect of each isolated ocular parameter on a refractive error has been extensively studied,22,33 and a successful attempt was made recently to propose a mathematical model. This has facilitated the prediction of the effect of individual ocular parameters on refractive errors producing a refractive-error-dependent eye model.34
When considering these individual ocular components, it was found that anatomical parameters had large individual variations.22-24,26,33 However, axial length, i.e. increase in vitreous chamber depth, was widely regarded as the primary determinant of myopic refractive error.22-28,30 Nevertheless, corneal and lens curvatures, refractive indices and retinal contour were also substantial contributors to the myopic refractive error and of importance to a comprehensive understanding of the aetiology of refractive error.24,26-30 Previous research has revealed that myopic progression is probably associated with several factors like environment, studies, lifestyle, genetics, near work35-46 as well as with the optical defocus theory. It is now widely acknowledged that the defocus in the periphery of myopic eyes may stand a stimulus for the axial growth of the eye17-21 but none has looked into the type of myopia, whether refractive or axial, at the start/detection stage and its capability to provoke eye growth.
The scientific community is still unsure whether or not every individual who is discovered to have myopia will also have a potential for progression. We hypothesize that consideration of refractive type might be of value. Accordingly, we attempted to narrow the implicit factors down to only the optical aspects of peripheral astigmatism and hyperopic defocus in spherical myopic models in order to estimate their potential to promote myopia progression. Our aim was to simulate and compare the effects of myopic cause on the peripheral refraction and aberration profile pattern, using a ray tracing technique on a schematic eye model. The possible outcomes may be useful in understanding the influence of myopia type on peripheral refractive error and subsequently may aid in the understanding of myopia progression theory.
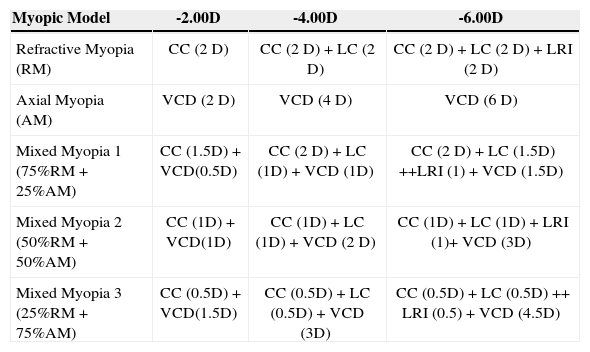
MethodsFor the purpose of this study, we re-classified the type of myopia based on its cause into Refractive, Axial and Mixed modes. We sub-divided the mixed variety into three types; namely Mixed Myopia 1, 2 and 3 according to the degree of refractive and axial constituents. Table 1 shows how the individual ocular parameters were classified and also indicates the specific weightings in diopters (D) that were assigned to each element according to its contribution to the overall myopic refractive error.
Taxonomy of myopic models and contributions of the individual refractive components, in Diopters (D), to the degree of myopia. The rest of the model's parameters were kept constant
| Myopic Model | -2.00D | -4.00D | -6.00D |
| Refractive Myopia (RM) | CC (2 D) | CC (2 D) + LC (2 D) | CC (2 D) + LC (2 D) + LRI (2 D) |
| Axial Myopia (AM) | VCD (2 D) | VCD (4 D) | VCD (6 D) |
| Mixed Myopia 1 (75%RM + 25%AM) | CC (1.5D) + VCD(0.5D) | CC (2 D) + LC (1D) + VCD (1D) | CC (2 D) + LC (1.5D) ++LRI (1) + VCD (1.5D) |
| Mixed Myopia 2 (50%RM + 50%AM) | CC (1D) + VCD(1D) | CC (1D) + LC (1D) + VCD (2 D) | CC (1D) + LC (1D) + LRI (1)+ VCD (3D) |
| Mixed Myopia 3 (25%RM + 75%AM) | CC (0.5D) + VCD(1.5D) | CC (0.5D) + LC (0.5D) + VCD (3D) | CC (0.5D) + LC (0.5D) ++ LRI (0.5) + VCD (4.5D) |
CC: corneal curvatures (Both radii and asphericity constants); LC: lenticular curvatures (Both radii and asphericity constants); LRI: lens refractive index; VCD: vitreous chamber depth.
With Atchison's34 refractive-error-dependent model as baseline and ZEMAX optical design software (Zemax, 2007) as a tool, we developed models for prescriptions of -2.00D, -4.00D and -6.00D with different amounts of contributions from individual ocular parameters, following our classification presented in table 1.
The pre-programmed ‘Optimization’ function in Zemax was used to obtain the correct parameters for the five different myopic models. Optimization is a software routine that helps to improve an optical design and/or attain a design with certain specifications, given a reasonable starting point, target criterion and a set of variables. The criterion comprises weighted operands (i.e. target values) called a merit function; while the variables can be curvatures, thicknesses, glass types, conics and any of the numeric configuration data.
The optimization algorithm in the software was used to ensure that the contributions from the respective sources were as specified. The merit function comprised the on-axis refractive status of the model in terms of MSE, J180 and J45, along with the boundary operands reinforcing each of the ocular parameters to lie within the normal population range. Additionally, a consistent level of root mean square (RMS) of spherical aberration {C(4,0) and C(6,0)}, of around 0.10μm at 6mm pupil, was included in the merit function, which was considered to be a reasonable estimate of the average population measure.47,48 The variables for optimization in each model configuration were as per classification in table 1. Once the target criteria were met, the configuration was saved.
To make the models less complex, some simplifications were incorporated. First, the crystalline lens was considered to have a uniform refractive index; second, there was no tilt or decentration of any of the individual components of the model eyes and, finally, all the models were made rotationally symmetric. Tables A1, A2 and A3 in the Appendix show the complete details for each of the ocular parameter chosen to obtain the required myopic prescriptions.
Ray tracing was performed through the optical system of the selected myopic models at a reference wavelength of 589nm and variable entrance pupil diameters. Regarding the software settings, Robust Ray Aiming cache was switched on; a grid density of 512 × 512 rays per field was used and the pupil plane was referenced as the position of the aperture stop for the entire system's ray tracing analyses. Although chromatic aberrations were not looked at, an Abbe value of 50.20 was given to all components of the ocular media.49
In the Zemax environment, macros were written to convert the output into a format that was more comparable with commonly available clinical aberrometer data sheets. Thus, calculation were made for the RMS of spherical aberration {C(4,0) and C(6,0)} and RMS of coma-like wave-front aberrations {C(3,+/-1) and C(5,+/-1)}, for a 6mm pupil diameter. From the resulting Zernike coefficients at each retinal eccentricity of the selected system, peripheral refraction was also calculated using fourth-order Zernike polynomials for a 3mm pupil in terms of MSE, J180 and J45 components, as described elsewhere.50-52
The following Zernike orders were used for the root mean square (RMS) calculations: spherical (4th and 6th) and comalike (3rd and 5th).10,11 When obtaining the peripheral refraction values at field angles that are away from the reference (0, 0), an elliptical pupil was expected. Accordingly, the method for converting Zernike coefficients into off-axis correction in Zemax was adopted, as described elsewhere.50-52
The peripheral refraction measures for all the prescriptions (Rx: -2 D, -4 D and -6D) and their respective models were measured in terms of MSE, Astigmatism along the 90-180 meridian (J180) and Astigmatism along the 45-135 meridian (J45).
A broad investigation on the relationship between peripheral refractive errors along the horizontal and vertical fields and the different degrees of myopia was made by Atchison et al (2006).20 We computed the patterns and profiles of peripheral refractive error up to 40 degrees of horizontal field for the -2 D, -4 D and -6 D myopic refractive errors using the second-order coefficients provided by them20 and compared these with model-derived values to make a real world comparison.
ResultsMean Spherical Equivalent (MSE)Figure 1 depicts how the MSE component of each myopic model changes with eccentricity.
 against the horizontal field angle. A. Minus 2.00 D, B. Minus 4.00 D and C. Minus 6.00 D. Y-axis represents MSE in diopters, measured at 3 mm pupil, while X-Axis represents the horizontal field angle in steps of 10 degrees.")
For the -2.00D model in figure 1A, there seemed to be no effect of the myopic nature on the trend of the mean spherical equivalent (MSE). The difference between the MSE values for the different models was found to be always less than 0.25D at every tested field angle.
For higher errors, as shown in figures 1B and 1C, it was evident that every myopic class categorized seemed to have a diverse MSE profile. This was particularly noticeable at -6.00D Rx.
Axial (AM) and Mixed Myopia 3 (MM3) models produced higher levels of hyperopic defocus than the rest, with their respective differences varying from 0.25 to 1.25D along the horizontal. This suggests that the myopia that is predominantly axial in nature can produce higher levels of defocus than the myopia that is largely refractive.
For all prescriptions examined, figures 1A, 1B and 1C, it was apparent that the MSE differences between the models were appreciable only at field angles greater than 20°.
Astigmatism Component (J180)Figure 2 illustrates the change in astigmatic refraction component (J180) of each myopic model under study as a function of retinal eccentricity.
 calculated for a 3 mm pupil versus horizontal field angle for various values of nominal refractive error. A. Minus 2.00 D, B. Minus 4.00 D and C. Minus 6.00 D.")
The amount of astigmatism produced by the axial-length-dependent myopic models (AM and MM3) was found to be always greater than that for the refractive models (RM and MM1) for all myopic prescriptions chosen for this comparison. This can clearly be seen in the figures 2A, 2B and 2C.
Similar to what was observed from the graphical representations of MSE, the differences amongst the myopic models in terms of J180 also seemed appreciably higher for larger field positions (>20 degrees), irrespective of the prescription.
The J180 astigmatism component pattern re-calculated from Atchison, seemed to lie close to the model predictions; although with some slight deviations for each of the prescriptions. For the lower and moderate myopic eyes (-2 D and -4 D), the population estimate of astigmatism was found to be higher than the model predicted values.
Astigmatism Component (J45)Since none of the models had tilted and/or decentered ocular elements, the astigmatic component (J45), as expected, was always zero. Likewise, since the retina of all the models were represented by rotationally symmetric aspheric surfaces, the J45 component would also be zero in the vertical meridian.
RMS for Spherical Aberration C (4, 0) and C (6, 0)Figures 3A, 3B and 3C show the changes in RMS of spherical aberration C (4, 0) and C (6, 0) calculated for a 6mm pupil, for each myopic model at every tested field angle. The degree of spherical aberration produced by the axial-length-dependent myopic models (AM and MM3) was, in each case, lower than that of their refractive-component-adjusted counterparts (RM and MM1).
 for spherical aberration—C (4, 0) and C (6, 0)—in microns for a 6 mm pupil diameter for various values of nominal refractive error. A. Minus 2.00 D, B. Minus 4.00 D and C. Minus 6.00 D.")
It can also be seen that the difference between the RMS values for spherical aberration of the various models remains substantially constant as field angle changes.
RMS for COMA-like Aberrations: C (3, +/-1) and C (5, +/-1)Figures 4A, 4B and 4C illustrate the variation in RMS associated to COMA-like aberrations —C (3, +/-1) and C (5, +/-1)— computed for a 6mm pupil for each myopic model and as a function of the field angle. It is evident that, particularly at larger retinal eccentricities, the level of COMA-like aberration produced by the refractive myopic models (RM and MM1) was appreciably higher than the corresponding values obtained for the axial-length-dependent myopic models (AM and MM3).
 of COMA-like Aberrations—C (3, +/-1) and C (5, +/-1)— in microns, for a 6 mm pupil diameter, as a function of field angle, and for various values of nominal refractive error. A. Minus 2.00 D, B. Minus 4.00 D and C. Minus 6.00 D.")
For all prescriptions, the MM2 model, which was constructed to attain the required degree of myopia by incorporating equal contributions from axial and refractive constituents, seemed to straddle the trends of the AM and RM types.
DiscussionIn the course of this study, we have classified myopia in terms of its different optical types, and then used a ray tracing approach to derive the associated peripheral refraction profiles and aberrations across a range of retinal eccentricities. From the results it is clear that myopia which is predominantly axial in nature shows higher levels of defocus (MSE) and astigmatism (J180) than its refractive counterparts. Though obviously not obtained from real eye measurements, the models predicted the peripheral refraction profile's trend to be similar to the in-vivo data we considered for comparison.20,21
To the best of our knowledge, our experiment is the first to attempt to investigate how the myopic type affects peripheral refraction and aberrations. We propose that these findings may be a contributory factor in the development and progression of myopia.
Common parameters to describe peripheral refraction are the Mean Spherical Equivalent (MSE) and astigmatism (J180 and J45) as a function of the retinal eccentricity. These components follow familiar trends but with some dissimilarities between ametropes and emmetropes and also have apparent asymmetries between retinal meridians.12,20,52, [Love J, et al. IOVS 2000;41(Suppl):S302.Abstract 1592] The variations between meridians have been reported to range from 0.0 to 1.0 D, with the vertical meridian being more myopic than the horizontal one, according to some studies, but more hyperopic as concluded in others.20
Previous findings have confirmed that myopic eyes are relatively more hyperopic in the periphery relative to the fovea and all our myopic models are consistent with this view. Myopic eyes can also suffer from other off-axis aberrations, such as coma and trefoil—along with the standard defocus, astigmatism and spherical aberration—which may well play a part in the development of myopia. In this experiment we also looked at how these aberrations vary as a function of the myopic type and found that the refractive models seemingly produced slightly higher levels of these aberrations, particularly at larger field angles. If these aberrations affect myopia development and if so, by what amount, is still unknown.
Although, arguably limited due to the selection of a specific set of ocular components that give rise to the desired amount of myopia, we believe this experiment highlights the possibility that myopic type, through its effect on peripheral refraction and aberration status, may affect myopia progression. However, strong confirmatory clinical findings are needed to support this conclusion. It is important to note that though selective individual ocular component modeling yielded the required levels of myopia and their respective models, all the parameters were found to be within the range of normal values of the population.53-60
In this experiment, we considered the retinal surface to be a rotationally symmetric aspheric surface for all the myopic models and assumed it to be invariable over the range and types of myopic prescription chosen. The rationale was to limit the degrees of freedom so as to keep the experiment simpler. However, some authors suggest that retinal curvatures do differ across myopic eyes depending on its degree and that they are not rotationally symmetric.19 It is important to recollect that the change in the retinal curvatures and or asphericities would effectively change the defocus terms in the periphery, but are unlikely to affect the spherical aberration and coma terms, provided the corneal and the lenticular optics is unchanged.
Previous literature suggests that the anterior chamber depth and lens thickness also contribute to the degree of myopia and peripheral refraction.39 However in this article we have kept them constant. The next generation of models will include these two parameters and will assess their effect on peripheral refraction.
We expect that the ocular changes that have an impact on central refraction, such as a change in the refractive index distribution of the lens, may also play a role in changing refraction in the periphery. Here, we have simplified the model by using a homogeneous refractive index but we believe it would be worthwhile to study in future experiments the effects of different gradient index profiles and the impact they have on the peripheral refraction profiles.
In every case examined, the hyperopic shift in the MSE profile was higher than the population estimate. We estimate the difference could be a result of simplified modeling with homogeneous indices and theoretically assumed parameters. However, the general trend was quite similar to what was expected from the normal experimental data.
The proposed simplified mathematical ray tracing technique itself has revealed substantial information on the relationship between peripheral refraction and aberrations and the type of myopia. We believe that more complex modeling that included exact contributions from ocular components; e.g. gradient index profiles, tilts and decentration, rotational asymmetries etc., could yield even more information and help in part to unfold the mystery of myopic progression. Nevertheless, it has to be borne in mind that these results emerge from an isolated ray tracing experiment, producing a theoretical prediction; thus, we believe that they require clinical confirmation.
In conclusion, we have made a successful effort to examine the variation of peripheral refraction and aberrations over a range of retinal eccentricities as a function of myopia type. In summary, these results, when extrapolated to the real world scenario, indicate that myopia having primarily an axial component may have a higher risk of progression than its refractive counterpart, assuming the same refractive error. This is our theoretical prediction from the current isolated ray tracing experiment, which still requires to be clinically confirmed.
This research was supported in the form of a University International Postgraduate Research Scholarship from the UNSW, Sydney, Australia and a Top-up Scholarship from the Institute for Eye Research and Vision Cooperative Research Centre, Sydney, Australia, both granted to the first author.
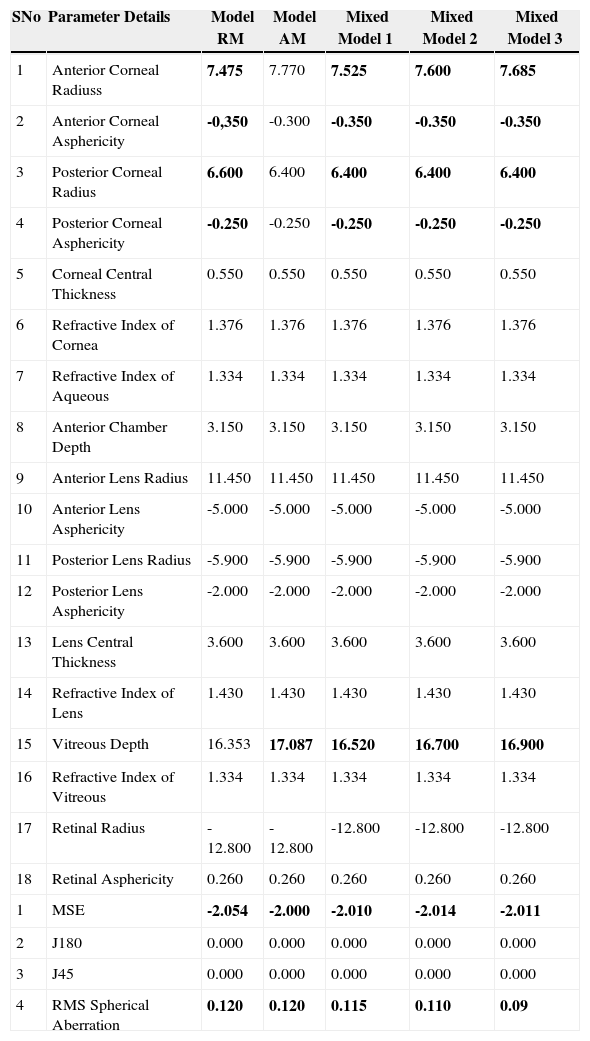
Eye model, prescription -2.00 D. Bold values indicate the parameters that have been changed in order to obtain the required prescription. Units are millimeters for all parameters except refractive index and asphericity (no units), MSE, J180 and J45 (diopters) and Root Mean Square (microns)
| SNo | Parameter Details | Model RM | Model AM | Mixed Model 1 | Mixed Model 2 | Mixed Model 3 |
| 1 | Anterior Corneal Radiuss | 7.475 | 7.770 | 7.525 | 7.600 | 7.685 |
| 2 | Anterior Corneal Asphericity | -0,350 | -0.300 | -0.350 | -0.350 | -0.350 |
| 3 | Posterior Corneal Radius | 6.600 | 6.400 | 6.400 | 6.400 | 6.400 |
| 4 | Posterior Corneal Asphericity | -0.250 | -0.250 | -0.250 | -0.250 | -0.250 |
| 5 | Corneal Central Thickness | 0.550 | 0.550 | 0.550 | 0.550 | 0.550 |
| 6 | Refractive Index of Cornea | 1.376 | 1.376 | 1.376 | 1.376 | 1.376 |
| 7 | Refractive Index of Aqueous | 1.334 | 1.334 | 1.334 | 1.334 | 1.334 |
| 8 | Anterior Chamber Depth | 3.150 | 3.150 | 3.150 | 3.150 | 3.150 |
| 9 | Anterior Lens Radius | 11.450 | 11.450 | 11.450 | 11.450 | 11.450 |
| 10 | Anterior Lens Asphericity | -5.000 | -5.000 | -5.000 | -5.000 | -5.000 |
| 11 | Posterior Lens Radius | -5.900 | -5.900 | -5.900 | -5.900 | -5.900 |
| 12 | Posterior Lens Asphericity | -2.000 | -2.000 | -2.000 | -2.000 | -2.000 |
| 13 | Lens Central Thickness | 3.600 | 3.600 | 3.600 | 3.600 | 3.600 |
| 14 | Refractive Index of Lens | 1.430 | 1.430 | 1.430 | 1.430 | 1.430 |
| 15 | Vitreous Depth | 16.353 | 17.087 | 16.520 | 16.700 | 16.900 |
| 16 | Refractive Index of Vitreous | 1.334 | 1.334 | 1.334 | 1.334 | 1.334 |
| 17 | Retinal Radius | -12.800 | -12.800 | -12.800 | -12.800 | -12.800 |
| 18 | Retinal Asphericity | 0.260 | 0.260 | 0.260 | 0.260 | 0.260 |
| 1 | MSE | -2.054 | -2.000 | -2.010 | -2.014 | -2.011 |
| 2 | J180 | 0.000 | 0.000 | 0.000 | 0.000 | 0.000 |
| 3 | J45 | 0.000 | 0.000 | 0.000 | 0.000 | 0.000 |
| 4 | RMS Spherical Aberration | 0.120 | 0.120 | 0.115 | 0.110 | 0.09 |
RM: refractive myopia; AM: axial myopia; MSE: mean spherical equivalent; RMS: root mean square.
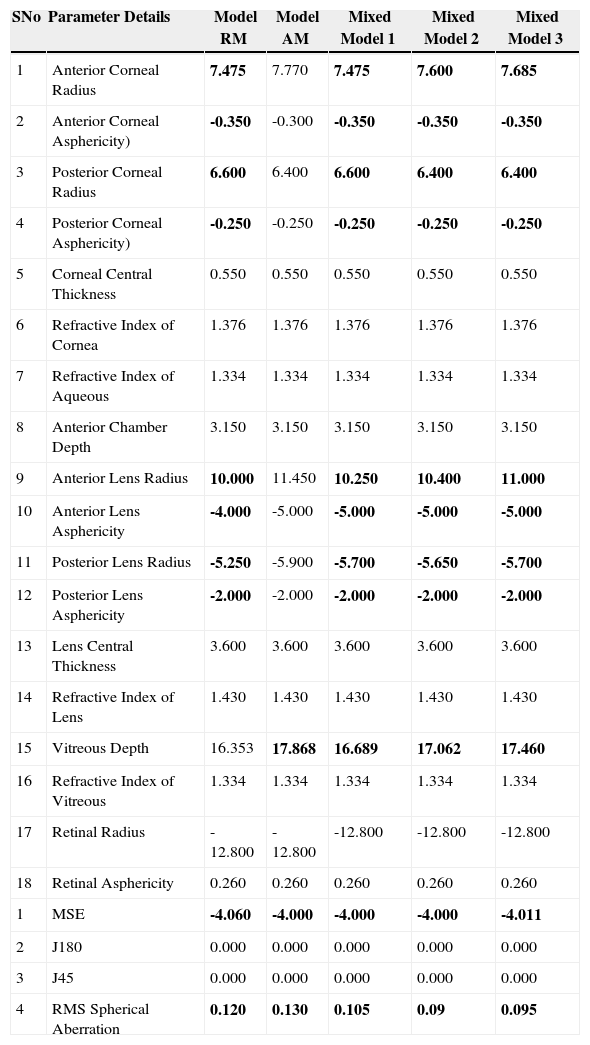
Eye model, prescription -4.00 D. Bold values indicate the parameters that have been changed in order to obtain the required prescription. Units are millimeters for all parameters except refractive index and asphericity (no units), MSE, J180 and J45 (diopters) and Root Mean Square (microns)
| SNo | Parameter Details | Model RM | Model AM | Mixed Model 1 | Mixed Model 2 | Mixed Model 3 |
| 1 | Anterior Corneal Radius | 7.475 | 7.770 | 7.475 | 7.600 | 7.685 |
| 2 | Anterior Corneal Asphericity) | -0.350 | -0.300 | -0.350 | -0.350 | -0.350 |
| 3 | Posterior Corneal Radius | 6.600 | 6.400 | 6.600 | 6.400 | 6.400 |
| 4 | Posterior Corneal Asphericity) | -0.250 | -0.250 | -0.250 | -0.250 | -0.250 |
| 5 | Corneal Central Thickness | 0.550 | 0.550 | 0.550 | 0.550 | 0.550 |
| 6 | Refractive Index of Cornea | 1.376 | 1.376 | 1.376 | 1.376 | 1.376 |
| 7 | Refractive Index of Aqueous | 1.334 | 1.334 | 1.334 | 1.334 | 1.334 |
| 8 | Anterior Chamber Depth | 3.150 | 3.150 | 3.150 | 3.150 | 3.150 |
| 9 | Anterior Lens Radius | 10.000 | 11.450 | 10.250 | 10.400 | 11.000 |
| 10 | Anterior Lens Asphericity | -4.000 | -5.000 | -5.000 | -5.000 | -5.000 |
| 11 | Posterior Lens Radius | -5.250 | -5.900 | -5.700 | -5.650 | -5.700 |
| 12 | Posterior Lens Asphericity | -2.000 | -2.000 | -2.000 | -2.000 | -2.000 |
| 13 | Lens Central Thickness | 3.600 | 3.600 | 3.600 | 3.600 | 3.600 |
| 14 | Refractive Index of Lens | 1.430 | 1.430 | 1.430 | 1.430 | 1.430 |
| 15 | Vitreous Depth | 16.353 | 17.868 | 16.689 | 17.062 | 17.460 |
| 16 | Refractive Index of Vitreous | 1.334 | 1.334 | 1.334 | 1.334 | 1.334 |
| 17 | Retinal Radius | -12.800 | -12.800 | -12.800 | -12.800 | -12.800 |
| 18 | Retinal Asphericity | 0.260 | 0.260 | 0.260 | 0.260 | 0.260 |
| 1 | MSE | -4.060 | -4.000 | -4.000 | -4.000 | -4.011 |
| 2 | J180 | 0.000 | 0.000 | 0.000 | 0.000 | 0.000 |
| 3 | J45 | 0.000 | 0.000 | 0.000 | 0.000 | 0.000 |
| 4 | RMS Spherical Aberration | 0.120 | 0.130 | 0.105 | 0.09 | 0.095 |
RM: refractive myopia; AM: axial myopia; MSE: mean spherical equivalent; RMS: root mean square.
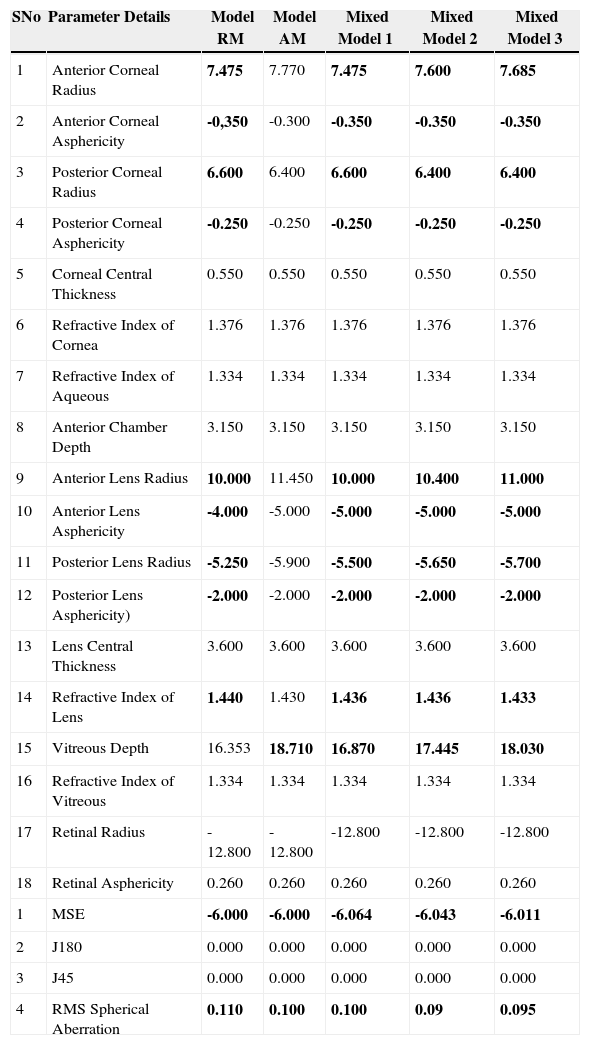
Eye model, prescription -6.00 D. Bold values indicate the parameters that have been changed in order to obtain the required prescription. Units are millimeters for all parameters except refractive index and asphericity (no units), MSE, J180 and J45 (diopters) and Root Mean Square (microns)
| SNo | Parameter Details | Model RM | Model AM | Mixed Model 1 | Mixed Model 2 | Mixed Model 3 |
| 1 | Anterior Corneal Radius | 7.475 | 7.770 | 7.475 | 7.600 | 7.685 |
| 2 | Anterior Corneal Asphericity | -0,350 | -0.300 | -0.350 | -0.350 | -0.350 |
| 3 | Posterior Corneal Radius | 6.600 | 6.400 | 6.600 | 6.400 | 6.400 |
| 4 | Posterior Corneal Asphericity | -0.250 | -0.250 | -0.250 | -0.250 | -0.250 |
| 5 | Corneal Central Thickness | 0.550 | 0.550 | 0.550 | 0.550 | 0.550 |
| 6 | Refractive Index of Cornea | 1.376 | 1.376 | 1.376 | 1.376 | 1.376 |
| 7 | Refractive Index of Aqueous | 1.334 | 1.334 | 1.334 | 1.334 | 1.334 |
| 8 | Anterior Chamber Depth | 3.150 | 3.150 | 3.150 | 3.150 | 3.150 |
| 9 | Anterior Lens Radius | 10.000 | 11.450 | 10.000 | 10.400 | 11.000 |
| 10 | Anterior Lens Asphericity | -4.000 | -5.000 | -5.000 | -5.000 | -5.000 |
| 11 | Posterior Lens Radius | -5.250 | -5.900 | -5.500 | -5.650 | -5.700 |
| 12 | Posterior Lens Asphericity) | -2.000 | -2.000 | -2.000 | -2.000 | -2.000 |
| 13 | Lens Central Thickness | 3.600 | 3.600 | 3.600 | 3.600 | 3.600 |
| 14 | Refractive Index of Lens | 1.440 | 1.430 | 1.436 | 1.436 | 1.433 |
| 15 | Vitreous Depth | 16.353 | 18.710 | 16.870 | 17.445 | 18.030 |
| 16 | Refractive Index of Vitreous | 1.334 | 1.334 | 1.334 | 1.334 | 1.334 |
| 17 | Retinal Radius | -12.800 | -12.800 | -12.800 | -12.800 | -12.800 |
| 18 | Retinal Asphericity | 0.260 | 0.260 | 0.260 | 0.260 | 0.260 |
| 1 | MSE | -6.000 | -6.000 | -6.064 | -6.043 | -6.011 |
| 2 | J180 | 0.000 | 0.000 | 0.000 | 0.000 | 0.000 |
| 3 | J45 | 0.000 | 0.000 | 0.000 | 0.000 | 0.000 |
| 4 | RMS Spherical Aberration | 0.110 | 0.100 | 0.100 | 0.09 | 0.095 |
RM: refractive myopia; AM: axial myopia; MSE: mean spherical equivalent; RMS: root mean square.


