


Most studies of visual development have concentrated on visual development of infants. Only a few studies have extended this to children and determined the point at which visual function becomes truly adult-like. Yet from a clinical and research perspective it is important to know this. This review paper is a discussion of the development of visual acuity and contrast sensitivity into childhood.
MethodsThe literature on subjective (measured with preferential looking or psychophysical methods) and objective (visually-evoked potential) measures of visual acuity and contrast sensitivity was examined with particular emphasis on studies of children over the age of 5 years and those articles that compared different age groups and those that made a comparison with adults.
ResultsVisual acuity was found to be fully mature between the ages of 5 and the mid teenage years, while contrast sensitivity was found to mature fully between the ages of 8 to 19 years. Thus, there is still no clear answer to the fundamental question of when these basic aspects of visual function mature, but it may be later than previously thought.
ConclusionsFurther studies are needed to answer this basic question more precisely and objective measures, such as VEP, may be able to answer this question better than psychophysical methods.
La mayoría de los estudios sobre desarrollo visual se han centrado en el desarrollo visual de bebés. Sólo unos pocos estudios han ampliado el intervalo de edades estudiadas para incluir a niños y han determinado en qué momento la función visual alcanza un estado verdaderamente equiparable al de un adulto. Sin embargo, desde una perspectiva clínica y de interés científico, es importante conocer este dato. En este artículo de revisión se analiza el desarrollo de la agudeza visual y de la sensibilidad al contraste a lo largo de la infancia.
MétodosSe analizaron los artículos científicos existentes sobre medidas de agudeza visual y de sensibilidad al contraste, tanto subjetivas (medidas con la técnica de mirada preferencial o por métodos psicofísicos) como objetivas (potenciales visuales evocados), centrándonos particularmente en aquellos estudios realizados en niños mayores de 5 años y en aquellos artículos donde se compararon diversos grupos de edad entre sí o con un grupo de adultos.
ResultadosSe encontró que para la agudeza visual el ojo alcanza un estado plenamente maduro a una edad comprendida entre los 5 y los 15-16 años, mientras que para la sensibilidad al contraste el ojo alcanza la madurez plena a una edad comprendida entre los 8 y los 19 años. Así, todavía no disponemos de una respuesta clara a la pregunta fundamental de cuándo estos aspectos de la función visual acaban de madurar, pero es posible que esto suceda a una edad más tardía de la que se creía hasta ahora.
ConclusionesEs necesario realizar más estudios para poder dar una respuesta más precisa a esta pregunta básica. Los métodos objetivos de medida, como la técnica de potenciales visuales evocados, podrían ser capaces de dar una mejor respuesta que los métodos psicofísicos.
Visual development has been extensively studied in infants (up to one year of life), during which time there is rapid development, but there has been less interest in its development into childhood. The critical period is commonly understood to be the period during which an abnormal visual experience can influence the development of the sensory visual system.1 However, it has become apparent that there is not just a single critical period for humans and, of course, it differs again between species. It is clear that the development of the different aspects of human visual function occur at different rates.1-3 The period of normal development (the age at which vision is fully adult-like) may be different from the period during which deprivation may be effective, which may also be different from the period during which treatment is effective.1,4 Lewis and Maurer1 suggested this, and indicated that grating acuity is adult-like by 4-6 years and letter acuity by 6 years of age. Daw4 stated that adult-like levels of 30 cycles per degree (cpd) (∼6/6) are reached by 3 years, and clinically, it is certainly assumed that VA is similar to an adult value of 6/6 by 5 years. In order to know if there is, in fact, a difference between the critical period for development and damage, accurate data on both are required. This knowledge may influence when and if treatment is initiated e.g. occlusion therapy for amblyopia. The knowledge will also influence when adult normal data may be applied to children. Apart from any practical benefits, the age at which children's visual function is adult-like is also an interesting question in its own right.
Defining when visual function in children is completely adult-like is difficult. If a subjective method is used, then differences in performance between children and adults may be due to actual differences in vision or maybe due to differences in behaviour. Even using a forced-choice technique does not eliminate potential differences because of the way children perform in a testing situation.5,6 It might be thought that objective testing, such as visually evoked potential (VEP) testing, would be free from these problems. However, children may attend to the target differently, or there may be other factors, such as differences in thickness of the skull which may influence the results.7,8 Despite these difficulties, it is still interesting and important to consider the question of when vision becomes adult-like. At the very least, we can describe the expected agerelated norms for a clinical testing situation. In this review we considered two main aspects of sensory development; visual acuity (VA) and contrast sensitivity (CS) development.
MethodsWe gathered papers by searching on Medline and Scopus and also by undertaking backward searches of some of the more recent papers on visual acuity or contrast sensitivity in children. We also undertook a cited reference search of some of the key papers of which we were already aware. As we were interested in when vision becomes adult-like, we concentrated on studies of children's vision (as opposed to infants). We included studies that involved children with normal vision that were five years old or more and that also either compared age groups above this age or included adult data measured with the same protocol for comparison. We grouped the results according to whether they focused on visual acuity or on contrast sensitivity (although some papers deal with both) and into studies using subjective (psychophysical or behavioural) techniques and those using objective techniques (VEP) for measurement.
ResultsVisual Acuity DevelopmentThere are at least two types of visual acuity, recognition acuity and resolution acuity.9 Recognition acuity relates to the detail in the smallest letter, number or other shape that can be recognised and resolution acuity is the smallest separation between dots or between bars in a grating that can be resolved. The data available on either resolution or recognition acuity in children are minimal. There are two main methods that can be used to measure the visual acuity in children; 1. Psychophysical/ behavioural methods, which require some response from the child and 2. Objective methods, such as patternVEP (pVEP).
Studies Using Subjective / Behavioural MethodsThe most common behavioural method used to investigate infant vision by researchers is the forced choice preferential looking (FPL) test. The FPL technique was conceived by Davida Teller10 and has been used by various research groups such as Dobson et al.,11 Atkinson and Braddick,12 Banks and Salapatek13 and Gwiazda et al.14 In FPL the observer presents a display to the child, half of which is plain and the other half contains a pattern. They measure resolution acuity, using either a grating target as with the Teller cards (Figure 1A), or the vanishing optotype principle, as with the more recently developed Cardiff Acuity Cards15(Figure 1B). The child will tend to look at the pattern if she or he can resolve it. This technique becomes a “forced choice” method when the observer has to decide, based on their observation of the child's head and eye movements, where the stimulus is located. The threshold is usually defined as when the observer is correct 75% of the time. Operant preferential looking (OPL) is a modification of the forced-choice preferential looking test. In the OPL test, some kind of reward, such as the appearance of an animated toy, is given to the child when the observer is able to correctly determine the position of the target. When the observer makes a correct judgment, it implies that the child made a correct looking response. These methods were developed into the acuity card technique which is now used clinically. In the acuity card technique, rather than finding the 75% correct level, the threshold is defined as when the child makes a “clear” look (see figure 2 for the acuity cards being used in a clinical setting). There have been numerous studies of visual acuity development in infants using these techniques which are generally in agreement, showing that VA develops from about 1 cycle per degree (this is often taken to be equivalent to 6/180 Snellen=0.0333 decimal acuity) in the newborn to 2.6-12 cycles per degree (cpd) at one year.16,17


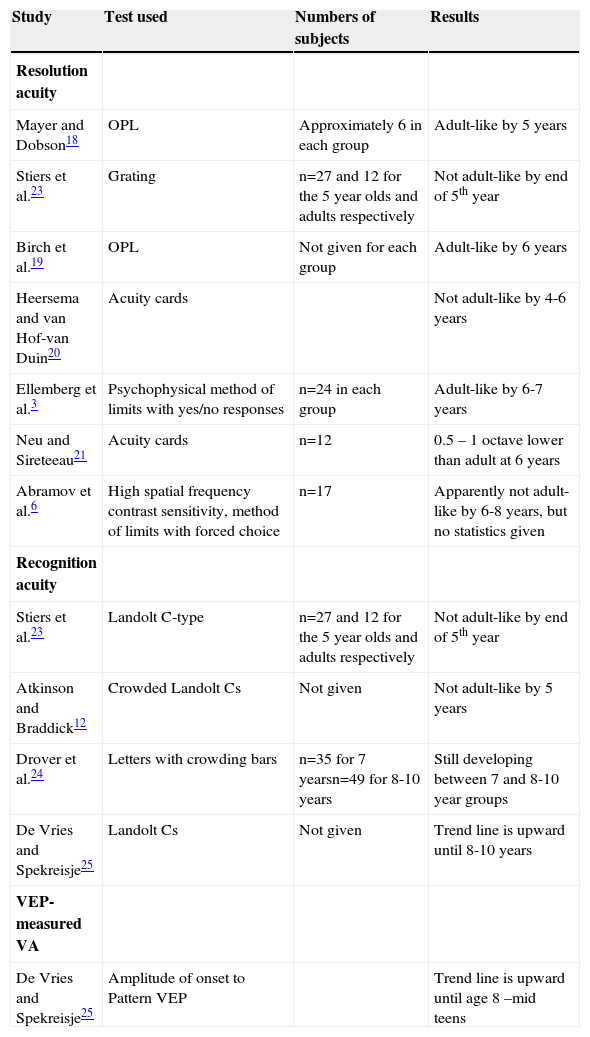
Atkinson and Braddick12 used OPL with older children and found that by the age of 3 years resolution acuity was very close, but not equal to adult values. Table 1 summarises the results of those studies of the development of VA that included 5-year old or older children. Mayer and Dobson,18 using OPL, showed that acuity develops systematically with age up to 40 cpd at 5 years. There was no statistical difference between the VA of the 4 and 5 year olds and the adults. Birch et al.,19 also using an operant procedure, found that visual acuity reached the adult asymptote at the age of 6. Heersema and van Hof-van Duin20 and Neu and Sireteeau,21 both using acuity cards, found that VA was not yet adult-like by 4 or by 6 years, respectively. Abramov et al.6 showed a difference between the 6-8 and the 18-40 year olds at the high end of the spatial frequency curve, but did not provide statistics. On the other hand, Ellemberg et al.3 found that acuity by 6-7 years was not significantly lower than that measured for adults.
Studies of VA development in children that were 5 years old and above. Studies are listed in order of findings re. when acuity is adult-like; i.e. those finding an earlier age of maturation are listed first. OPL = operant preferential looking
| Study | Test used | Numbers of subjects | Results |
| Resolution acuity | |||
| Mayer and Dobson18 | OPL | Approximately 6 in each group | Adult-like by 5 years |
| Stiers et al.23 | Grating | n=27 and 12 for the 5 year olds and adults respectively | Not adult-like by end of 5th year |
| Birch et al.19 | OPL | Not given for each group | Adult-like by 6 years |
| Heersema and van Hof-van Duin20 | Acuity cards | Not adult-like by 4-6 years | |
| Ellemberg et al.3 | Psychophysical method of limits with yes/no responses | n=24 in each group | Adult-like by 6-7 years |
| Neu and Sireteeau21 | Acuity cards | n=12 | 0.5 – 1 octave lower than adult at 6 years |
| Abramov et al.6 | High spatial frequency contrast sensitivity, method of limits with forced choice | n=17 | Apparently not adult-like by 6-8 years, but no statistics given |
| Recognition acuity | |||
| Stiers et al.23 | Landolt C-type | n=27 and 12 for the 5 year olds and adults respectively | Not adult-like by end of 5th year |
| Atkinson and Braddick12 | Crowded Landolt Cs | Not given | Not adult-like by 5 years |
| Drover et al.24 | Letters with crowding bars | n=35 for 7 yearsn=49 for 8-10 years | Still developing between 7 and 8-10 year groups |
| De Vries and Spekreisje25 | Landolt Cs | Not given | Trend line is upward until 8-10 years |
| VEP-measured VA | |||
| De Vries and Spekreisje25 | Amplitude of onset to Pattern VEP | Trend line is upward until age 8 –mid teens |
There have been very few studies comparing recognition acuity in children and adults. Figure 3 shows some examples of recognition acuity. Although numerous matching tests using pictures (Figure 3A), shapes (Figure 3B) or letters (Figure 3B) have been developed for preschool children, many of these do not have published norms and many of the studies that do give normal data fail to compare this with an adult group.17,22 Stiers et al.23 measured both grating and Landolt-C acuity and found that neither had reached adult levels by the end of the fifth year. Atkinson and Braddick12, using Snellen acuity, found that crowded optotype acuity was 58% of that of adults at 5 years of age. Drover et al.24, using crowded optotypes, found a difference between 7 year olds and 8-10 year olds, but did not comment on whether there was a difference between 8-10 year olds and adults. De Vries and Spekreisje25 showed data that indicate that the trend line continues upward until the mid-teens, but there was no statistical analysis.

From table 1 it can be seen that, taking the studies together, there is some evidence that grating acuity matures earlier than recognition acuity. The mode seems to show that grating acuity has reached adult levels by 6-7 years (rather than before 6 or after 6). The evidence from studies of recognition acuity indicates that it matures sometime between 7 years and the mid-teens. There are a number of factors that may influence the different findings between studies, e.g. methods used or sample size. It must be remembered that these results include the influence of behavioural and cognitive differences between adults and children, which will be discussed later.
Studies Using Objective MethodsObjective methods used for the assessment of visual acuity development are mainly pattern steady-state VEP (ssVEP) and variations of pattern VEP such as sweep VEP (sVEP). Pattern VEP can be used to measure VA by measuring the response amplitude of the VEP at each frequency, for a range of spatial frequencies. The amplitude is plotted against spatial frequency and a regression fit is used to determine the point at which the response would become zero, which is used as an estimate of VA. Sweep VEP essentially performs the same operation, but the spatial frequencies are varied very quickly over time and the amplitudes are immediately plotted with respect to spatial frequency (or time). For example, to measure VA, the spatial frequency changes from low to high in about 10-20 seconds. The regression line of the response amplitude is extrapolated to zero, which gives a measure of the VA.8,26-33Figure 4A shows a video of the sweep VEP stimulus for VA testing and figure 4B is a plot of the resultant VEP amplitude against spatial frequency. Each measure of sweep VEP measures vision faster than regular pattern VEPs, so it is ideal for children who have shorter attention spans than adults.
. B. A sVEP plot showing the amplitude in μV plotted against spatial frequency (1 to 40 cpd) used to estimate visual acuity. The recording was taken from the Oz electrode (mid-line just above the visual cortex) and the open circles show the background noise at each spatial frequency. The pink line is the regression line extrapolated to zero amplitude, which is usually taken as the threshold. The vertical dotted lines show the data that was included to fit the regression line. The recording was at 2F i.e. two times the fundamental temporal frequency.")
A. Shows a video of the stimulus for sweep VEP measurement of VA (link to movie in electronic PDF version, available at: www.journalofoptometry.com). B. A sVEP plot showing the amplitude in μV plotted against spatial frequency (1 to 40 cpd) used to estimate visual acuity. The recording was taken from the Oz electrode (mid-line just above the visual cortex) and the open circles show the background noise at each spatial frequency. The pink line is the regression line extrapolated to zero amplitude, which is usually taken as the threshold. The vertical dotted lines show the data that was included to fit the regression line. The recording was at 2F i.e. two times the fundamental temporal frequency.
Most investigations using VEP to measure VA have studied infants. VEP-measured VA tends to be higher than OPL acuity in the first year of life.34-36 The difference decreases with age until about 12 months. By one year of age, VEP estimates of visual acuity are closer to adult levels than those estimates based on behavioural techniques. Norcia and Tyler,26 using sVEP, showed that visual acuity increased from a mean of 4.5 cpd during the first month to about 20 cpd at 8-13 months of age. By 8 months the authors stated that it was not “reliably different” from adults (24.3 cpd), but this difference was not tested statistically. In 1989, Hamer et al.37 reported similar data. Note that, in adults, VEP often gives lower sensitivity values than psychophysical methods.36,38 In a later study, Norcia et al.38 reported that visual acuity was 16.4 cpd at 7 months. Skoczenski and Norcia39 showed that VEP VA at one year is within about one octave of adult acuity; i.e. it is closer to adult's acuity than PL, but still not adult-like. Sokol et al.35 also showed results that indicate that VEP acuity at one year is still different from that measured on adults. It is important to recognise that the exact measure of VA obtained with sVEP or ssVEP depends on many parameters; e.g. whether data from electrodes is averaged or the best value is taken,37 whether a checkerboard or a grating is used, and the exact method for estimating the acuity threshold. Thus, when comparing infants and children with adults, the same techniques should be used on both. Of the studies mentioned above, Norcia and Tyler,26 Sokol et al.35 and Skoczenski and Norcia39 included control adult subjects.
There are almost no data on visual acuity development using either sVEP or ssVEP techniques in children above the first year of life. In fact, the only study of visual acuity itself is that of De Vries and Spekreisje25 using a pattern VEP. Their plotted results showed that the threshold clearly decreases until 8 years of age, reaching a plateau somewhere in the teens. Gordon and McCulloch2 used a VEP technique to investigate parallel visual pathway development in primary school age children. They found that the magnocellular (M) pathway develops earlier than parvocellular (P) pathway and that there was some evidence that the P pathway is not developed by 5 years. The P pathway is considered to be the main carrier of high contrast, color perception and high spatial frequency (detail) information, especially at lower temporal frequencies (slowly moving or static targets); i.e., visual acuity information.
Thus, the studies using subjective/behavioural techniques indicate that there is some variability in the exact age at which VA is adult-like in children. It appears that VA reaches adult levels somewhere between 6 and 10 years of age. There is even less data using VEP, but those that do exist seem to suggest an even later age for full development.
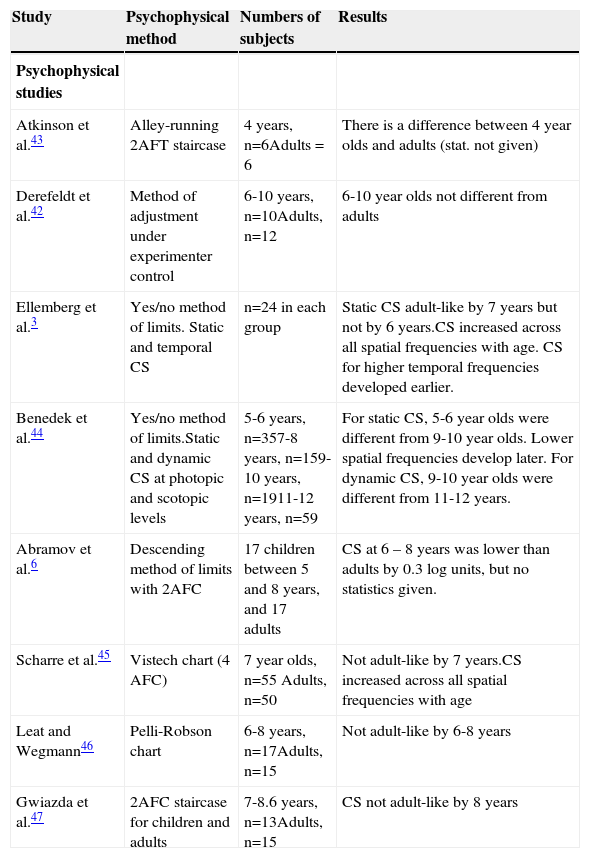
Contrast Sensitivity DevelopmentMeasurement of contrast sensitivity has emerged as “the most complete single measure of human spatial vision”40. It describes vision and vision loss more completely than the single high frequency cut-off point, which represents the resolution of the visual system; i.e. visual acuity. There has been more attention to CS development in childhood than to VA development. Most of these studies have used psychophysical methods and table 2 summarises the results of those studies of CS development. The results show that CS becomes adult-like somewhere between 7 years3 and 9-12 years.41 Some studies had small sample sizes at the critical ages5 while others grouped the children into rather large age spans,41,42 which makes it difficult to define exactly the age at which vision becomes fully adult-like. Other studies did not report statistics.6,43 Studies that used a yes/no method3,44 may not be ideal, given that children may exhibit a different criterion than adults. Those studies that did use an alternative forced choice40,45-47 seem to be in agreement that CS is still not adult-like by 8 years. Despite using age groups with larger spans Mantyjarvi and Laitenen48 did not find CS to be fully developed even in the 10-19 year olds.
Studies of contrast sensitivity (CS) development in children that were 5 years old and above. Studies are listed in order of findings re. when CS is adult-like; i.e. those finding an earlier age of maturation are listed first. AFC = alternative forced choice
| Study | Psychophysical method | Numbers of subjects | Results |
| Psychophysical studies | |||
| Atkinson et al.43 | Alley-running 2AFT staircase | 4 years, n=6Adults = 6 | There is a difference between 4 year olds and adults (stat. not given) |
| Derefeldt et al.42 | Method of adjustment under experimenter control | 6-10 years, n=10Adults, n=12 | 6-10 year olds not different from adults |
| Ellemberg et al.3 | Yes/no method of limits. Static and temporal CS | n=24 in each group | Static CS adult-like by 7 years but not by 6 years.CS increased across all spatial frequencies with age. CS for higher temporal frequencies developed earlier. |
| Benedek et al.44 | Yes/no method of limits.Static and dynamic CS at photopic and scotopic levels | 5-6 years, n=357-8 years, n=159-10 years, n=1911-12 years, n=59 | For static CS, 5-6 year olds were different from 9-10 year olds. Lower spatial frequencies develop later. For dynamic CS, 9-10 year olds were different from 11-12 years. |
| Abramov et al.6 | Descending method of limits with 2AFC | 17 children between 5 and 8 years, and 17 adults | CS at 6 – 8 years was lower than adults by 0.3 log units, but no statistics given. |
| Scharre et al.45 | Vistech chart (4 AFC) | 7 year olds, n=55 Adults, n=50 | Not adult-like by 7 years.CS increased across all spatial frequencies with age |
| Leat and Wegmann46 | Pelli-Robson chart | 6-8 years, n=17Adults, n=15 | Not adult-like by 6-8 years |
| Gwiazda et al.47 | 2AFC staircase for children and adults | 7-8.6 years, n=13Adults, n=15 | CS not adult-like by 8 years |
Similar to its use for acuity thresholds, VEP can be used to measure contrast thresholds. In this case contrast is the parameter that is varied, and contrast thresholds are determined by extrapolation to zero amplitude. Figure 5A shows a video of the sweep VEP stimulus for CS testing and figure 5B is a plot of the resultant VEP amplitude against contrast. Sweep VEP has been developed for this purpose38 and a ssVEP may also be used. Sweep VEP has been used to study CS development in infants38,49 and has shown that CS develops rapidly for both low and high frequencies in the first 3-4 months of life. Norcia et al.38 found that there are two phases in the development of contrast sensitivity and acuity. Between the 4th and the 9th week, overall contrast sensitivity increased by a factor of 4-5 at all spatial frequencies. Beyond 9 weeks, contrast sensitivity at low spatial frequencies remained relatively constant, while sensitivity increased systematically at higher spatial frequencies.
. B. shows a similar plot to Figure 4B but for contrast sensitivity measurement. In this case amplitude is plotted against % contrast.")
A. Shows a video of the stimulus for sweep VEP measurement of contrast sensitivity. (link to movie in electronic PDF version, available at: www.journalofoptometry.com). B. shows a similar plot to Figure 4B but for contrast sensitivity measurement. In this case amplitude is plotted against % contrast.
As for VA, there are very few studies which have used objective, VEP techniques to study CS development in childhood. De Vries and Spekreisje25 showed that the trend line was upward until 7 years, but this relates to the optimum checkerboard size, rather than contrast sensitivity per se.
It can be seen that there is considerable variation between the various studies; while some showed that CS develops by 7 years, others gave an age of maturation as high as 10-19 years.
DiscussionIt is clear from tables 1and2 that the vast majority of studies of VA and CS in childhood have used psychophysical techniques, rather than objective techniques. The differences between adults and children may be due to actual developmental changes within the visual system. It is known that the fovea is not fully developed by 45 months.50 Wilson concluded that the immaturities of the retina accounted for most of the difference between infants and adults,51 while Banks,7 using his own model and remodelling Wilson's model,51 concluded that the retinal changes do not fully account for the poorer vision in infants, and that post-receptural immaturities are also responsible. There are known late changes that occur in the visual cortex, where there is an actual loss of synapses from the age of 8 months to 11 years,52-54 although there is no documented loss of neurons.55
However, the differences between children and adults in psychophysical studies may not be completely due to immaturities in the visual system. Children behave differently from adults in the testing situation. For example, they may have more variable or shorter attention, or may use different criteria in a yes/no paradigm. Some studies have concluded that these non-neural factors do not explain the differences, in part because the differences were not found to be similar for different visual functions, as would be expected if behavioural differences were the cause.3,47 If criterion differences affect results in yes/no situations, then the use of an alternative forced choice method to eliminate the effects of criterion differences between subjects might alleviate this problem. It has been noted that children start to guess when they reach threshold, while adults continue to attempt to detect the stimulus.5,6,43 Thus, even a forced-choice method will not eliminate all potential causes of differences.
ConclusionThus, there is still no clear answer to the fundamental question of when these basic aspects of visual function mature. Traditional psychophysical methods may never be able to conclusively answer this, because of the different way that children and even teenagers may perform in a testing situation. Future studies should consider the use of the objective tools that are at hand to explore this question further, in particular as there are so few studies that have attempted to use VEP to study vision in childhood.
Thanks to Fahad Almoqbel for his help with some figures and to Vladimir Vildavski for preparing the video segments.


