


Several studies have suggested that accommodative and non-strabismic binocular dysfunctions are commonly encountered in optometric practice. This study aims to verify whether these findings apply to a Portuguese clinical population.
MethodsThis study included consecutive nonpresbyopic subjects that came to two Portuguese optometric clinics over a period of six months. A complete visual exam was conducted and included the measurement of visual acuity (VA), refraction, near point of convergence (NPC), distance and near phoria, near and distance fusional vergences, amplitude of accommodation (AA), monocular accommodative facility (MAF), relative accommodation and lag of accommodation.
Results156 subjects with a mean age of 24.9 ± 5.3 years (from 18 to 35 years old) participated in the study. Of all subjects, 32 % presented binocular vision and/or accommodative disorders accompanied or not by refractive errors. Moreover, 21.1 % had accommodative disorders, and 10.9 % had a binocular vision dysfunction. Accommodative insufficiency (11.5 %) was the most prevalent disorder, followed by convergence insufficiency (7.1 %) and accommodative infacility (5. 8 %).
ConclusionsClinicians should be aware that about one third of the optometric clinical population could have accommodative and/or non-strabismic binocular disorders. Accommodative insufficiency was the most prevalent dysfunction presented in the studied population, followed by accommodative infacility and convergence insufficiency.
Accommodative and non-strabismic binocular vision dysfunctions are visual disorders that could affect the visual performance of subjects, particularly when performing near vision tasks. Several studies have suggested that accommodative and non-strabismic binocular dysfunctions are commonly encountered in optometric practice. However, there is still certain discrepancy with regard to the prevalence values presented by different authors (Table 1). One of the main reason for these discrepancies may be the various diagnostic criteria used to classify the accommodative and binocular dysfunction1 as well as different study populations.2 For example, extended focusing and vergence efforts lead to adaptive behaviours in the accommodation and vergence systems.3 and the university students, one of the main population studied, spend several hours performing near vision tasks what could result in an higher prevalence of accommodative and binocular dysfunctions compared to other populations.4 On the other hand, the norms used to compare the results of the clinical exams are usually the same for different populations, which can drive in some cases to false positives and, in other cases, to false negatives.
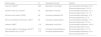
Prevalence of binocular vision dysfunctions obtain in different studies.
| Authors (year) | N | Population/Country | Results |
|---|---|---|---|
| Lara et al. (2001)5 | 265 | Optometric clinic/Spain | Accommodative disorders: 9.4 % |
| Binocular dysfunctions: 12.9 % | |||
| Hoseini-Yazdi et al. (2015)6 | 83 | Optometric clinic/Iran | Accommodative disorders: 7.2 % |
| Binocular dysfunctions: 12.1 % | |||
| Richman and Laudon (2002)7 | 48 | University students/USA | Accommodative disorders: 15 % |
| Binocular dysfunction: 27 % | |||
| Porcar and Martinez-Palomera (1997)8 | 65 | University students/Spain | Accommodative disorders: 17 % |
| Binocular dysfunction: 15.3 % | |||
| Hokoda (1985)9 | 119 | Optometric clinic/USA | Accommodative disorders: 16.8 % |
| Binocular dysfunction: 4.2 % | |||
| Ovenseri-Ogbomo and Eguegu (2016)10 | 212 | University students/Nigeria | Binocular dysfunction: 12.7 % |
| García-Muñoz et al. (2016)11 | 175 | University students/Spain | Accommodative disorders: 2.3 % |
| Binocular dysfunction: 8 % |
Considering that binocular and accommodative dysfunctions are pointed out as common findings, the principal objective of this study is to determine their prevalence in a Portuguese population from optometry offices, with the scope of guiding clinicians in their practice. We also aim to compare our clinical exams results with the norms usually used and verify if the values found in our population are in accordance with them. Understanding the most frequent symptoms in this type of dysfunctions, as well as the most altered clinical results, can help clinicians to diagnose these problems more easily.
Material and methodsThis study included 156 consecutive nonpresbyopic patients who visited two private optometric clinics located outside university campus over 6 months. Patients aged between 18 and 35 years old and visual acuity correctable to at least 6/6 were included in the study whether they accepted the invitation to participate. Those with a history of systemic or ocular disease, taking any medication, wearing contact lens, with strabismus or amblyopia were excluded.
All the subjects signed an informed consent form and the protocol was approved by the Ethical Committee of the Sciences School of University of Minho and posteriorly, by the Comissão de Ética para a Investigação em Ciências da Vida e da Saúde (CEICVS) of University of Minho
A complete visual exam was conducted and included the following procedures and tests:
- 1
A case history, with particular attention for the symptomatology. It was asked how often (i.e., never, rarely, sometimes, frequently or always) the patients had the typical symptoms of accommodative and binocular vision disorders.22 These symptoms included asthenopia, headache, blur vision at near and/or at distance, diplopia, photophobia. The patient was considered as having a symptom if he/she reported to feel it at least sometimes.
- 2
Objective and subjective refraction. Static retinoscopy was done, followed by the subjective exam with an endpoint of maximum plus for best visual acuity. This correction was then used during all the accommodative and binocular vision exams.
- 3
The accommodative tests performed were amplitude of accommodation (AA), positive and negative relative accommodation (PRA and NRA), lag of accommodation and accommodative facility (AF).
AA was determined by the minus lens method, the NRA was obtained before PRA, the lag of accommodation by dynamic retinoscopy with the Monocular Estimate Method (MEM), and the AF started with the plus lens and using a ± 2.00 D flipper.
- 4
Horizontal phorias and positive and negative fusional vergences were determined for both distance and near vision with the von Graefe method. The negative fusional vergence was measured before the positive fusional vergence. The near point of convergence (NPC) was measured with an accommodative target
- 5
Ocular health exam with ophthalmoscopy and biomicroscopy.
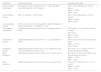
The selected optometric tests were due to their generalization in the clinical practice and the availability of related normative data studies. Namely, the results of the tests were compared with the expected values according to Morgan.12,13 Accommodative and nonstrabismic binocular dysfunctions were diagnosed according to the criteria presented by Lara et al. (Table 2).5 These researchers divided signals into two categories: fundamental and complementary and to be diagnosed with a dysfunction, a subject has to have the fundamental signals and at least two of the complementary signals of the respective dysfunction. A subject not satisfying these criteria or only with a refractive error were considered as “normal”.
Fundamental and complementary signs used as diagnosis criteria for accommodative and binocular dysfunctions. (Adapted from Lara et al.5).
AA: Monocular Amplitude of Accommodation; MAF: Monocular Accommodative Facility; BAF: Binocular Accommodative Facility; MEM: Monocular Estimate Method retinoscopy; PRA: Positive Relative Accommodation; NRA: Negative Relative Accommodation; NPC: Near Point of Convergence; NFV: Negative Fusional Vergence; PFV: Positive Fusional Vergence.
Statistical analysis was performed using SPSS (Statistical Package for Social Sciences, version 22) software. As a measure of central tendency the mean was used, and as a measure of dispersion the standard deviation. In order to apply the parametric and non-parametric statistical tests, it was verified the normality assumption of the distributions of the variables. For that, the Kolmogorov-Smirnov (K-S) test was used, which places the null hypothesis of the variable following a normal distribution. It was considered the existence of normality of the distribution of variables for values of statistical significance p > 0.05.
The mean values were compared using the t-test and ANOVA, for variables with normal distribution and the Mann-Whitney and Kruskal-Wallis for variables without normal distribution. For all hypotheses tested, a p ≤ 0.05 was considered statistically significant.
ResultsOne hundred fifty-six subjects with mean age of 25.8 ± 5.3 years (from 18 to 35 years old) participated in the study. Fifty-eight percent were women and they all came to the optometric clinics during the study period.
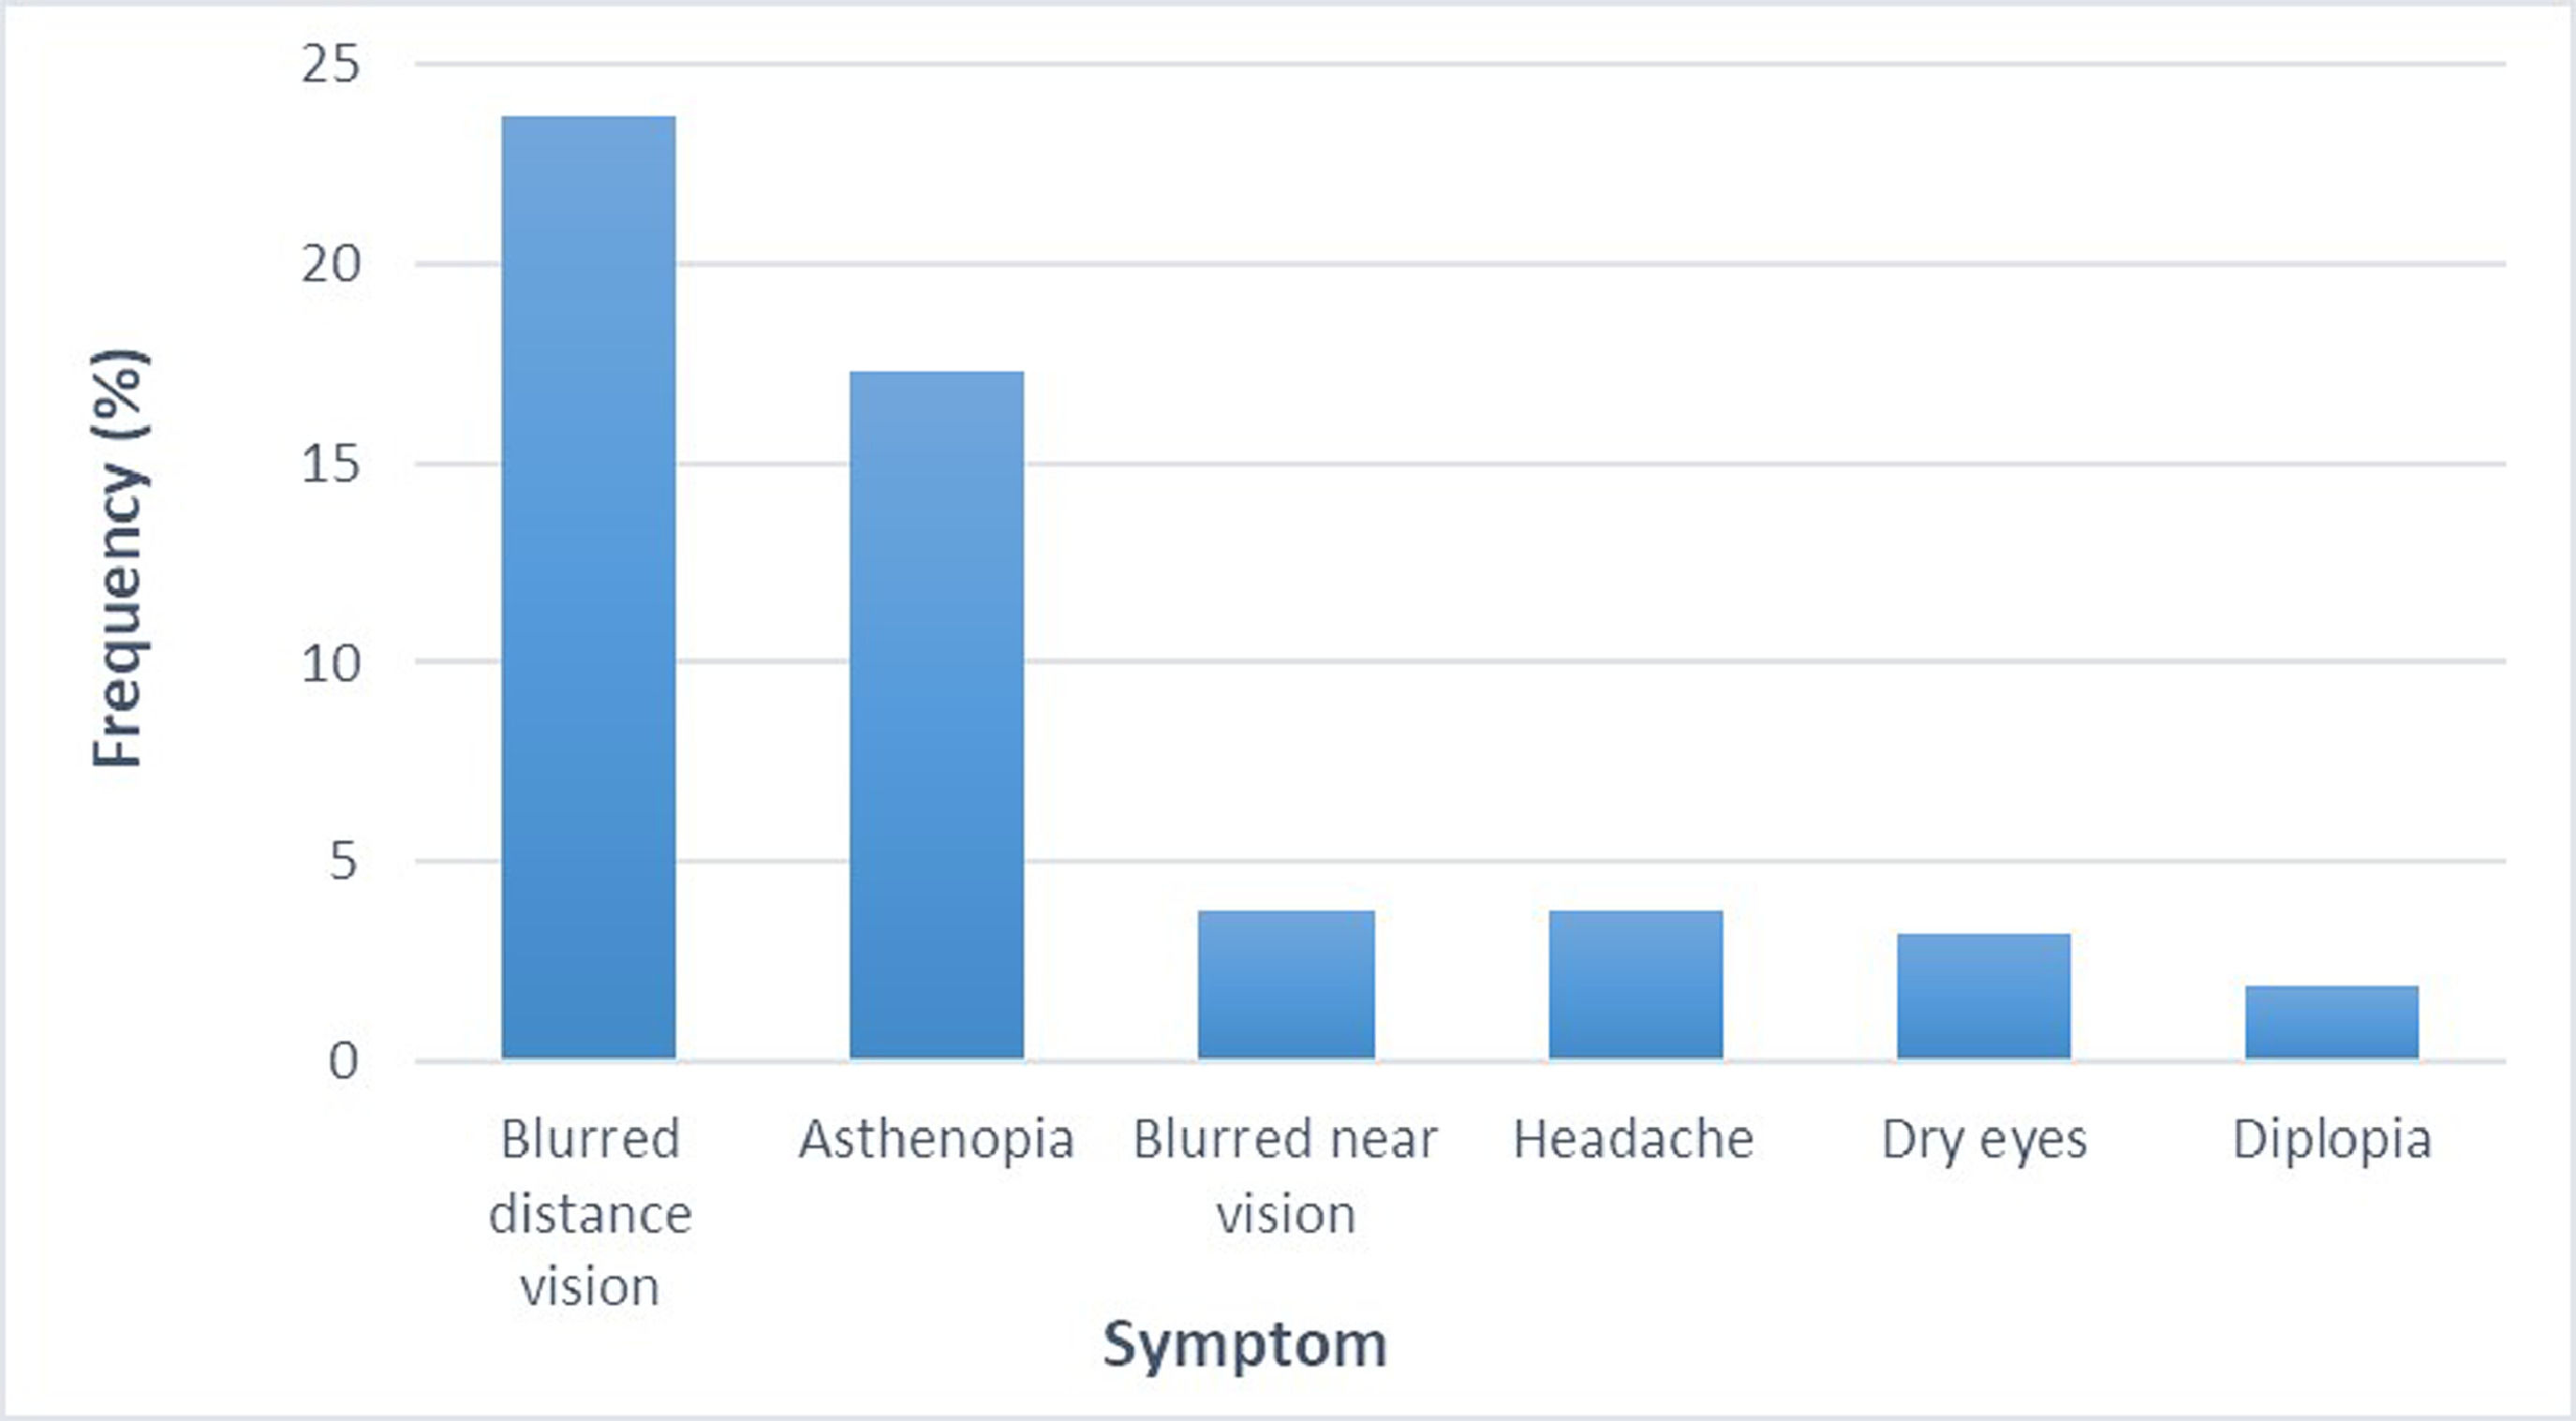
The mean (± SD) spherical equivalent was -0.80 ± 1.60 D, being myopia (49 %) the most prevalent refractive error; followed by emetropia (33.3 %) and hyperopia (17.6 %). Thirty-nine percent of the subjects presented at least one of the symptoms being distance blurred vison (23.7 %) the most prevalent, followed by asthenopia (17.3 %) (Figure 1).
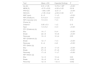
In Table 3, it can be found all the binocular and accommodation clinical findings as well as their expected values according to Morgan.12,13 It can be seen that several clinical findings are significantly different from the expected values. The amplitude of accommodation, PRA and MAF are lower from the expectable findings, particularly for the AA and MAF values where there is a difference of 1,85 D and 3 cpm, respectively. The phoria for near vision was lower than expected. Conversely, most of the fusional vergence parameters were higher than the expected values.
| Test | Mean ± SD | Expected findings | P |
|---|---|---|---|
| AA (D) | 8.91 ± 1.95 | 10.76 ± 1.58a | < 0.001 |
| MEM (D) | +0.70 ± 0.22 | +0.50 ± 0.25 | 0.016 |
| PRA (D) | -1.99 ± 0.94 | -2.37 ± 1 | < 0.001 |
| NRA (D) | +1.95 ± 0.42 | +2.00 ± 0.50 | 0.17 |
| MAF (cpm) | 8 ± 5 | 11 ± 5 | < 0.001 |
| NPC break(cm) | 5.9 ± 2.9 | 5 ± 2.5 | 0.007 |
| NPC recovery (cm) | 7.6 ± 3.5 | 7 ± 3 | 0.13 |
| Phoria (Δ) | |||
| Distance | 0.85 ± 3.3 | 1 ± 2 | 0.15 |
| Near | 1.8 ± 5.2 | 3 ± 3 | < 0.001 |
| PFV (Distance) (Δ) | |||
| Blur | 14 ± 7 | 9 ± 4 | < 0.001 |
| Break | 22 ± 8 | 19 ± 8 | < 0.001 |
| Recovery | 10 ± 5 | 10 ± 4 | 0.35 |
| NFV (Distance) (Δ) | |||
| Break | 12 ± 7 | 7 ± 3 | < 0.001 |
| Recovery | 6 ± 4 | 4 ±2 | < 0.001 |
| PFV (Near) (Δ) | |||
| Blur | 20 ± 8 | 17 ± 5 | < 0.001 |
| Break | 27 ± 9 | 21 ± 6 | < 0.001 |
| Recovery | 17 ± 8 | 11 ± 7 | < 0.001 |
| NFV (Near) (Δ) | |||
| Blur | 14 ± 5 | 13 ± 4 | 0.03 |
| Break | 19 ± 6 | 21 ± 4 | 0.002 |
| Recovery | 12 ± 5 | 1 3 ± 5 | 0.002 |
Computed from age according to Hofstetter formula AA=18.5–0.3 × age.
AA: Monocular Amplitude of Accommodation; MAF: Monocular Accommodative Facility; MEM: Monocular Estimate Method retinoscopy; PRA: Positive Relative Accommodation; NRA: Negative Relative Accommodation; NPC: Near Point of Convergence; NFV: Negative Fusional Vergence; PFV: Positive Fusional Vergence.
For all the findings, only PRA (p = 0.035) and MAF (p = 0.032) were statistically significant different between those subjects who were asymptomatic (mean PRA = -2.00 D (SD = 0.93 D) and mean MAF = 8.3 cpm (SD = 4.7 cpm)) and those symptomatic (Mean PRA = -1.80 D (SD = 0.95 D) and mean MAF = 6.5 cpm (SD = 4.7 cpm)). For all the other clinical findings, the differences were not statistically significant (p > 0.05) between symptomatic and non-symptomatic subjects.
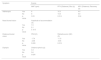
Subjects who complain of asthenopia presented lower values of MAF (p = 0.03), blur value of the distance PFV (p = 0.014) and recovery value of the distance NFV (p = 0.04) (Table 4). The amplitude of accommodation was lower for those subjects with complaints of near blurred vision (p = 0.013) and subjects that complains from distance blurred vision presented a lower PRA (p = 0.009) and a more myopic refractive error (p = 0.019). Diplopia was related with the distance phoria (p = 0.024).
Differences in the test results between symptomatic and asymptomatic subjects.
MAF: Monocular accommodative facility; cpm: cycles per minute; PFV: positive fusional vergence; NFV: negative fusional vergence; PRA: positive relative accommodation; SE: spheric equivalent.
Of the 156 subjects examined (Table 5), 32.0 % presented a binocular vision or accommodative disorders accompanied or not by refractive errors. Of all the subjects, 21.1 % had accommodative disorders and 10.9 % had a binocular vision dysfunction (Table 5). Accommodative insufficiency (11.5 %) was the most prevalent disorder followed by convergence insufficiency (7.1 %) and accommodative infacility (5.8 %). The normal group represents the subjects who presented just a refractive error or no visual/ocular problems.
DiscussionSeveral studies have suggested that accommodative and non-strabismic binocular dysfunctions are commonly encountered in optometric practice.5–11 As the prevalence of these dysfunctions among the Portuguese population was not well known, our study evaluated its prevalence in a clinical population of the north of Portugal and one-third of the participants have accommodative or binocular dysfunctions stressing the importance of discarding these dysfunctions during an optometric examination.
In our study, accommodative dysfunctions were presented in 21.1 % of the subjects evaluated being the accommodative insufficiency the more prevalent accommodative disorder (11,5 %).
The literature revised show a significant discrepancy regarding the prevalence of accommodative dysfunctions. In the study carried out by García-Muñoz et al.,11 the prevalence of accommodative dysfunctions found was 2.29 %, which is considerably lower than that obtained in our study. In turn, Lara et al.5 evaluated 265 symptomatic patients from a clinical population, aged between 10 years and 35 years, and they found a prevalence of 9.4 % for accommodative anomalies. Although this value is higher than that obtained by García-Muñoz et al.11 still is considerably lower than that obtained by us. Hokoda9 found a prevalence of 9.2 % for accommodation insufficiency, 5.1 % for accommodative infacility and 2.5 % for accommodation excess, which are also lower than the findings of our study. However, the diagnostic criteria used by Hokoda were different from ours.
The prevalence of accommodative disorders found in our study is higher than the prevalence presented by other authors 5–11 except for those findings reported by Montes-Micó14 in a clinical population of Valencia, Spain. The author found that 34.6 % of subjects presented an accommodative disorder being the accommodative insufficiency the most prevalent (11.4 %), followed by accommodative infacility (10.3 %).
Like other studies, we obtained a higher prevalence of accommodative dysfunctions than binocular vision disorders.9,11 However, other authors reported a higher prevalence of binocular vision disorders.5–8,11 For instance, Lara and colleagues5 found a higher prevalence of binocular vision disorder (12.9 %) compared to accommodative disorders (9.4 %). These authors also reported a higher prevalence of accommodative excess (6 % ) than accommodation insufficiency (3.0 %). These findings are also closer to those reported by Porcar and Martinez-Palomera.8 They studied the prevalence of general binocular dysfunction in a university students’ population. García-Muñoz et al.11 research also pointed out that binocular dysfunctions were more prevalent than accommodative disorders in a university student's population.
The described differences could be related to the type of population studied, i.e., clinical or non-clinical, the methods used to evaluate both accommodation and binocular vision, and the diagnosis criteria. For binocular vision, the fundamental signs (Table 2) compare near and far phorias and the amplitude of phorias. According to the norms, the mean far and near phorias obtained are closer to each other than expected and with diminished amplitude. On the other hand, the normative values in the set of complementary signals (Table 2) are smaller than the mean values obtained. Both situations might have resulted in a relatively reduced number of positives for binocular dysfunctions.
The amplitude of accommodation is an important parameter for the diagnostic of accommodative dysfunctions, and this is of great relevance since the method used for its determination can influence the final results. In our study, the accommodation amplitude was measured by the Sheard method. It was obtained a mean value of 8.90 D, which was lower than the minimum expected for age (10.7 D). This difference was statistically significant (P≤0.001).
According to Burns et al.,15 there is no agreement in the literature about the best method to access accommodation amplitude. Moreover, five different methods may be used: push- up, push-down, push-down to recognition, negative lenses (Sheard's method) and dynamic retinoscopy.15 Rosenfield and colleagues16 reported that the push-up, push-down and negative lens methods had good repeatability. They also reported that push-up values tend to be abnormal higher than those obtained with the push-down and negative lens methods. These differences are related to the increase of the accommodative response induced by the approximation of the target17 to the subject and the increase of the letter's angular size produced. These two factors delay the moment the patient reports blur vision.
On the other hand, Taub et al.18 reported that the negative lens method produces lower accommodation amplitude results. The push-up method produces the most consistent results in adults when faced with the normative values obtained with the application of the Hofstetter formula.18
Regarding non-strabismic binocular vision, 10.9 % of the subjects were diagnosed with a binocular vision dysfunction. This prevalence is close to those obtained by Lara et al.5 (12,9 %), Hoseini-Yazdi et al.6 (12.1 %), and Ovenseri-Ogbomo and Eguegu (12.7 %).10 The first two studies from a clinical population and the last from university students. García-Muñoz et al.11 found a smaller prevalence (8.0 %). Richman and Laudon7 (27 %) and Porcar et al.8 (15.3 %) found higher prevalence. These last three studies derived from university students’ population. Hussainde et al.19 (19.7 %) and Montés-Micó14 (21.7 %) also found higher prevalence the first from an urban pediatric population and the second also from a clinic population.
In our study, convergence insufficiency was the more prevalent binocular disorder (6.9 %) followed by convergence excess (3.8 %). Similarly to Hussainde et al.18 (convergence insufficiency: 16.5 %; convergence excess: 1.4 %) using the Modified Thorington to assess the horizontal phoria and García-Muñoz et al.11 (convergence insufficiency: 3.4 %; convergence excess: 2.3 %) using the cover test to assess the horizontal phoria. In Porcar and Martinez-Palomera8 study they used the von Grafe technique for measure the horizontal phoria and they reported convergence insufficiency as the most prevalent binocular condition (7,7 %). However, this figure was aggregated to accommodative excess. Also, Montés-Micó14 found convergence insufficiency as the most prevalent (5.9 %) but in this study convergence excess was the less prevalent (1.5 %). Although they also used the von Grafe method to evaluate the horizontal phoria, the diagnostic criteria were different from our study.
Once more, differences could be explained by the type of population studied, i.e., clinical or non-clinical, the methods used to evaluate the binocular vision parameters, and the diagnosis criteria. Patients who visit an optometry clinic are more likely to have complaints of a visual anomaly than if they would have been selected at random from the general population. Thus, this less representativeness of the general population and greater probability of bias towards higher prevalence figures can explain differences between our results and those from Garcia-Muñoz et al.11
There are different methods to measure the horizontal phoria. According to Cantó-Cerdán et al.20, von Graefe method produce more exophoric mean values than the cover test. Maples et al.21 concluded that a higher percentage of patients would be classified with binocular vision anomalies if a clinician measure phorias using the von Graefe technique than would be classified using the modified Thorington technique. According to the authors, the Von Graefe method will provide the diagnoses of convergence insufficiency and of convergence excess more often than the modified Thorington method.21 This can be a motif to explain the higher prevalence of non-strabismic binocular vision disorders, namely convergence insufficiency and convergence excess, found in the present study.
Blurred vision, headaches and asthenopia were the most prevalent reported symptoms in our study. This is in accordance with the findings reported by other authors.19,22 The symptom of headache was more prevalent among those subjects who were diagnosed with an accommodative disorder while asthenopia was common to both accommodative and binocular vision disorders. As expected, blurred vision was more prevalent among subjects with a refractive error, followed by those diagnosed with accommodative and binocular vision disorders. The complaint of blurred vision at near was significantly more prevalent among those with an accommodative disorder.
There are a number of limitations of our study. Although it is one of the few studies characterizing the binocular and accommodative status in terms of prevalence and symptomatology associated with the Portuguese population, the results cannot be straight generalized to all population considering they came from clinical settings. In addition to these circumstances, the visual tests used to access vision respected the exam routine of clinicians collaborating with the study. In some cases, this resulted in preventing the selection of tests with better features for research purposes. For example, measuring phorias with an objective test like the Cover Test would be better than a subjective test like von Graefe. In addition, the first has better repeatability.
ConclusionsClinicians should be aware that accommodative and non-strabismic binocular disorders are common among non-presbyope adult patients attending a general optometric office. Accommodative insufficiency was the most prevalent dysfunction, followed by convergence insufficiency and accommodative infacility. The amplitude of accommodation, PRA and MAF were lower than the reference values while the results for the binocular vision exams were similar.
Author ContributionsConceptualization, Supervision SF.; Investigation, AM., AF.; Formal Analysis and methodology, SF; AB.; Data Curation, SF; AB.; Writing—Original Draft Preparation, SF.; Writing—Review and Editing, SF, AB.
This work was supported by the Portuguese Foundation for Science and Technology (FCT) in the framework of the Strategic Funding UID/FIS/04650/2019.


