

To determine the prevalence of visual impairment attributable to refractive error and other causes in a youthful Ghanaian population.
MethodsA prospective survey of all consecutive visits by first-year tertiary students to the Optometry clinic between August, 2013 and April, 2014. Of the 4378 first-year students aged 16–39 years enumerated, 3437 (78.5%) underwent the eye examination. The examination protocol included presenting visual acuity (PVA), ocular motility, and slit-lamp examination of the external eye, anterior segment and media, and non-dilated fundus examination. Pinhole acuity and fundus examination were performed when the PVA≤6/12 in one or both eyes to determine the principal cause of the vision loss.
ResultsThe mean age of participants was 21.86 years (95% CI: 21.72–21.99). The prevalence of bilateral visual impairment (BVI; PVA in the better eye ≤6/12) and unilateral visual impairment UVI; PVA in the worse eye ≤6/12) were 3.08% (95% CI: 2.56–3.72) and 0.79% (95% CI: 0.54–1.14), respectively. Among 106 participants with BVI, refractive error (96.2%) and corneal opacity (3.8%) were the causes. Of the 27 participants with UVI, refractive error (44.4%), maculopathy (18.5%) and retinal disease (14.8%) were the major causes. There was unequal distribution of BVI in the different age groups, with those above 20 years having a lesser burden.
ConclusionEye screening and provision of affordable spectacle correction to the youth could be timely to eliminate visual impairment.
Determinar la prevalencia de la deficiencia visual atribuible al error refractivo y a otras causas en una población de jóvenes de Ghana.
MétodosEstudio prospectivo de todas las visitas consecutivas realizadas por estudiantes terciarios de primer año que acudieron a la Clínica de Optometría entre Agosto de 2013 y Abril de 2014. De los 4.378 estudiantes de primer año registrados, de edades comprendidas entre 16 y 39 años, 3.437 (78,5%) se sometieron a un examen ocular. El protocolo del examen incluyó la revisión de la agudeza visual (AV), la motilidad ocular y la biomicroscopía del ojo externo, segmento anterior y medio, y el examen del fondo de ojo sin dilatación. Los exámenes de la agudeza con agujero estenopeico y del fondo de ojo se realizaron en aquellos casos de AV ≤ 6/12 en uno o ambos ojos para determinar la causa principal de la pérdida de visión.
ResultadosLa edad media de los participantes fue de 21,86 años (95% IC: de 21,72 a 21,99). La prevalencia de la deficiencia visual bilateral (BVI; AV en el mejor ojo ≤ 6/12) y la deficiencia visual unilateral (UVI; AV en el peor ojo ≤ 6/12) fue del 3,08% (95% IC: de 2,56 a 3,72) y el 0,79% (95% IC: de 0,54 a 1,14), respectivamente. En 106 participantes con BVI, las causas principales fueron el error refractivo (96,2%) y la opacidad corneal (3,8%). De los 27 participantes con UVI, el error refractivo (44,4%), la maculopatía (18,5%) y la enfermedad retiniana (14.8%) fueron los principales motivos. Se produjo una distribución desigual de la BVI en los diferentes grupos de edad, habiendo un menor impacto en aquellos participantes con edades superiores a 20 años.
ConclusiónLa exploración ocular y la adaptación de una corrección en gafa asequible en los jóvenes podría eliminar a tiempo la deficiencia visual.
Visual impairment is recognized as a public health problem worldwide and has devastating effect on the quality of life of individuals.1 According to World Health Organization, 285 million people are visually impaired, with 90% of this population living in developing countries.2 Visual impairment caused by refractive error, cataract and glaucoma is increasingly being recognized worldwide as a significant cause of avoidable visual disability, as evidenced by their inclusion in the priority areas of the global initiative – “VISION 2020: The Right to Sight” to eliminate avoidable blindness.
It has been reported that majority of persons with visual impairment could be encouraged to be self-dependent and to perform the activities of daily living simply by the provision of the requisite spectacles or other optical aids.3 But as was reckoned by the WHO, a major limitation in the elimination of avoidable visual impairment is the insufficient data on the prevalence and avoidable causes of visual impairment in different populations and age groups.4
Data on the prevalence of visual impairment in Ghana is lacking since a national survey of blindness and visual impairment is yet to be conducted. Any available estimate on the burden of visual impairment in the country is extrapolated from the findings by surveys conducted on sub-populations including children and the aged, therefore having little or no applicability on the youthful population. Such an information is crucial for resource allocation, planning, and the development of health and educational policy interventions to ameliorate the burden of visual impairment in the youth. According to the 2010 population census, the youth constitute about 41% of the total Ghanaian population estimated at 24 million.5 The male-to-female distribution in the youthful strata is almost equal with a greater proportion of this population (56.1%) living in the urban areas.
The tertiary institutions offer a suitable setting for the study of visual impairment among the youth in Ghana. This is because the tertiary student population shares similar demographic and socioeconomic characteristics as the general Ghanaian youth. Evidence of the youthful nature of the tertiary student population is obvious from the age range for entry of the majority into the tertiary institutions which is between 18 and 21 years to pursue programs having a 3 or 4-year duration. In addition, the socioeconomic variations in the tertiary students in the country depict the diversity existing in the Ghanaian population. This is partly due to the implementation of the less endowed admission (LEA) policy by the public universities,6 which ensures that the less privileged students, usually from the rural areas of the country, are given a quota for admission. Also, the implementation of the inclusive educational policy by the tertiary institutions has allowed for proper integration of the visually impaired into mainstream education.7 In effect, the outcome following an assessment of visual status of the tertiary students could provide reliable information on visual impairment in the youth. For this reason, this study was conducted to determine the prevalence of visual impairment attributable to refractive error and other causes in students attending the University of Cape Coast,8 one of the top three public tertiary institutions in Ghana with the largest student population.
Materials and methodsEthical considerationsApproval to conduct the study was obtained from the Institutional Review Committee of the University of Cape Coast. Informed consent was provided by the subject, but in situations where the subject was less than 18 years consent was obtained from the parent or guardian, in accordance with the tenets of the Declaration of Helsinki regarding the use of human subjects for research. Standard protocols in conformity with all national, federal, or state laws were followed to ensure the safety of all participants.
Study settingThe eye screening was conducted at the two Optometry clinics located in the Southern campus (old site) and the Northern campus (new site) of the University of Cape Coast from August, 2013 to April, 2014. The Optometry clinic established in 2003 serves as a training facility for optometry students, and has among other responsibilities, the provision of eye screening as a component of the medical examination for all the first year students admitted into the University. The clinic is manned by eye practitioners including an ophthalmologist, eight optometrists, an ophthalmic nurse and an optician.
Enumeration and sampling procedureMedical examination including an eye screening is conducted for all individuals given admission into the University. Of the 4378 first-year students eligible for the eye examination, 3437 (78.5%) participated. For any student to be examined, he or she had to present an admission letter and a medical screening form.
Graders training and inter-rater reliabilityThe entire team involved in the survey included an ophthalmologist, eight optometrists, an ophthalmic nurse and doctor of optometry students in the fifth and sixth year. A pilot study was initially conducted on 200 subjects which led to the modification and standardization of the examination protocol. The accuracy of the measurement of visual acuities and the diagnoses of causes of visual impairment by the examiners were compared to that of the ophthalmologist. A high inter-observer agreement (Kappa≥0.73) was noted.
Examination procedureA standardized protocol for eye examination was used in this survey and all examinations were conducted in the Optometry clinic. Records on demographic data (including age, sex, and study program) as well as specific history of visual impairment were documented. Each participant underwent visual acuity testing, ocular motility, and slit-lamp examination of the external eye, anterior segment, and media, and non-dilated fundus examination. The presenting distance visual acuity (PVA) was measured for each participant (i.e. with participants wearing their habitual spectacle prescription if any) by trained doctors of optometry students using the LogMAR E-chart at a distance of 4, 2 and 1m in standard room illumination. This was followed by multiple pinhole visual acuity for persons with PVA worse than 6/12 in either eye. If the visual acuity improved beyond 6/12, then refractive error was assigned as the cause of the visual impairment. If visual acuity is equal or worse than 6/12 in either eye, an ocular health assessment was performed by an ophthalmologist or optometrist using a slit-lamp and a direct ophthalmoscope to ascertain the cause of reduced vision.
The following protocol, as outlined by the WHO,9 was used in diagnosing the cause of visual impairment in the eye: corneal opacity was considered as the cause of vision loss in an eye if there was an easily visible opacity overlying the pupil to the extent that at least part of the pupil margin is blurred. Retinal disease or maculopathy was assigned the cause of vision loss in an eye found with chorioretinitis, optic disk atrophy, macular hole, and central serous chorioretinopthy. Old uveitis was diagnosed as cause of vision loss in cases of severe long-standing anterior uveitis, and which is thought to have led to secondary cataract or glaucoma. Phthisis bulbi was designated as cause of visual impairment when there was an obvious staphyloma, disorganized bulb or enucleated eye.
Assignment of cause of visual impairmentFor a participant with presenting visual acuity of 6/12 in either eye, a cause for the visual impairment was assigned in accordance with the WHO convention,9 which stipulates that the cause be attributed to the primary disorder in the eye. In addition, it states that in situations when two or more causes were found in the eye, then the cause that was most easily treated was to be assigned as the principal cause. Supposing there was any participant with bilateral visual impairment (BVI) with the cause of vision loss different for each eye, then the cause that was easily treatable, but if not treatable, then the easily preventable was assigned as the cause of BVI. For example, if the main cause for right eye was cataract and the cause in the left eye was optic atrophy, cataract was chosen as the cause for the BVI.
Study definitionsThis study adopted the WHO categorization for visual impairment.10 This included blindness (PVA<3/60 in the better eye), severe visual impairment (PVA<6/60–3/60 in the better eye), moderate visual impairment: (PVA<6/18–6/60 in the better eye) and mild visual impairment (PVA<6/12–6/18 in the better eye).
Data analysisStatistical analysis was performed using the Statistical Package for Social Sciences (SPSS) software version 16 (SPSS, Inc., Chicago, IL, USA). Frequency tables were used to estimate the prevalence and distribution of visual impairment by age and gender. Prevalence estimates of visual impairment were expressed as percentages with 95% confidence interval. Multiple logistic regression was used to determine the association between visual impairment and participant demographics including age and sex. Fisher's exact chi-square (χ2) was used in analyzing for association between any specific cause of visual impairment and the demographic data. A critical p≤0.05 was chosen to denote statistical significance.
ResultsDemographics of studentsA total of 3437 students aged between 16 and 39 years underwent the eye examination, comprising 2120 (61.7%) males and 1317 (38.3%) females. The mean age of the student population was 21.86 years (95% CI: 21.72–21.99).
Prevalence of visual impairmentOne hundred and six of the participants were found with varying degrees of bilateral visual impairment (BVI). Thus the prevalence was 3.08% (95% CI: 2.56–3.72). Only 0.1% (4/3437) were blind and the majority (1.8%, 63/3437) had moderate visual impairment (Fig. 1). Also, of the 27 (0.79%; 95% CI: 0.54–1.14) participants found with unilateral visual impairment (UVI), 0.41% (14/3437) had unilateral moderate visual impairment and 0.32% (11/3437) had unilateral blindness (Fig. 2).
Distribution of visual impairment by age and sex

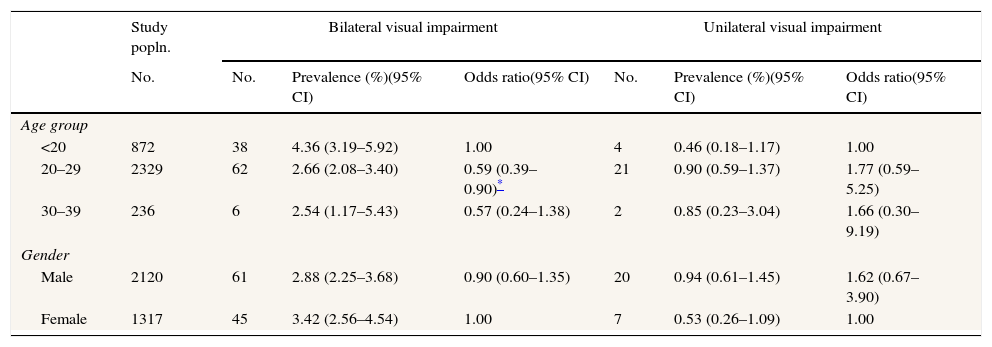
BVI was much prevalent in the participants aged below 20 years (4.36%; 95% CI: 3.19–5.92) and in the females (3.42%; 95% CI: 2.56–4.54). Results from multiple regression analyses showed that age was significantly associated to BVI, with participants in the 20–29 age group being less likely to have BVI (OR: 0.59; 95% CI: 0.39–0.90) compared to the other age groups. The prevalence estimates for UVI were higher among participants in the 20–29 age group (0.90%; 95% CI: 0.59–1.37) and males (0.94%; 95% CI: 0.61–1.45) but no significant association was found between UVI and either age or sex (Table 1).
Prevalence of bilateral and unilateral visual impairment by age and sex.
| Study popln. | Bilateral visual impairment | Unilateral visual impairment | |||||
|---|---|---|---|---|---|---|---|
| No. | No. | Prevalence (%)(95% CI) | Odds ratio(95% CI) | No. | Prevalence (%)(95% CI) | Odds ratio(95% CI) | |
| Age group | |||||||
| <20 | 872 | 38 | 4.36 (3.19–5.92) | 1.00 | 4 | 0.46 (0.18–1.17) | 1.00 |
| 20–29 | 2329 | 62 | 2.66 (2.08–3.40) | 0.59 (0.39–0.90)* | 21 | 0.90 (0.59–1.37) | 1.77 (0.59–5.25) |
| 30–39 | 236 | 6 | 2.54 (1.17–5.43) | 0.57 (0.24–1.38) | 2 | 0.85 (0.23–3.04) | 1.66 (0.30–9.19) |
| Gender | |||||||
| Male | 2120 | 61 | 2.88 (2.25–3.68) | 0.90 (0.60–1.35) | 20 | 0.94 (0.61–1.45) | 1.62 (0.67–3.90) |
| Female | 1317 | 45 | 3.42 (2.56–4.54) | 1.00 | 7 | 0.53 (0.26–1.09) | 1.00 |
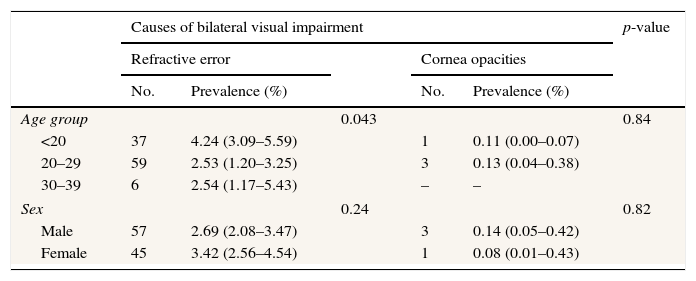
Refractive error (102, 96.2%) and corneal opacity (4, 3.8%) were the only causes of bilateral visual impairment, but corneal opacity was solely responsible for blindness (Table 2). Age was significantly associated to refractive error (p=0.043), with participants aged below 20 years having the greatest prevalence (4.24; 95% CI: 3.09–5.59). No significant association was found between the cause of bilateral visual impairment and sex (p=0.24) using the Fishers exact χ2 (Table 2), even though females showed a higher prevalence (3.42; 95% CI: 2.56–4.54) of refractive error than males.
Distribution of causes of bilateral visual impairment by age and sex.
| Causes of bilateral visual impairment | p-value | |||||
|---|---|---|---|---|---|---|
| Refractive error | Cornea opacities | |||||
| No. | Prevalence (%) | No. | Prevalence (%) | |||
| Age group | 0.043 | 0.84 | ||||
| <20 | 37 | 4.24 (3.09–5.59) | 1 | 0.11 (0.00–0.07) | ||
| 20–29 | 59 | 2.53 (1.20–3.25) | 3 | 0.13 (0.04–0.38) | ||
| 30–39 | 6 | 2.54 (1.17–5.43) | – | – | ||
| Sex | 0.24 | 0.82 | ||||
| Male | 57 | 2.69 (2.08–3.47) | 3 | 0.14 (0.05–0.42) | ||
| Female | 45 | 3.42 (2.56–4.54) | 1 | 0.08 (0.01–0.43) | ||
p-value: level of significance reported from Fishers χ2 analysis.
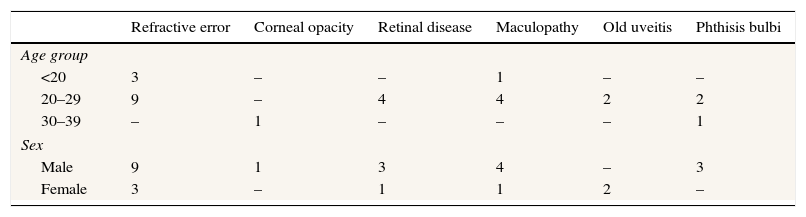
Of the 27 participants with UVI, refractive error (12, 44.4%), maculopathy (5, 18.5%) and retinal disease (4, 14.8%) were the most common causes (Table 3). Although these causes of UVI were mostly found in the 20–29 age group and males, both age and sex were not significantly associated (p>0.05) to the causes of UVI (Table 3).
DiscussionPrevious studies in selected communities in Ghana11–13 have investigated visual impairment attributable to all causes in the aged population with inconsistent findings. We prospectively studied all consecutive visits by first-year students of the University of Cape Coast aged 16–39 years who presented for a mandatory eye screening exercise at the Optometry clinic over a nine-month period. The major strength of our study is that we reported presenting VA and not best-corrected VA, which is consistent with the WHO recommendation for reporting visual impairment in surveys.10 The study also adopted the WHO definitions for visual impairment with the inclusion of mild visual impairment as recommended by Dandona et al.14 This modification was considered relevant due to the visual demands by the Ghanaian youth and for the purpose of comparison to the previous studies in Ghana.
The estimated prevalence of bilateral visual impairment (PVA<6/12) of 3.1% in our study population is relatively lower than that found in the Volta Region12 (17.8%) and the Tema community (13.5%) surveys,12 whose participants were adults aged 40 years and older, but consistent with the estimate (3.7%) in the Wenchi district of Ghana by Moll et al.11 survey for adults aged 30 years and above. Although all the surveys were population-based, the demographic and socioeconomic characteristics of our study population were likely to be different since the University is a cosmopolitan institution. In addition, our subjects were much younger with 93.1% below 30 years as compared to the subjects in the other studies who were older. However, the estimate for low vision and blindness found in our study is consistent with the WHO estimation for low vision and blindness for the age group 15–49 years, which were 2.1% and 0.2% respectively.15
Refractive error, an avoidable cause of vision loss, was the major cause of BVI (96.2%) and UVI (44.4%) in the study population. Our finding is consistent with other surveys conducted in some developing countries such as Nepal16 and Vietnam17 that reported refractive error as the main cause of visual impairment in over 90% of their study participants. While the study participants used in these two surveys were children between the ages of 10–15 years, their findings could be compared to ours since it has been established that refractive status generally does not undergo significant changes that require further correction from age 16 to 39 years.18 Apart from the Tema survey reporting refractive error to be a major cause (60%) of visual impairment in their sample, the remaining two earlier surveys in Ghana did not consider refractive error as a cause of visual impairment due to the reporting of best corrected visual acuity instead of presenting visual acuity, which is currently recommended by WHO. This study provides information of public health significance regarding the unmet need for refractive correction, thus suggesting that the Vision 2020 project should focus on the provision of spectacle wear.
Also of interest in this youthful population was the burden of posterior segment disease that had caused UVI in nine participants, out of which four were attributable to toxoplasmic chorioretinitis. Epidemiological survey on a subpopulation indicates that Ghana is among the countries with a high seroprevalence rate of Toxoplasma gondii,19 signifying a high risk to this infectious agent. The outcome of our study corroborates findings that visual impairment caused by retinal disorders in the young Ghanaian population is of public health concern.20 Similarly, other researchers in other countries have found retinal disorders to be among common causes of vision loss even among children.16,21
Even though cataract is a major cause of blindness in developing countries,15 we found corneal opacities to be the main cause of blindness in our study population. Vitamin A deficiency and measles are common causes of bilateral corneal opacity.22,23 Our observation of only a few subjects with corneal blindness could suggest that the strategy on the distribution of vitamin A capsules and the immunization program instituted against the six childhood diseases in Ghana has been quite successful. The total absence of cataract in our study population could be an indication that the burden of cataract is greater in the aged instead of the young adult population. Similarly, Sapkota et al.16 observed that only one child out of the total 4282 children aged 10–15 years in Kathmandu, Nepal, had visual impairment attributable to cataract. However, it should be noted that since cataract is associated with severe visual disability, affected students were likely to have undergone cataract surgery to restore their sight.
The distribution of visual impairment by sex varies in different study populations. We found that the burden of visual impairment was higher in females (3.42%) than males (2.88%) although no significant association was found between sex and visual impairment. This is consistent with the findings by Paudel and his colleagues,17 but contradicts reports by other studies15 emphasizing the vulnerability of females to visual impairment compared to their male counterparts. The reported association between sex and visual impairment by those studies could have been due to barriers to eye care in females as identified by Abou-Gareeb et al.24 which were probably absent in this study population comprising of tertiary students.
We found BVI to be highest in participants below 20 years and least in the 30–39 age group. This contradicts previous studies11–13 that report positive correlation between visual impairment and age. This perhaps was due to the different ocular disorders that underlie visual impairment in the study populations. In those studies, cataract and glaucoma were major causes of visual impairment. On the contrary, we found that refractive error, which was much prevalent in those below 20 years (p=0.043), was the major cause of BVI in our participants. The inequality in the burden of refractive error across different age strata of populations is already documented.25
A major limitation of this study was the protocol of examination which did not include cycloplegic refraction to determine the type of refractive error when the PVA in the eye was 6/12 or worse but rather the pinhole acuity was taken. Thus it was impossible to make a report on the proportions of myopes, hyperopes and astigmatism. However, the use of the pinhole acuity to screen for refractive error is a standard technique,26 and does not compromise on the outcome of the study. In fact, pinhole acuity has been used in several visual impairment surveys, especially in the resource deficient countries.12,27
Estimate of the prevalence of refractive errors in this population was previously reported at 26.4%.28 However, our study found several participants without visual impairment due to refractive error. This could be due to the significant proportion of the participants 61 (1.8%) who were found wearing their spectacle corrective lenses. This alone could have underestimated the prevalence of visual impairment caused by refractive error. The outcome of this study is striking as it shows that refractive error, which is easily correctable with spectacles, remained the major cause of visual impairment, even among tertiary students, who were deemed to be more educated, and had better access to eye care facilities. The findings of the study therefore indicate that the goal of Vision 2020 – the elimination of avoidable blindness – could be achieved if strategies are targeted toward the elimination of refractive errors in the Ghanaian youth.
FundingNo financial support of any kind was received for the study.
Conflict of interestNone of the authors have any proprietary interests or conflicts of interest related to this submission.
We express profound gratitude to the staff of the Department of Optometry for their contribution toward the success of this eye screening program.


