


This descriptive study provides a summary of the binocular anomalies seen in elementary school children identified with reading problems.
MethodsA retrospective chart review of all children identified with reading problems and seen by the University of Waterloo, Optometry Clinic, from September 2012 to June 2013.
ResultsFiles of 121 children (mean age 8.6 years, range 6–14 years) were reviewed. No significant refractive error was found in 81% of children. Five and 8 children were identified as strabismic at distance and near respectively. Phoria test revealed 90% and 65% of patients had normal distance and near phoria. Near point of convergencia (NPC) was <5cm in 68% of children, and 77% had stereoacuity of ≤40seconds of arc. More than 50% of the children had normal fusional vergence ranges except for near positive fusional vergencce (base out) break (46%). Tests for accommodation showed 91% of children were normal for binocular facility, and approximately 70% of children had an expected accuracy of accommodation.
ConclusionFindings indicate that some children with an identified reading problem also present with abnormal binocular test results compared to published normal values. Further investigation should be performed to investigate the relationship between binocular vision function and reading performance.
Este estudio descriptivo aporta un resumen de las anomalías binoculares observadas en niños de primaria en los que se identificaron problemas de lectura.
MétodosRevisión retrospectiva de las historias clínicas de todos los niños en los que se identificaron problemas de lectura, examinados en la Universidad de Waterloo, Clínica de Optometría, desde Septiembre de 2012 a Junio de 2013.
ResultadosSe revisaron las historias de 121 niños (edad media 8,6 años, rango 6-14 años). No se encontró ningún error refractivo significativo en el 81% de los niños. Se identificaron cinco y ocho niños con estrabismo de visión lejana y cercana, respectivamente. La prueba de foria reveló que el 90% y 65% de los pacientes padecían foria en rango de normalidad para lejos y cerca. El punto próximo de convergencia (PPC) fue <5cm en el 68% de los niños, y el 77% reflejó estereoagudeza ≤40 segundos de arco. Más del 50% de los niños tenía rangos de vergencia fusional normal, excepto para el punto de rotura de vergencia fusional positiva de cerca (46%). Las pruebas de acomodación reflejaron que el 91% de los niños tenía una flexibilidad binocular normal, y aproximadamente el 70% de los niños tenía una precisión de acomodación con arreglo a lo previsto.
ConclusiónLos hallazgos indican que algunos niños con dificultades lectoras identificadas presentan también alteraciones en los resultados de las pruebas binoculares, en comparación a los valores normales publicados. Deberá investigarse más con respecto a la relación entre la función de la visión binocular y el rendimiento lector.
Reading is a multifactorial process that is influenced by psychological, physiological, environmental, sociological and linguistic factors.1,2 From an optometrist's perspective, a decrease in reading ability may be associated with poor visual acuity, unstable binocular vision, or ocular disease.3 It is therefore important that people with poor reading comprehension receive a comprehensive oculo-visual assessment.
A thorough case history is one of the critical components of an oculo-visual assessment. More so than with adults, the case history from a younger population may be inconclusive or unreliable. Younger children may be unaware of their visual problems, or are unable to describe their associated symptoms. In these cases, observations from parents and teachers such as eye rubbing, close working distance, or avoidance of near work, provide additional information.
In cases where the patient is wearing their full refractive correction and shows no signs of ocular disease, but describes symptoms of asthenopia, an investigation of the binocular vision system is of particular importance. Literature has shown an association between poor reading performance and binocular vision disorders. These disorders include poor pursuits,4 abnormal convergence,4 low amplitude of accommodation,5 accommodative infacility,5,6 poor fusional vergence reserves, and abnormal fixation disparity.7 In Ontario, Canada, children who read below their expected grade may be eligible for an Individual Education Plan (IEP) provided by their local school board. An IEP is a special education plan designed to modify the curriculum for a particular student in order to assist the student in achieving his or her learning goals.8
The current manuscript investigates the prevalence of visual and binocular vision anomalies in a cohort of school children who have an IEP for reading (ReIEP).
MethodsThe University of Waterloo Optometry Clinic provides full eye examinations to children with an IEP for reduced reading efficiency (defined as a 2 or more grade level reduction from expected grade)9 enrolled in 5 (of 103) elementary schools within Waterloo Region, Ontario, Canada. These children were identified by their classroom teacher based on their performance on the PM Benchmark Reading Assessment (Nelson Education).9 We retrospectively collected refractive and binocular vision data from 121 files of children aged 6–14 years examined between September 2012 and June 2013. Patient consent and study process received ethics clearance from the University of Waterloo, Office of Research Ethics which follows the tenets of the Declaration of Helsinki.
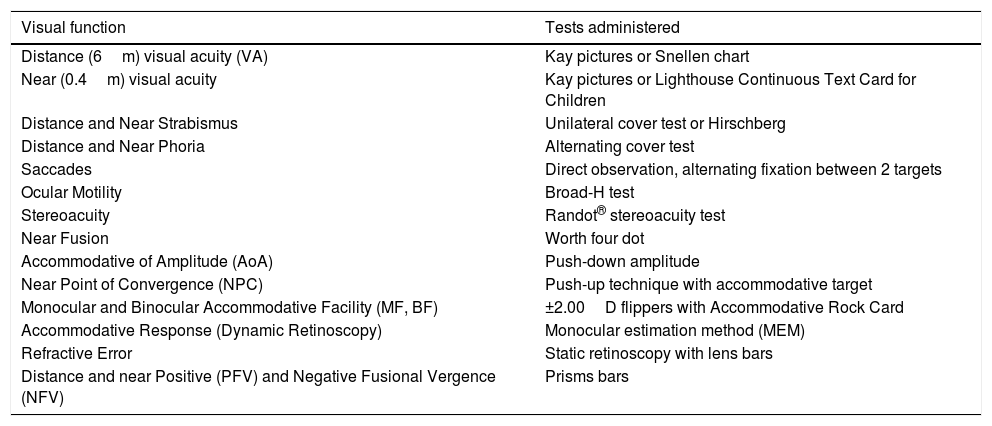
Visual and binocular vision testsAll vision and binocular tests were administered by 3rd year optometry students and verified by the first author, a registered optometrist. Where indicated, alternate test charts and targets were used based on the child's age and level of comprehension, as shown in Table 1.
Visual and binocular vision tests used in assessing students identified with reading difficulties.
| Visual function | Tests administered |
|---|---|
| Distance (6m) visual acuity (VA) | Kay pictures or Snellen chart |
| Near (0.4m) visual acuity | Kay pictures or Lighthouse Continuous Text Card for Children |
| Distance and Near Strabismus | Unilateral cover test or Hirschberg |
| Distance and Near Phoria | Alternating cover test |
| Saccades | Direct observation, alternating fixation between 2 targets |
| Ocular Motility | Broad-H test |
| Stereoacuity | Randot® stereoacuity test |
| Near Fusion | Worth four dot |
| Accommodative of Amplitude (AoA) | Push-down amplitude |
| Near Point of Convergence (NPC) | Push-up technique with accommodative target |
| Monocular and Binocular Accommodative Facility (MF, BF) | ±2.00D flippers with Accommodative Rock Card |
| Accommodative Response (Dynamic Retinoscopy) | Monocular estimation method (MEM) |
| Refractive Error | Static retinoscopy with lens bars |
| Distance and near Positive (PFV) and Negative Fusional Vergence (NFV) | Prisms bars |
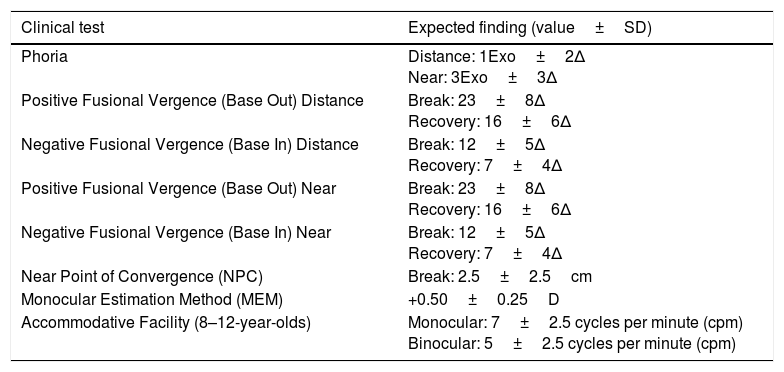
All visual and binocular functions were assessed with the child's habitual correction (if applicable). For visual acuity, varying test charts were used based on the child's ability. Stereoacuity was measured using the Randot® Stereoacuity Test (Stereo Optical Company, Chicago, USA). Accuracy of saccadic function was measured using 2 lettered targets, and the child was asked to alternate fixation between the 2 targets, 5 times. Saccades were classified as either accurate, undershoot, or overshoot. The Broad-H test was used to assess extra ocular motility, and classified as restricted or unrestricted. The unilateral and alternating cover test at distance (6m) and near (0.4m) determined the presence and amount of ocular deviation, and was measured using an accommodative target 2 lines above best visual acuity with the eyes in primary position. If a constant strabismus was noted, no further binocular vision testing was done. For all other patients, near point of convergence (NPC) was measured to determine how easily the (vergence) system could be fatigued. The break was measured three times using an accommodative target, and the mean value was used for analysis. Horizontal fusional reserves were measured in free space using prism bars, while viewing a 6/12 vertical line at 6m and a 0.5M vertical line at 0.4m. Monocular accommodative facility (MF) and binocular facility (BF) were assessed using a 0.6M letter at 0.4m, and ±2.00D lenses for a period of 1min. For BF, a suppression check was used to ensure binocularity. Amplitude of accommodation (AoA) was measured by the push-down method and a 0.6M letter, and accommodative accuracy was assessed by MEM retinoscopy and an age-appropriate target. Following the binocular vision assessment, static retinoscopy was performed on all children using lens bars. In order to report prevalence, mean ocular refractive error (MOR) was defined as follows: myopia ≤−0.50D, hyperopia ≥+1.00D, and astigmatism ≤−0.75D.10,11 Those who fell between these criteria were classified as emmetropes. When static retinoscopy values were >+0.75DS in one or both eyes and/or if accommodative lag was >+1.00D, cycloplegic retinoscopy using 1% cyclopentolate was performed. For those children who required a new or updated spectacle correction, the binocular vision assessment was performed again 4–6 weeks later with the appropriate spectacle prescription, and these results were used for analysis. All oculomotor, binocular vision and accommodative results were calculated using the mean result, and classified according to normative data described by Scheiman and Wick12 (Table 2).
Expected clinical findings of Scheiman and Wick.12
| Clinical test | Expected finding (value±SD) |
|---|---|
| Phoria | Distance: 1Exo±2Δ Near: 3Exo±3Δ |
| Positive Fusional Vergence (Base Out) Distance | Break: 23±8Δ Recovery: 16±6Δ |
| Negative Fusional Vergence (Base In) Distance | Break: 12±5Δ Recovery: 7±4Δ |
| Positive Fusional Vergence (Base Out) Near | Break: 23±8Δ Recovery: 16±6Δ |
| Negative Fusional Vergence (Base In) Near | Break: 12±5Δ Recovery: 7±4Δ |
| Near Point of Convergence (NPC) | Break: 2.5±2.5cm |
| Monocular Estimation Method (MEM) | +0.50±0.25D |
| Accommodative Facility (8–12-year-olds) | Monocular: 7±2.5 cycles per minute (cpm) Binocular: 5±2.5 cycles per minute (cpm) |
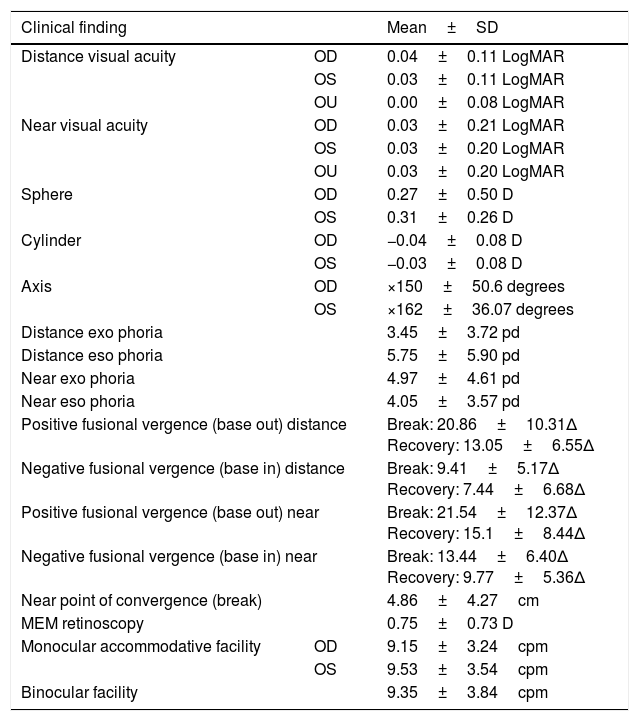
The age range of patients was 6–14 years (mean age: 8.6±2.3 years) and included 121 children (49 females, 72 males). The mean and standard deviation (SD) for all findings are shown in Table 3 and used as a comparison to the normative data in Table 2. However, as analyzed with both the Komogorov–Smirnov and the Shapiro–Wilk tests, the data were not normally distributed (p<0.01) for any tests except for distance positive fusional vergence break and recovery, and near positive and negative fusional vergence recovery.
Mean and standard deviation (SD) for assessment results.
| Clinical finding | Mean±SD | |
|---|---|---|
| Distance visual acuity | OD | 0.04±0.11 LogMAR |
| OS | 0.03±0.11 LogMAR | |
| OU | 0.00±0.08 LogMAR | |
| Near visual acuity | OD | 0.03±0.21 LogMAR |
| OS | 0.03±0.20 LogMAR | |
| OU | 0.03±0.20 LogMAR | |
| Sphere | OD | 0.27±0.50 D |
| OS | 0.31±0.26 D | |
| Cylinder | OD | −0.04±0.08 D |
| OS | −0.03±0.08 D | |
| Axis | OD | ×150±50.6 degrees |
| OS | ×162±36.07 degrees | |
| Distance exo phoria | 3.45±3.72 pd | |
| Distance eso phoria | 5.75±5.90 pd | |
| Near exo phoria | 4.97±4.61 pd | |
| Near eso phoria | 4.05±3.57 pd | |
| Positive fusional vergence (base out) distance | Break: 20.86±10.31Δ Recovery: 13.05±6.55Δ | |
| Negative fusional vergence (base in) distance | Break: 9.41±5.17Δ Recovery: 7.44±6.68Δ | |
| Positive fusional vergence (base out) near | Break: 21.54±12.37Δ Recovery: 15.1±8.44Δ | |
| Negative fusional vergence (base in) near | Break: 13.44±6.40Δ Recovery: 9.77±5.36Δ | |
| Near point of convergence (break) | 4.86±4.27cm | |
| MEM retinoscopy | 0.75±0.73 D | |
| Monocular accommodative facility | OD | 9.15±3.24cpm |
| OS | 9.53±3.54cpm | |
| Binocular facility | 9.35±3.84cpm | |
One hundred and nine (90%) children were able to reliably respond to at least one type of visual acuity chart. In all the children who were assessed, 13% (n=16) had a previous spectacle correction. The mean LogMAR distance VA in the right (OD) and left (OS) eyes were 0.04±0.11 and 0.03±0.11 respectively, and the binocular VA was 0.00±0.08 in this group.
Near LogMAR VA was assessed in 88% of children, and the mean binocular LogMAR VA was 0.03±0.20. A dry static retinoscopy was done on all 121 patients using lens bars, and a cycloplegic retinoscopy was performed on 25, followed by a subjective refraction (when possible). A total of 23 (19%) of children were prescribed a new or updated spectacle correction.
In our cohort, the overall prevalence of myopia was 7%, hyperopia was 12%, and emmetropia was 81%.
Oculomotor, Binocular Vision, and Accommodative AssessmentsAll tests were attempted on the ReIEP group; however, due to inattention or poor comprehension of test instructions, not all tests yielded usable results. This section describes the results of all the oculomotor, binocular vision, and accommodative assessments in the ReIEP group, that could be accurately performed.
Ocular motilityThe results of ocular motility testing were available for 104 children. Results showed one patient had an overacting right superior oblique muscle, and 103 patients had unrestricted motility. The results of saccadic function were available for 64 children of whom 62 had accurate saccades, with one child demonstrating an undershoot, and one with an overshoot of the saccadic endpoint.
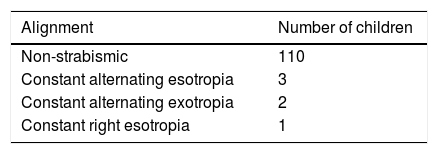
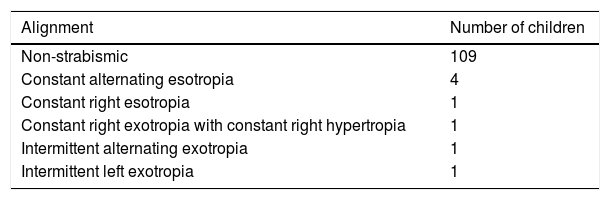
Ocular alignmentOcular alignment showed 96% of children were non-strabismic at distance, and 94% were non-strabismic at near. A summary of all findings is shown in Tables 5a and 5b.
Distance and near phoria testing was performed on 103 and 104 children respectively, and classified according to normative data described by expected clinical findings from Scheiman and Wick12 (Fig. 1).
Fusional vergence testing
Distance and near positive (BO) and negative fusional vergences (BI) were measured in 65 and 66 children respective to direction. The results were compared with the expected findings as described in Table 2.12 The percentage of children who had lower than the expected norms are shown in Fig. 2.
 and negative fusional vergences (NFV BI) in comparison with normative values.")
As seen in Fig. 2, more than half of the children had fusional vergences within norms, except for PFV (BO) break where 46% fell within the expected clinical findings.
Near point of convergenceNPC was assessed in 86 patients. The mean NPC break was calculated to be 4.86±4.27cm, and compared with the expected findings in Table 3. Results showed that 65% of the children were within the expected limits for NPC break.
StereoacuityStereoacuity was measured in 108 patients. Our results found 77% of children had a stereoacuity that was ≤40s of arc.13
Accuracy of accommodationAccuracy of accommodation was assessed in 46 children, and a lag of 0.50±0.25 D was used as a norm for within expected values from Scheiman and Wick.12 Seventy one percent and 73% fell within the expected values for OD and OS respectively.
Accommodative facilityFacility was measured in 57 children. Binocular facility found 91% fell within the expected clinical findings of at least 5cpm. For monocular facility, 77% and 81% of patients fell within the expected finding for OD and OS respectively.
Amplitude of accommodationAoA was measured in 107 children, using the push down method. To provide a direct comparison against Hoffstetter's minimum amplitude equation of 15D – age/4,14 AoA values were converted from push down to push up. Since push down values are lower than push up values,15–18 +1.82D was added to the AoA value obtained for each patient based on the study by Antona et al.18 The AoA values are shown in Fig. 3.
Discussion
This retrospective study looked at the prevalence of visual and binocular vision anomalies in children identified with a reading problem by their educators. The prevalence of refractive error was examined, and 19% of children were identified as either myopic (≤−0.50D) or hyperopic (≥+1.00D) using the criterion by Czepita et al.10 and Kleinstein et al.11 As expected based on the age range of this study (6–14 years), hyperopia was more frequent than myopia, however, frequency values vary depending upon the definition used for myopia and hyperopia. For example, the study by Zadnik et al.19 examining prevalence of refractive errors in children 6–14 years used the criteria ≤−0.75D for myopia and ≥+1.25D for hyperopia. Reanalyzing the study data to compare to Zadnik et al.,19 the overall prevalence of myopia decreased to 6% from 7% and the prevalence of hyperopia decreased to 5% from 12%, therefore bringing the overall emmetropic percentage to 89% from 81% using our original criteria.19 Similar results were also found when findings were compared against the study by Hrynchak et al.20 who examined the same geographical cohort. In this study, Hrynchak et al.20 found the prevalence of myopia to be 30%, hyperopia was 20% and emmetropia was 50% in 725 patients’ age 6–14 years using the same MOR criterion. One reason for the difference in refractive error findings between this study and the 2 studies mentioned, may be due to the difference in the type of population examined. More specifically, the studies by Zadnik19 and Hrynchak20 both examined a normal school population (which included children with above, average, or reduced reading levels) versus our population which involved children with reduced reading levels only. It can be suggested that if this cohort did not read as much as normal children, they may be less myopic because they didn’t spend as much time doing near work and more time on distance related tasks or playing outdoors.
Results for ocular alignment showed 35% of the children had a near phoria that fell outside normative values as defined by Scheiman and Wick (exophoria>esophoria). Fusional vergence results showed less than half (46%) of the children had findings that were within the expected norms for near BO break, and nearly half (41%) had poorer than expected results for distance BO break. These findings are consistent with previous studies by Simons and Grisham,7 Park and Burri,21 and Palomo-Alvarez and Puell,22 all of whom reported evidence of reduced fusional vergences associated with poor reading performance. This suggests that a decrease in a child's fusional vergence could cause difficulty in maintaining binocularity for performing tasks such as reading. In addition to poor fusional vergence, the reduced NPC results in 32.5% of children is also consistent with previous studies showing abnormal results in tests for convergence23,24 in children with reduced reading efficiency.
A cross-sectional study by Kulp and Schmidt25 found accommodative facility and stereoacuity were the best predictors of reading performance in children aged 5–7 years. Other studies have also had similar findings where stereoacuity has been shown to be reduced in children with a reading disability26,27 and accommodative anomalies (specifically accommodative infacility) are often seen in children with learning disorders.28–31 While the results in this study showed approximately 25% of children had stereoacuity below expected age, 10% of the children also did not meet expected normative values for BF well below the published failure rates of 83–87%.32 The most obvious reason is that the cut-off for failure was based on the expected clinical findings published by Scheiman and Wick12 (Table 2), which is below the value used in prior studies. When converting the BF failure rate from 5cpm to the cutoff rate of 15cpm used in other studies29,31 the results change dramatically from 9% to 95% of children failing binocular facility. When analyzing other accommodative data, the average AoA in this group was close to the Donder's age expected values in the 8–10-year-olds but was variable after 10 years. This could be due to the fact that older works by Donders, and the Hoffstetter's formula used the push-up method to calculate AoA.33 Nevertheless, the values obtained for 10–14-year-olds were similar to those reported by Leon et al.33 who cited an average amplitude of 12.5D in comparison to 12.7D in the ReIEP group.
In the current retrospective study, 81% of patients did not require a spectacle prescription. Tests for oculomotor, binocular vision, and accommodation showed a range of patients that did not meet published clinical norms; 19% (OS MF) and 23% (OD MF) to 35% (NPC) of those tested for that function. Further investigation should be done to study the association between reading problems and binocular vision anomalies; however, of the patients that were able to perform the diagnostic test, this study does show a moderate percentage of the patient population with an identified reading problem also have an inadequate binocular vision system.
It is therefore important for the optometrist to provide a binocular vision assessment in all children, especially those who have been identified with reading problems. From the findings in this study, it is recommended that tests for binocular vision and accommodative status such as NPC, accommodative facility, AoA and fusional ranges, be included in a comprehensive eye examination for school age children identified with a reading problem to ensure proper diagnosis and management.
Limitations of the studyThe results in this study are based on 5 schools in Waterloo Region and are not reflective of all children enrolled in the school board with an IEP for reading. For future studies, all children from different schools should be used. Results should be compared to a control group (age-matched children with no previously identified reading problem) with the same tests performed in each group. Ideally, randomized controlled trials should be done to determine if children treated for binocular vision conditions improve significantly in their reading ability, and level of reading should be quantified. In addition, due to age or level of understanding, all binocular tests could not be performed on all children and eye movements were measured by direct observation only. Thus, future studies should also include a larger cohort of children and incorporate additional tests for saccadic eye movements, such as an eye tracker.
ConclusionThe results in this study show that children with an IEP for reading also present with abnormal binocular and/or accommodative test results. To thoroughly investigate the binocular vision system, we recommend that tests of accommodation, binocular vision, and oculomotor function should be performed on all children, especially those with identified reading problems. Future studies will further investigate the relationship between reading performance scores, reading ability and binocular vision function.
Conflicts of interestThe authors have no conflicts of interest to declare.
We thank Linda Lillakas for her assistance with the figures.


