


To introduce a new application (ClinicCSF) to measure Contrast Sensitivity Function (CSF) with tablet devices, and to compare it against the Functional Acuity Contrast Test (FACT).
MethodsA total of 42 subjects were arranged in two groups of 21 individuals. Different versions of the ClinicCSF (.v1 and .v2) were used to measure the CSF of each group with the same iPad and the results were compared with those measured with the FACT. The agreements between ClinicCSF and FACT for spatial frequencies of 3, 6, 12 and 18 cycles per degree (cpd) were represented by Bland–Altman plots.
ResultsStatistically significant differences in CSF of both groups were found due to the change of the ClinicCSF version (p<0.05) while no differences were manifested with the use of the same FACT test. The best agreement with the FACT was found with the ClinicCSF.v2 with no significant differences in all the evaluated spatial frequencies. However, the 95% confidence intervals for mean differences between ClinicCSF and FACT were lower for the version which incorporated a staircase psychophysical method (ClinicCSF.v1), mainly for spatial frequencies of 6, 12 and 18 cpd.
ConclusionsThe new ClinicCSF application for iPad retina showed no significant differences with FACT test when the same contrast sensitivity steps were used. In addition, it is shown that the accurateness of a vision screening could be improved with the use of an appropriate psychophysical method.
Introducir una nueva aplicación (ClinicCSF) para medir la Función de Sensibilidad al Contraste (FSC) con dispositivos de tableta, y compararla con el test Functional Acuity Contrast Test (FACT).
MétodosSe distribuyeron 42 sujetos en dos grupos de 21 personas. Se utilizaron diferentes versiones del ClinicCSF (.v1 y .v2) para medir la FSC de cada grupo con el mismo iPad, comparándose los resultados obtenidos con los medidos con el test FACT. Se representaron las concordancias entre ClinicCSF y FACT para frecuencias espaciales de 3, 6, 12 y 18 ciclos por grado (cpg) mediante gráficos de Bland–Altman.
ResultadosSe hallaron diferencias de FSC estadísticamente significativas en ambos grupos debido al cambio de versión del ClinicCSF (p<0.05), mientras que no se manifestaron diferencias con el test FACT. La mejor concordancia con el FACT se obtuvo con el ClinicCSF.v2, no hallándose diferencias significativas en todas las frecuencias espaciales evaluadas. Sin embargo, los intervalos de confianza del 95% para las diferencias medias entre ClinicCSF y FACT fueron inferiores para la versión que incorporó un método psicofísico de escalera (ClinicCSF.v1), principalmente para frecuencias espaciales de 6, 12 y 18 cpg.
ConclusionesLa nueva aplicación ClinicCSF para el iPad retina no reflejó diferencias significativas con el test FACT al utilizar los mismos pasos de sensibilidad al contraste. Además, la precisión del examen visual puede mejorarse con el uso de un método psicofísico adecuado.
The Contrast Sensitivity Function (CSF) has been generally accepted as a better predictor of visual performance than high contrast Visual Acuity (VA). In fact, VA is usually considered as a measure of the clarity of vision, and it basically depends on the finest detail that an eye can resolve. On the other hand, the CSF is a more complete metric since it is a measure of the threshold contrast needed to see spatially varying stimuli.1 Indeed, the CSF is nowadays considered a routine clinical tool in optical quality assessment of the eye2,3 and in eye disease detection (e.g., cataracts,4 optic nerve pathologies,5,6 retinitis pigmentosa,7,8 glaucoma,9,10 etc.).
When CSF testing was initially introduced in clinical practice and clinical research, tests usually consisted of computer-generated visual images. However, those devices were typically costly, they needed a calibration and normative data that were not readily available. Consequently, chart-based methods for assessing CSF were developed in the early 1980s.11
In clinical practice, Contrast Sensitivity (CS) is generally measured by means of optotypes of different contrast, such as Pelli-Robson Chart12 or by means of sinusoidal gratings of different spatial frequency.13 The main difference between them is that an optotype contains a wide range of spatial frequencies whose relative weights depend on the letter and its size, while a sinusoidal grating evaluates the response of the visual system to a single spatial frequency.14
Today, the most popular commercial tests for measuring CSF by means of sinusoidal gratings are: Functional Acuity Contrast Test (FACT),15 and the Vector Vision CSV-1000 (VectorVision, Greenville, OH).16 These tests commonly use 9 patches for each spatial frequency but they differ in: the specific spatial frequencies evaluated, in the step contrast sizes and ranges, and in the psychophysical method to achieve the threshold.
Since tablets appeared, new applications (apps) have been proposed in the ophthalmology and optometry practice.17,18 The great advantages of these devices are that they offer the possibility to standardize vision screenings, and since there are many common models which share characteristics such as screen chromaticity and resolution, the chromatic properties of such devices might be assumed to be nearly the same. The aim of this study is to introduce a new App, called ClinicCSF19 to measure CSF with tablet devices and to compare it with other commercial device: the Optec Visual Function Analyzer (Stereooptical, Chicago)20 that contains the FACT.
MethodsSubjects and instrumentsForty-two subjects divided into two groups participated in this study. Subjects from the Group 1 (mean age, 33±12 years) were examined by a trained optometrist with the ClinicCSF.v1 in an optometry center. Subjects from the Group 2, members of the staff and students from the University of Valencia (mean age, 37±11 years), were measured with the ClinicCSF.v2 by a different practitioner. The iPad with Retina display (2048-by-1536-pixel resolution at 264ppi) and the FACT used in both screenings were the same. Monocular VA was measured in both groups with the ETDRS procedure included in the Optec, previously to monocular measurement with ClinicCSF and FACT. Exclusion criteria were strabismus and any cause of monocular reduced visual acuity with habitual correction (worse than 0.3logMAR). Informed consent was obtained for each subject and the research was conducted in accordance with the principles laid down in the Declaration of Helsinki.
App descriptionClinicsCSF is an app developed by pure mobile ActionScript 3.0 code that can be compiled for iPad or Android devices. The app loads 9 patches of sinusoidal gratings for spatial frequencies of 3,6,12 and 18cpd created with MATLAB software (The MathWorks, Natick, MA) and the COLORLAB21 library. This library was used to calibrate the iPad screen by computing the function that links the digital values with the XYZ-CIE tristimulus values and to compute the sinusoidal gratings as follows: First, for each RGB channel of the iPad (primary colors) and for an equal combination of the three (gray scale), ten equally spaced colors were generated and measured with a Spyder4Elite colorimeter obtaining the calibration function. Second, the calibration data were loaded and the digital values of the gratings were computed from the tristimulus values with the COLORLAB library. Finally, the true color patches were exported to JPG format to be compiled into the ClinicCSF app. To minimize edge effects, stimuli were generated with blurred edges by means of a half-Gaussian ramp that fades the stimuli with an achromatic22 background of 86cd/m2 mean luminance (CIE xy coordinates: 0.33, 0.33).
The app was designed to be presented at a distance of 2m for which a stimulus of 4cm subtended 1° (Fig. 1), therefore the experimenter holds the iPad at this distance from the subject and presses the button that corresponds to the subject's response. Two different versions, called “ClinicCSF.v1” and “ClinicCSF.v2”, were developed. In both versions, the stimuli were presented randomly in different orientations: vertical, tilted 15° to the right or tilted 15° to the left. The main differences between ClinicCSF.v1 and .v2 were the psychophysical method used to achieve the CSF threshold and the step sizes between each one of the CS levels. The ClinicCSF.v1 was programmed with the same contrast sensitivity values that the CSV1000 and the ClinicCSF.v2 with the FACT values in order to allow a better comparison with previously reported results (Fig. 2).

.")
With the ClinicCSF.v1, a simple-up down staircase23 psychophysical method was used starting in the fifth patch level for each spatial frequency. In this method, CS goes one level up (e.g. from level 5 to 6) after each right answer until the observer fails. Then, CS goes down until the observer gets right again. The CS threshold was determined by averaging the sensitivities at the turnaround points (i.e. the CS at the levels where direction changed) in the adaptive track for a total of five reversals.
The psychophysical method adopted for ClinicCSF.v2 consisted of three steps: (1) starting at the first level, it goes one level up after each right answer until the observer fails; (2) the same procedure than previous step but starting two levels below the level on which the answer was wrong in step 1; (3) the exam ends after two successive wrong responses as the FACT procedure being the CS threshold the corresponding to the latest correct answer.
Experimental proceduresThe same procedure was followed for both groups of subjects who wore their habitual correction. Subjects from Group 1 and Group 2 were evaluated with the ClinicCSF.v1 and .v2 respectively, and with the FACT. The ambient lighting conditions were around 15 lux during all measurements with ClinicCSF and FACT in both groups. Pupil size and accommodation were not controlled artificially because this study attempted to gain an understanding of the nature of CSF in the natural state of the eyes. The FACT offers four possible configurations in the measurement of the CSF, so the “day condition without glare” was chosen in this experiment. Both the ClinicCSF and the FACT were performed in the same session. The time involved in the CSF measurement with each test was approximately 2min.
Statistical analysisBoth eyes were considered in the statistical analysis due to the low correlation that was obtained between their CS values using the kappa statistic (κ<0.20).24 Differences in age, VA, and CS between groups were evaluated using the Mann–Whitney test, and comparison between tests in the same group was computed with Wilcoxon test. This analysis was based on a non-normal distribution of the data. On the other hand, as the difference of scores between tests was normally distributed, Bland–Altman procedure25 was used to assess the agreement between each one of the ClinicCSF versions and the FACT. The data were managed using SPSS software version 20 (SPSS Inc., Chicago, IL, USA), and p<0.05 was considered to indicate significance.
ResultsNo statistical differences were found in age between both groups of subjects (p=0.064) and median monocular visual acuities were 0logMAR (range, −0.2 to 0.3) in the Group 1 and 0logMAR (range, −0.2 to 0.2) in the Group 2 (p=0.570).
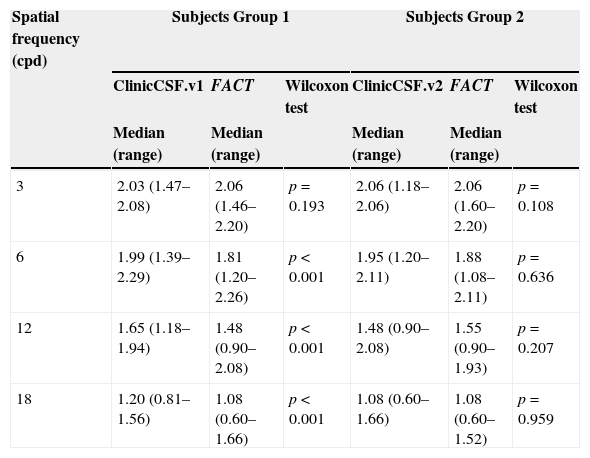
Median CS and range scores obtained at each spatial frequency are summarized for both groups in Table 1 and graphically represented by means of box plot whiskers in Fig. 3. The CSF median values were generally higher for the ClinicCSF.v1 than for the FACT test in Group 1 (Fig. 3A); the differences were statistically significant (p<0.001) for all frequencies except for 3cpd. However, the ClinicCSF.v2 gave similar scores than the FACT for all the evaluated spatial frequencies in subjects from Group 2 (p>0.05) (Fig. 3B).
Comparisons of medians (ranges) between ClinicCSF.v1 vs FACT from Group 1 and ClinicCSF.v2 and FACT from Group 2.
| Spatial frequency (cpd) | Subjects Group 1 | Subjects Group 2 | ||||
|---|---|---|---|---|---|---|
| ClinicCSF.v1 | FACT | Wilcoxon test | ClinicCSF.v2 | FACT | Wilcoxon test | |
| Median (range) | Median (range) | Median (range) | Median (range) | |||
| 3 | 2.03 (1.47–2.08) | 2.06 (1.46–2.20) | p=0.193 | 2.06 (1.18–2.06) | 2.06 (1.60–2.20) | p=0.108 |
| 6 | 1.99 (1.39–2.29) | 1.81 (1.20–2.26) | p<0.001 | 1.95 (1.20–2.11) | 1.88 (1.08–2.11) | p=0.636 |
| 12 | 1.65 (1.18–1.94) | 1.48 (0.90–2.08) | p<0.001 | 1.48 (0.90–2.08) | 1.55 (0.90–1.93) | p=0.207 |
| 18 | 1.20 (0.81–1.56) | 1.08 (0.60–1.66) | p<0.001 | 1.08 (0.60–1.66) | 1.08 (0.60–1.52) | p=0.959 |
 ClinicCSF.v1 and Functional Acuity Contrast Test (FACT) measured in Group 1 of subjects (B) ClinicCSF.v2 and FACT measured in Group 2 of subjects.")
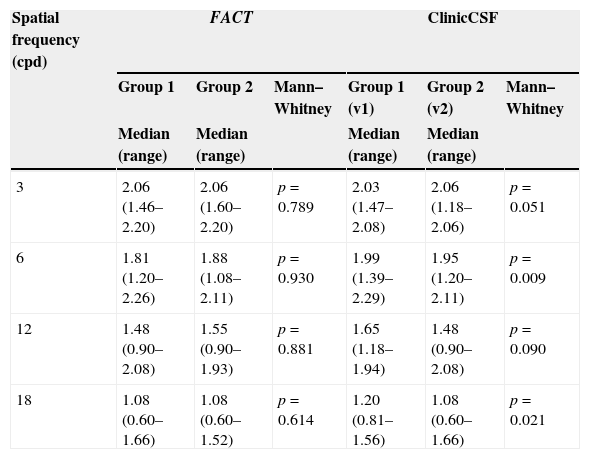
As can be seen in Table 2, both groups gave similar contrast sensitivities when the same FACT test was used to perform the exam (p>0.05). Even though both groups reported similar CSs with the FACT test (Fig. 4A), there existed significant differences between groups when they were measured with different versions of the ClinicCSF for spatial frequencies of 6 and 18 cpd (p<0.05) (Fig. 4B).
Comparisons of medians (ranges) between groups using the same FACT test and two different versions of the ClinicCSF application.
| Spatial frequency (cpd) | FACT | ClinicCSF | ||||
|---|---|---|---|---|---|---|
| Group 1 | Group 2 | Mann–Whitney | Group 1 (v1) | Group 2 (v2) | Mann–Whitney | |
| Median (range) | Median (range) | Median (range) | Median (range) | |||
| 3 | 2.06 (1.46–2.20) | 2.06 (1.60–2.20) | p=0.789 | 2.03 (1.47–2.08) | 2.06 (1.18–2.06) | p=0.051 |
| 6 | 1.81 (1.20–2.26) | 1.88 (1.08–2.11) | p=0.930 | 1.99 (1.39–2.29) | 1.95 (1.20–2.11) | p=0.009 |
| 12 | 1.48 (0.90–2.08) | 1.55 (0.90–1.93) | p=0.881 | 1.65 (1.18–1.94) | 1.48 (0.90–2.08) | p=0.090 |
| 18 | 1.08 (0.60–1.66) | 1.08 (0.60–1.52) | p=0.614 | 1.20 (0.81–1.56) | 1.08 (0.60–1.66) | p=0.021 |
 Group 1 and Group 2 of subjects measured with the Functional Acuity Contrast Test (FACT). (B) Group 1 and Group 2 of subjects measured with the ClinicCSF.v1 and ClinicCSF.v2, respectively.")
In Fig. 5, Bland–Altman plots are represented by means of the difference between the two methods [ClinicCSF.v1−FACT] against the mean [(ClinicCSF.v1+FACT)/2]. The same representation was also done for the ClinicCSF.v2 and the FACT in Fig. 6 by a direct comparison of each one of the spatial frequencies. It can be seen that the ClinicCSF.v1 overestimated the CS with respect to the FACT, and this overestimation was not found with the ClinicCSF.v2 (continuous lines in Figs. 5 and 6). It should also be noted that although we found less differences between the ClinicCSF.v2 vs. FACT than between the ClinicCSF.v1 vs. FACT, narrower agreement limits were obtained with the staircase psychophysical method of the ClinicCSF.v1; mainly for spatial frequencies of 6, 12, and 18cpd (dashed lines in Figs. 5 and 6).
, 6cpd (top-right), 12cpd (bottom-left), and 18cpd (bottom-right). The solid lines represent the mean difference between the two instruments and the dashed lines correspond to the 95% confidence interval (mean±1.96SD). A linear fit was done for statistically significant correlations (p<0.05) and the Pearson coefficients (r) are reported for 3cpd (r=0.37), 12cpd (r=0.56), and 18cpd (r=0.34).")
Bland–Altman plots. CS difference between methods versus mean of CS scores measured with FACT and ClinicCSF.v1 for spatial frequencies of 3cpd (top-left), 6cpd (top-right), 12cpd (bottom-left), and 18cpd (bottom-right). The solid lines represent the mean difference between the two instruments and the dashed lines correspond to the 95% confidence interval (mean±1.96SD). A linear fit was done for statistically significant correlations (p<0.05) and the Pearson coefficients (r) are reported for 3cpd (r=0.37), 12cpd (r=0.56), and 18cpd (r=0.34).
, 6cpd (top-right), 12cpd (bottom-left), and 18cpd (bottom-right). The solid lines represent the mean difference between the two instruments and the dashed lines correspond to the 95% confidence interval (mean±1.96SD). A linear fit was done for statistically significant correlations (p<0.05) and the Pearson coefficients (r) are reported for 6cpd (r=0.44).")
Bland–Altman plots. CS difference between methods versus mean of CS scores measured with FACT and ClinicCSF.v2 for spatial frequencies of 3cpd (top-left), 6cpd (top-right), 12cpd (bottom-left), and 18cpd (bottom-right). The solid lines represent the mean difference between the two instruments and the dashed lines correspond to the 95% confidence interval (mean±1.96SD). A linear fit was done for statistically significant correlations (p<0.05) and the Pearson coefficients (r) are reported for 6cpd (r=0.44).
Correlations between differences versus mean scores obtained with tests were analyzed by the Pearson coefficient (r) and represented in the Bland–Altman plots by linear least squares fitting in case of being statistically significant (p<0.05). Therefore as can be seen in Fig. 5 for the comparison between ClinicCSF.v1 and FACT, the regression lines show positive correlations with the increment of mean CS for 3, 12 and 18cpd (r=0.37, 0.56 and 0.34, respectively). On the other hand, the correlation was significant only for 6cpd (r=0.44) in the comparison between ClinicCSF.v2 and FACT (Fig. 6).
DiscussionThe aim of this study was to present a new iPad app to measure CSF. Two versions (ClinicCSF.v1 and .v2) have been proposed and tested in comparison with other commercial test (FACT). Although two different groups of subjects were used in the evaluation of each one of the ClinicCSF versions, no statistical differences in visual acuity and age were found between both groups. Special attention was paid on age of participants considering that CSF could be influenced by this variable26. In fact, some commercially available tests, such as the CSV1000, have different normative ranks depending on age of the subjects.27
We found significant differences between ClinicCSF.v1 and FACT for all spatial frequencies except for 3cpd (Table 1). This lack of agreement can be attributed firstly to the fact that each test measures different CS levels (Fig. 2) and secondly to the different psychophysical method employed in each version. Other comparative studies also found discrepancies due to the similar reasons. Franco et al.13 compared the VCTS-6500 and the CSV-1000 and found mean differences of 0.30, 0.20, 0.08 and 0.18 for spatial frequencies of 3, 6, 12 and 18cpd, respectively, the differences being statistically significant for all spatial frequencies. Such differences are even higher than those obtained in the present study except for 12cpd (Fig. 5). As expected, the differences between the ClinicCSF.v2 and the FACT were very much lower due to both tests having the same CS levels and use the same thresholding technique (Fig. 6), unlike the ClinicCSF.v1 and FACT (Fig. 5).
Other researchers have sounded a note of caution with regard to the comparison of the same test with different configurations. For instance, FACT differs from the previous Vistech version in several characteristics: using smaller step sizes, a 3 alternative forced choice, “blurred” grating patch edges with the gratings smoothed, and a larger patch size to increase number of cycles at low spatial frequencies. Pesudovs et al.28 attributed dissimilar results between Vistech and FACT to the fact that this new version uses smaller step sizes with the same number of steps, and thus ranges of measurement are also smaller. As a consequence, they reported a ceiling effect in post-LASIK patients and a floor effect in cataract patients. Furthermore, Hitchcock et al.29 showed that not only step sizes could have influence on the CS since they found that although contrast levels were the same, results could be different depending on the way tests were presented.
Positive correlations between mean differences and the average of CS were found with the ClinicCSF.v1 for three spatial frequencies (Fig. 5). These correlations represent that the CS with ClinicCSF.v1 was higher than FACT mainly in subjects with poorer CS. Significance of this correlation disappeared with the ClinicCSF.v2 and curiously the only significant correlation between ClinicCSF.v2 and FACT was discovered at 6cpd (Fig. 6), spatial frequency that was not significant with ClinicCSF.v1. We consider that these correlations might mainly be due to step sizes with the same number of steps as was mentioned before when we discussed the conclusions of Pesudovs et al.28 This would appear to indicate that ceiling and floor effects might also appear for the comparison between ClinicCSF.v1 and FACT in cataract and refractive surgery patients.
We also found that mean differences confidence intervals were highly influenced by the psychophysical method used to achieve the CS threshold. Confidence intervals of the Bland–Altman plots for differences between ClinicCSF.v1 and FACT were narrowed by using a staircase method (Fig. 5). This fact underlines the importance of including a psychophysical method in iPad based screening tests instead of using it simply as an illuminated screen.30,31
The biggest differences in the CSFs between groups were found when we changed some properties of the test design (Table 2). This demonstrates just how important is it to use the same test in the comparison between groups of subjects. Consequently, clinical results in studies which implement different CS tests might also differ due to the configuration of tests used. In fact, the discrepancies in the comparison of several CS tests have been widely studied, mainly in order to obtain normative data for contrast sensitivity functions.32
One limitation of this study is that two different groups of subjects were used to compare each one of the ClinicCSF versions with the FACT. The reason is that ClinicCSF.v1 was first designed and evaluated clinically with one group of subjects. Lately ClinicCSF.v2 was developed as an improved version of ClinicCSF.v1 and it was not possible to measure the same group of subjects. A better statistical analysis of variance could have been done if we had measured the CSF with the three tests in the same group of subjects. Other limitation of our current proposal is related to the maximum brightness configuration of the iPad that might produce a glare effect in some patients, and a possible post-image after each answer. This issue should be considered in future versions of the app.
Our work led us to conclude that ClinicCSF app, designed for a given tablet device, can give similar results than FACT in CSF measurement in a normal population. Further experiments using the ClinicCSF app in different versions of the same device are required in order to extrapolate our results. The findings might not be generalized to all the iPad screens because the uniformity of colorimetric and photometric properties among all iPads has not yet been proven. We think that our new test could be useful to popularize the CSF measurement in centers that do not usually perform it, due to the high cost of current commercial equipment. Further experimental investigations are also needed to estimate normative ranges and ROC curves.
Conflicts of interestRodríguez-Vallejo, M. has designed and programmed the ClinicCSF app which he currently distributes by the Apple Store with his own developer account. The other authors report no conflicts of interest and have no proprietary interest in any of the materials mentioned in this article.
We acknowledge financial support from Ministerio de Economía y Competitividad (grant FIS2011-23175) and Generalitat Valenciana (grant PROMETEO2009-077), Spain.


