


To analyze the state of scientific publications in multifocal contact lenses field through a bibliometric study.
MethodsThe database used to carry out the study was SCOPUS and contained the descriptors “multifocal contact lens”, “bifocal contact lenses”, “progressive contact lenses” and “presbyopia contact lenses”, limited to the fields of title, keywords and abstract. The indicators applied in this research were: doubling time and annual growth rate, Price’s transience index, Lotka’s law of scientific productivity, and Bradford’s zones.
ResultsA total of 346 articles were published between 1960 and 2019. The growth in the number of publications matches the exponential adjustment slightly better (R = 0.53). The duplication time was 13.2 years. The productivity level is focused on articles with an average number of authors of just 2.06 per article. The Bradford core was formed by two journals, Optometry and Vision Science and Eye and Contact Lens.
ConclusionsResearch on multifocal contact lenses has exponential growth, without evidence of having reached a saturation point. The main countries in scientific production in this field are the United States and Australia.
Presbyopia is the most common refractive error, affecting everybody over 55 years old. Globally, the presbyopic population is growing, with estimates of more than two billion people over the age of 60 by 2050 according to the Department of Economic and Social Affairs of the United Nations.1
This refractive error can be corrected in several ways, including spectacles, contact lenses and surgery, spectacles being the most extensively used correction method. However, people with presbyopia suffer from a reduced quality of life, and 86% of patients would pay at least $5 per day to be spectacle independent.2
According to the above data, multifocal contact lenses should be one of the most commonly fitted contact lenses around the world, but despite the evolution of this kind of lens, only 18% of lens fittings in 2018 corresponded to multifocal designs. Researchers have been working for years on developing solutions for presbyopia. One of the most remarkable milestones in the history of multifocal contact lenses was the introduction of Acuvue Bifocal, the first disposable contact lens for presbyopia, launched in 1998 by Vistakon. Since then, designs and materials have continued to evolve, and there is a huge amount of scientific production related to multifocal contact lenses that could be quantified by bibliometrics.
A sign of the importance of multifocal lenses is the forecast done by ReserachAndMarkets in the “Contact Lenses Market by Model, Design, Material, Application, Distribution Channel - Global Forecast to 2023” report. They have concluded that multifocal contact lenses segment is expected to grow at the highest compound annual growth rate (CAGR) during the forecast period.
To analyze the state of scientific publications in this field, a bibliometric study has been conducted. As far as results from scientific’s publications are difficult to value, analysis methods are needed to measure the research ability. “Indicators” can be defined as the parameters used in the evaluation process of any activity. Each indicator is used to highlight a specific aspect.3 Nowadays, reviews in science would not be understood without these indicators.
Bibliometrics, throughout their indicators, is focused on the calculation and analysis of quantifiable values of scientific’s use and production. It would be defined as the science that studies nature and the course of a field, as soon as it has scientific production, though the measurement and analysis of some aspects of the writing communication. Bibliometrics includes obtaining, treatment, and use of quantitative bibliography's data from scientific publications. The Organization for Economic Co-operation and Development (OECD) referred to bibliometrics as a tool used to observe the state of science and technology in a field of knowledge through the global production of scientific literature.3
The objective of this study is to analyze the scientific evolution of multifocal contact lenses.
Material and methodsThe database used in this bibliometric study was SCOPUS, the largest abstract and citation database of peer-reviewed literature, covering nearly 22,000 titles from over 5000 publishers, of which 21,500 are peer-review journals in the scientific, technical, medical, and social science fields (including arts and humanities). Scopus is the most complete and easy to use database in the biomedical field in comparison with any other tool used in scientific literature research, it is considered the largest database in the world, and is commonly used by researchers to perform bibliometric analysis.
Documents published up until 2019 were retrieved using remote downloading techniques. The search was limited to the fields: abstract, title, and keywords, using the specific descriptors "multifocal contact lens" OR "bifocal contact lenses" OR "progressive contact lenses" OR "presbyopia contact lenses". Data were extracted from Scopus at one day (May 1, 2019) to avoid bias because of daily updating in the database.
This study used the most common bibliometric indicators: Price’s Index, duplication time, annual growth rate, Price’s transience index, citation index, and Bradford's zones.
Price’s Index is a widely used indicator for the analysis of productivity in a specific field or country. It gives information about the growth of scientific production. In this study, Price’s law4 has been applied.
Other important indicators about growth are duplication time and annual growth rate. The first one gives information about how many times is required by a topic to double its scientific production. It is measured by the equation of Egghe and Ravichandra,5 and this function is represented mathematically as:
Where C(t) is the total number of papers produced until a date in years (t); c and g are estimated constants of the data, considering that c > 0, g > 1, and t ≥ 0. The model not only provides an average rate of growth but also offers a rate of duplication time. To estimate the duplication time (D) of the scientific literature, the following equation is used:Among bibliometric indicators of dispersion, this studied has used the Bradford Zones. Bradford evidenced that a small number of journals concentrate most of the papers related to a specific field. This implies that in journals outside the nucleus there is a little number of articles.6 This model allows identifying the most common journals used for publishing in a field.
Impact Factor (IF) gives information about the influence of scientific publications. It considers how many times a journal has been cited in the “Science Citation Index” database during the last two years, and the number of papers published in the journal in these same years. The list of scientific journals of “Journal Citation Report”, classified them in different areas, gives each one an IF value that offers information about its prestige.
The last indicator used has been the Lokta indicator. Lotka enunciated the law about the distribution of authors based on the number of articles published,7 also known as the "inverse quadratic of scientific production". It studies the volume of publications of each author. It is calculated according to the following formula:
where A represents the number of authors who have published a number (n) of works, in a period of years.According to this index, the authors are categorized into three levels of productivity: small producers, those who published just one article; medium-sized producers, those who published between 2–9 articles; and large-scale producers, those publishing 10 or more articles.
It is also interesting to find out the number of authors with a single publication. This is known as the transience index, or Price’s Index, its formula being as follows:
Finally, the h index measures the authors' activity. This index is one of the most widely used bibliometric indicators to evaluate the success of a researcher’s work.8 According to Hirsch,9 a researcher has an h index when h of his/her papers has got at least h cites. However, the h index has also limitations. It tends to penalize authors that priories quality versus quantity. It also plays in favor of researchers with an extended career, that has usually published more papers.10–12 The g-index is introduced as an improvement of the h-index of Hirsch to measure the global citation performance of a set of articles.13 Propose by Egghe,13 it is calculated by ranking the articles of a researcher in decreasing order of the number of citations that they received. So, the g-index is the unique largest number such that the top g articles received together at least g2 citations. The g and h index are related through p-index that permit classified authors considering the most important works and the cumulate citations. P-index is calculated as:
h-index has been obtained from Scopus. g and p indexes were calculated from data extracted from the same database. Data were extracted from Scopus at one day (May 1, 2019) to avoid bias because of daily updating in the database.Results
Through the above-mentioned search criteria, 346 research publications have been retrieved within the 60 years studied (1960–2019). Of these, 84.10% (n = 291) were original articles, while the rest, 15.9%, were reviews, conference papers, letters, erratum, short surveys, book chapters, editorials, articles in press, and notes.
The chronological distribution of publications showed an increase in the number of articles in the area of Multifocal Contact Lenses research across the years. Fig. 1 also reflects how the mathematical adjustment to a linear curve (y = 0.2547x–500.87) reveals a correlation coefficient of 0.51. This coefficient indicates that 51% cannot be explained by a linear adjustment. The exponential adjustment (y = 1E-61e0.076x) provides a 0.53 coefficient and therefore a residual variability percentage of 53%. This result implies that Price's Law is fulfilled, as results fit better with an exponential fitting than a linear one.

With the values of the exponential model by the non-linear regression method, the equation of Egghe and Ravichandra Rao can predict the growth of the published literature on Multifocal Contact Lenses:
The result is that publications about multifocal contact lenses have been growing 5.1% per year with a production that doubles its size every 13.2 years. The model is explained at 56%.
Fig. 2 shows the distribution in five-year periods. It reflects as most of the documents have been published from 2015 until 2019, with a total of 27.46% of the papers. The increase in publications from 2015 to 2019 compared to the previous period is 82.69%. The period between 1985 and 1989 highlights with an increase of 900% compared to the previous 5-year period.

The geographical and affiliation distribution of the documents is presented in Fig. 3. As regards the most productive countries, the United States (32.08%) in the first place, followed by Australia (14.45%), United Kingdom (11.56%), and Spain (11.56%). These four countries account for nearly 70% of the total production. As far as institutions are concerned, Fig. 3 shows the University of New South Wales in Australia stands out with 29 articles, followed by Brien Holden Vision Institute with 28 articles, and the University of Valencia with 20.

The 346 articles compiled during the search have been published in a total of 80 different journals, the highest number of articles corresponding to Optometry and Vision Science, with 89, as Fig. 4 shows.

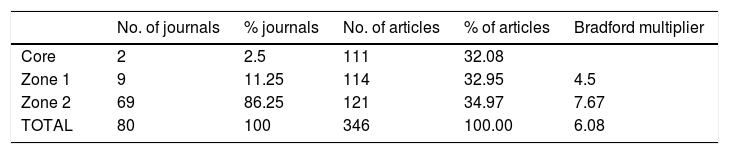
Table 1 presents the results of applying the Bradford model, showing the division of the different zones. The mean number of articles per Bradford zone is 114. The nucleus is composed of the journals Optometry and Vision Science, with IF = 1.577 according to JCR 2019 and Eye and Contact Lens (before known as Clao journal) with IF = 1.874. From the results obtained in our search, both journals have more than 30% of multifocal contact lens articles.
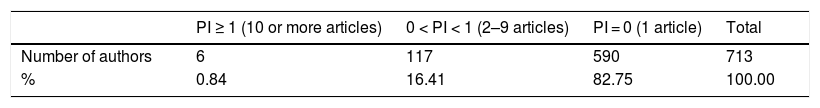
Distribution of authorship according to Lotka’s Law can be observed in Table 2. The distribution is highly concentrated in small producers, with a transience index (occasional authors) of 75% and the presence of only six big producers (authors with 10 or more articles). The total number of authors is 713, which for the 343 documents represents a co-authorship index of 2.06.
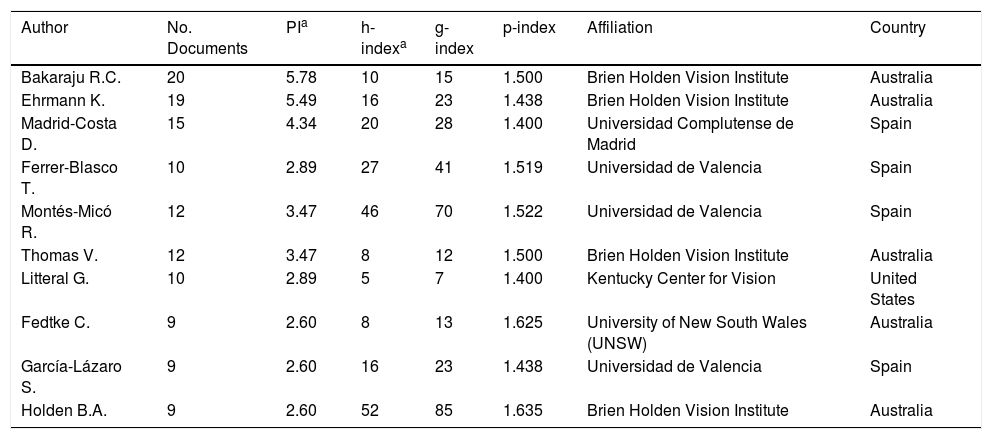
Continuing with authorship analysis, Table 3 shows, from the results obtained in our search, that four authors are responsible for nearly 20% of the published articles. Among the top ten, there are 5 Australian authors and four from Spain. According to researcher relevance, there are 2 authors with h index over 40 (Holden B.A. y Montés-Micó R.) and 2 authors with p index over 1.6 (Thomas V. y Fedtke C.)
Most productive authors.
| Author | No. Documents | PIa | h-indexa | g-index | p-index | Affiliation | Country |
|---|---|---|---|---|---|---|---|
| Bakaraju R.C. | 20 | 5.78 | 10 | 15 | 1.500 | Brien Holden Vision Institute | Australia |
| Ehrmann K. | 19 | 5.49 | 16 | 23 | 1.438 | Brien Holden Vision Institute | Australia |
| Madrid-Costa D. | 15 | 4.34 | 20 | 28 | 1.400 | Universidad Complutense de Madrid | Spain |
| Ferrer-Blasco T. | 10 | 2.89 | 27 | 41 | 1.519 | Universidad de Valencia | Spain |
| Montés-Micó R. | 12 | 3.47 | 46 | 70 | 1.522 | Universidad de Valencia | Spain |
| Thomas V. | 12 | 3.47 | 8 | 12 | 1.500 | Brien Holden Vision Institute | Australia |
| Litteral G. | 10 | 2.89 | 5 | 7 | 1.400 | Kentucky Center for Vision | United States |
| Fedtke C. | 9 | 2.60 | 8 | 13 | 1.625 | University of New South Wales (UNSW) | Australia |
| García-Lázaro S. | 9 | 2.60 | 16 | 23 | 1.438 | Universidad de Valencia | Spain |
| Holden B.A. | 9 | 2.60 | 52 | 85 | 1.635 | Brien Holden Vision Institute | Australia |
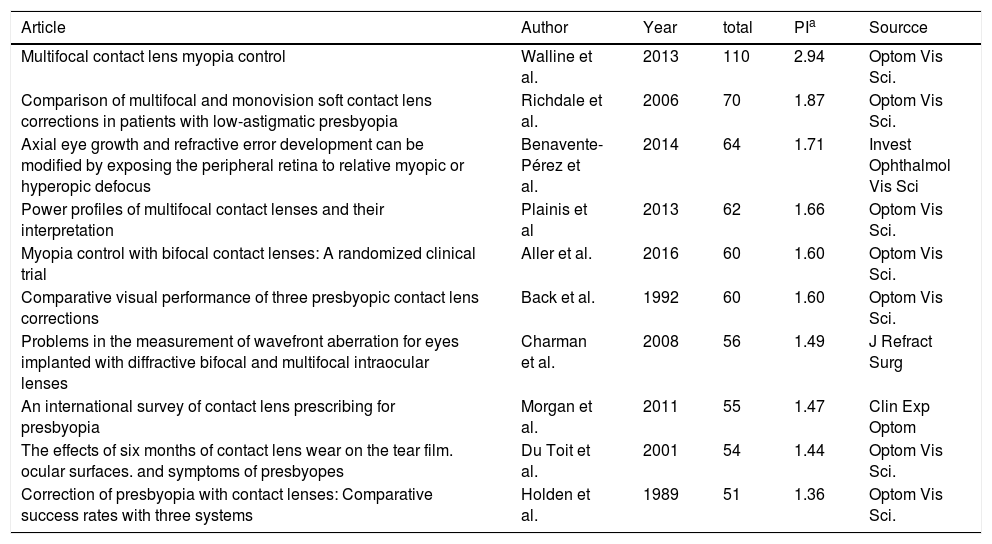
Finally, studying citations, there are 3746 cites for the 346 documents found. That supposes a mean citation of 10.8. Table 4 shows the top ten papers, with 7 published in the journal Optometry and Vision Science. The most cited paper, “Multifocal contact lens myopia control”, got 110 cites (2.94%) y was published also in the journal Optometry and Vision Science.
Most cited articles.
| Article | Author | Year | total | PIa | Sourcce |
|---|---|---|---|---|---|
| Multifocal contact lens myopia control | Walline et al. | 2013 | 110 | 2.94 | Optom Vis Sci. |
| Comparison of multifocal and monovision soft contact lens corrections in patients with low-astigmatic presbyopia | Richdale et al. | 2006 | 70 | 1.87 | Optom Vis Sci. |
| Axial eye growth and refractive error development can be modified by exposing the peripheral retina to relative myopic or hyperopic defocus | Benavente-Pérez et al. | 2014 | 64 | 1.71 | Invest Ophthalmol Vis Sci |
| Power profiles of multifocal contact lenses and their interpretation | Plainis et al | 2013 | 62 | 1.66 | Optom Vis Sci. |
| Myopia control with bifocal contact lenses: A randomized clinical trial | Aller et al. | 2016 | 60 | 1.60 | Optom Vis Sci. |
| Comparative visual performance of three presbyopic contact lens corrections | Back et al. | 1992 | 60 | 1.60 | Optom Vis Sci. |
| Problems in the measurement of wavefront aberration for eyes implanted with diffractive bifocal and multifocal intraocular lenses | Charman et al. | 2008 | 56 | 1.49 | J Refract Surg |
| An international survey of contact lens prescribing for presbyopia | Morgan et al. | 2011 | 55 | 1.47 | Clin Exp Optom |
| The effects of six months of contact lens wear on the tear film. ocular surfaces. and symptoms of presbyopes | Du Toit et al. | 2001 | 54 | 1.44 | Optom Vis Sci. |
| Correction of presbyopia with contact lenses: Comparative success rates with three systems | Holden et al. | 1989 | 51 | 1.36 | Optom Vis Sci. |
The baseline of any scientific field is its scientific literature. The use of bibliometrics to study the research capacity in a specific field is since scientific publications are the result of the research activity. This is the reason why bibliometrics has become a useful tool to evaluate the scientific relevance in a field.3
The results of this bibliometric analysis allow us to understand the development of scientific literature on multifocal contact lenses over recent decades. The study of scientific literature growth is important to predict its future. Comparisons of exponential models through the duplication time give and idea about the growth rate in a specific activity, and a prediction about the evolution of the studied topic.
This analysis, as Fig. 1 shows, confirms that the number of publications about multifocal contact lenses has exponentially increased in the 60 years studied. That reflects the great interest that multifocal contact lenses have for researchers. Comparing to other special contact lenses, orthokeratology, and scleral contact lenses have duplication times of 7.3 and 13.5 years respectively, versus almost 13 years in multifocal contact lenses.14,15 Results show great interest in multifocal contact lens field, highlighting as most productive years 2000, 2013, and the period of 2015–2019.
A series of studies about the efficacy of multifocal contact lenses,16–20 especially Acuvue® Bifocal (Johnson & Johnson, USA), and some others explaining how to fit this kind of contact lens21,22 made 2000 one of the years with the highest number of publications.
2013 was also an important year in terms of the number of papers published. This was due to studies relating to myopia control, which found that multifocal contact lenses had a positive impact on the myopic children that wore them.23,24 In the same year also saw studies of the power profile of some multifocal contact lenses. Plainis et al. studied Air Optix AQUA (Alcon, USA), PureVision multifocal (Bausch & Lomb, USA), Acuvue OASYS for Presbyopia (Vistakon, USA) and Biofinity multifocal (CooperVision, USA),25 concluding that variation of the power through the simultaneous image improved focal depth.
2016 and 2017 was the year with the highest production of all, thanks to research papers on myopia control and others studying the links between presbyopia and pupil size.26–28 In that year, Guillon et al. concluded that multifocal contact lenses should be fitted according to the age of patients and their refractive errors.27 If it is observed the distribution of papers by decades, it can be confirmed that the last five years (2015–2019) were the most productive, with an increase of close to 70% versus the previous five-year periods. This proves the great interest of research in this important field. Indeed, it is worth highlighting the doubling time of scientific literature on multifocal contact lenses, which stands at 8.08 years, thus demonstrating a high degree of dynamism.
Although the USA is the country that contributes the most documents, the most productive institution is the University of New South Wales in Australia. Berkeley, in 6th position, is the highest-ranking American university.
Regarding authorship analysis, papers with just one author are the most prevalent, accounting for more than 20% of the documents. This low collaboration rate (2.03 authors per document) and the transience index highlight that this is a largely individualized field of research in which most authors have made just one contribution to the subject, which is in line with similar studies of special contact lenses worn for myopia control, such as Ortho-K, with a 1.9 collaboration rate.14
On this subject, only four authors are responsible for nearly 20% of the published papers. These four authors are Bakaraju and Ehrmann, from the Brien Holden Vision Institute (Australia), whose published papers deal mainly with aberration29,30 and visual performance.31–33 Madrid-Costa and Ferrer-Blasco from Universidad Complutense de Madrid and Universidad de Valencia (Spain), respectively, with co-authored articles on stereoacuity,34,35 power profiles36 and vision performance.37,38 The h index is one of the most commonly used bibliometric indicators to estimate the success of an author’s work. This indicator estimates the number of important papers per author. Taking into account other research fields in contact lenses, as scleral or ortho-K contact lenses, we can affirm that authors use to be specialized as far as there is no coincidence in the authors of every field.14,15
As shown in Table 3, seven of the most productive authors have an h index of over 10 and two of them over 40: Montés Mico (Spain) and Holden (Australia). Both authors are the main researchers of the research groups abovementioned.
Quality is another interesting aspect of scientific production that has been analyzed. To this end, we used indicators of impact and excellence for the publications studied. In this way, we have found in the first places journals with high prestige in Optometry as Optometry & Vision Science, Contact Lens and Anterior Eye or Eye and Contact Lens. These journals occupied also the first places in the research of Optometry in general, and in contact lenses, being the same journals as in other similar studies with scleral and ortho-K contact lenses.14,15
Regarding most cited articles, 2 of the top ten were about myopia control with multifocal contact lenses, one of the widely used methods to control this ametropia.39 Thirty-two papers in this research are about this topic (9.25% of the articles).
ConclusionsDespite the limitations of bibliometric studies, this work offers a representative image of the evolution of research on multifocal contact lenses, highlighting that Australia and Spain play a key role in the research performed in this field. This research will probably keep growing due to the aging of populations worldwide and higher visual demands caused by increasing dependence on electronic devices. Besides, the use of multifocal contact lenses pursues other goals in addition to presbyopia, as is the case of myopia control in children, a subject which also generates huge scientific interest.
Conflicts of interestThe authors have no conflicts of interest to declare.


