


to evaluate the effects of kappa angle and intraocular orientation on the theoretical performance of asymmetric multifocal intraocular lenses (MIOL).
MethodsFor a total of 21 corneal aberrations, a computational analysis simulated the implantation of a computationally designed MIOL. An image quality parameter (IQ) (visually modulated transfer function metric) was calculated for a 5.0-mm pupil and for three conditions: distance, intermediate, and near vision. The procedure was repeated for each eye after a rotation of the MIOL with respect to the cornea from 0º to 360º in 5º steps. Kappa angles from 0 to 900 microns, in 150 microns steps, combined with two two variants of MIOL centration were tested: in the corneal apex or in the center of the entrance pupil. A p-value ≤ 0.05 was considered significant.
ResultsThere were statistically significant differences of the IQ depending of the intraocular orientation of the MIOL. If kappa angle was increased, there was a statistically significant decrease of the IQ. The IQ maintained stable when the optimal intraocular orientation was re-calculated for each kappa angle. In general, the inter-variability of the results between subjects was very high. There were no strong evidences supporting that there exists a preferable centration point.
ConclusionsOur results suggest that kappa angle theoretically affects significantly the performance of asymmetric MIOL implantation. However, its negative effect can be compensated if a customized intraocular orientation is calculated taking into account the presence of the kappa angle.
The nomenclature of angle kappa (κ) is still controversial due to conflicting formulations of the same angle with different names by Le Grand & El Hage and Lancaster..1,2. According to Le Grand & El Hage,1 it is defined as the angular distance in the object space between the pupillary axis and the Line of Sight (LoS). The pupillary axis is the line perpendicular to the cornea that intersects the center of the entrance pupil, while the LoS is the axis that connects the fixation point to the center of the entrance pupil.1
While κ angle can be accurately measured, for example, with devices for monitoring Purkinje’s images,3 such as devices are not widely used in clinical practice. Therefore, due to the fact that many commercial ophthalmic devices (i.e. corneal topographers) display the Cartesian coordinates x,y between the corneal apex (approximation to the corneal intersection of LoS, also known as ophthalmometric pole) and the entrance pupil center (approximation to corneal intersection of pupillary axis), the measurement of the distance between the two can be used to estimate κ as a cartesian distance given in μm.4–6 The corneal apex represents the point of maximum corneal elevation when fixating on a target. It is a reproducible measurable point, independent of pupil size, day of examination or measurement device.7,8 The mean κ estimated in a healthy population using the above approximate method could be between 200−400 μm,9 but is known to vary as much as from 0 to 650 μm,10–12and more in hyperopic eyes.9,13
In the recent years, the design of multifocal intraocular lens (MIOLs) has seen major developments and a good alternative to the traditional radial designs has been established in asymmetric designs. Numerous studies have shown that asymmetric MIOLs can provide good visual outcomes for both near and far vision, good contrast sensitivity, and positively impact the quality of life of patients.14–16 Asymmetric refractive MIOLs are characterized by asymmetric optical aberrations that interact with likewise asymmetric aberrations of the cornea. The visual outcomes of such interactions should thus be expected to vary with the orientation of the axis of implantation of the lens. It has been shown that exists an optimal axis that maximize the visual outcomes when the MIOL is implanted oriented towards it.17–19 Said optimal axis is individual for each patient and any deviations will penalize the results.17–19 Finding this ideal orientation is a task that can be performed through a simple optical simulation, although in practical terms it has been found that the corneal comatic axis is a good approximation.17
During cataract surgery, while centering the MIOL the surgeon is often confronted with situations where κ is not zero, which has been associated with patient’s discomfort.4 In such situations, the choice to be taken is not obvious. Some authors agree that the center of the lens should coincide with the geometrical pupil center, resulting in the desired balanced contribution of light from the designed focal points, especially in diffractive designs.20 Other suggest the centration at the corneal apex, as it is a good approximation for the corneal intersection of the line of sight that is, in turn, the theoretical reference axis for human vision.21 And other suggested that the use of MIOLs is not acceptable at all when κ is greater than half of the diameter of the central optical zone of an IOL.22
To the best of our knowledge there are no research reports regarding the relationship between κ and optimal intraoperative orientation and centration of asymmetric MIOLs. Existing studies are limited to the situations where pupillary axis and LoS are coincident.17,19,23 The goal of the present study is to fill this gap by trying to ascertain whether κ is an important factor when dealing with customized implantation of an asymmetric MIOL.
Material and methodsComputing the theoretical MIOL wavefrontA theoretical wavefront for a bifocal IOL design with a pupil radius of 3.5 mm was generated numerically using MATLAB® (MathWorks, Inc., Natick, MA). The upper semi-circular area of this idealized wavefront was flat, corresponding to 0D of optical power (far vision), and the shape of the lower half was spherical, corresponding to 2.5D addition (near vision), as shown in Fig. 1. The minimum number of Zernike coefficients required to obtain a defocus curve with a clear bifocal character was found by means of a numerical through-focus analysis of simulated image quality. The Zernike defocus coefficient Z20 was iteratively varied by an amount corresponding to the dioptric span from -3.5 to 1.5D in 0.5D steps. At each step the simulated image quality was evaluated using the Strehl ratio metric.24 The process was repeated for Zernike coefficients up-to (and including) orders: 4, 5, 6, 7 and 8 as seen in Fig. 2. Although it has been demonstrated that for real MIOLs higher orders than 8 would be necessaries,25 for our simplistic model showed in Fig. 1, fitting 8 orders of Zernike coefficients to the theoretical wavefront yielded a good bifocal representation of a MIOL visual results.


Twenty eyes of 20 healthy patients (10 male and 10 female) without previous surgeries or pathologies from 45 to 71 years old (mean: 58 ± 7 years) were included in the study. The spherical equivalent ranged between -4.00 and +3.00 D (mean: -0.425 ± 1.84 D) with corneal astigmatism below 0.50 D in all of the cases. For each eye, a Scheimpflug-based imaging system (Pentacam; Oculus Optikgeräte GmbH, Wetzlar, Germany) was used to obtain the corneal aberrations with respect the pupil center for a 7 mm diameter pupil, taking into account the first and second corneal surfaces. Zernike coefficients related to primary corneal astigmatism were removed from the calculations in order to isolate the effect of the bifocal design from other factors.
Then, the Zernike coefficients were used to compute the corneal wavefront for each eye, and also a mean corneal wavefront of all subjects (included in the results and discussion as eye 21).
Simulating MIOL rotation and centrationAll of the simulations were carried out using a purpose-designed Matlab program. The wavefronts used for simulations of image quality were obtained for each eye by means of adding the theoretical MIOL wavefront to the corneal wavefront of each eye, while taking into account the position and diameter of the pupil.
The propagation of the wavefront from the cornea to the plane of the entrance pupil through the aqueous humor was estimated by finding the vectors normal to the slopes at each point of the corneal wavefront, calculating the displacement of each point along the normal and fitting Zernike coefficients to the new wavefront (geometrical propagation). The effects of the propagation were found to be negligible and disregarded in the simulations that followed.
The effects of rotation and centration of the MIOL were analyzed. The rotation was examined by changing the orientation of the theoretical wavefront of the simulated MIOL along each possible meridian, from 0° to 360° in steps of 5°. The reference orientation was chosen to be the position of the MIOL coinciding with the near- and far-vision transition zones oriented horizontally, and far-vision area located in the superior part (see Fig. 2).
The centration was expressed by κ, which changed in the following steps: 0, 150, 300, 450, 600, 750 and 900 μm and was measured from the center of the entrance pupil, and away from the line of sight. These Cartesian distances can be translated to degrees using the relation 13° ≈ 1 mm suggested by Grosvenor TP,26 being 0, 1.95, 3.9, 5.85, 7.8, 9.75, and 11.75 degrees respectively. Two methods of centering the MIOL were evaluated (a diagram of both methods can be seen in Fig. 3):
- ●
Method 1 - MIOL centered at the geometrical center of the pupil. The MIOL was displaced along with the pupil.
- ●
Method 2 - MIOL centered at the corneal apex. Only the pupil was displaced.
. Finally, the intraocular lens is represented by the inner circle with a segmentation in the lower part, while the dot is its center.")
Scheme of the two tested methods. Dotted line represents the corneal diameter, while the small black circle its center. Big texturized ring is the iris, while the white «x» is its center (same than the pupil center). Finally, the intraocular lens is represented by the inner circle with a segmentation in the lower part, while the dot is its center.
All of the simulations were performed using a 5.0 mm pupil diameter. The choice of pupil diameter was based on a study by Winn et al.,27 who found that the mean pupil diameter under mesopic conditions was approximately 5.0 mm in patients older than 60 years. Choosing a smaller pupil diameter than the one used to define the aberrations of the cornea and the MIOL (7.0 mm) allowed for testing the effects of decentration of up to 1000 μm between both components with respect to the pupil.
Fedtke et al. reported that at 60° observation angle the systematic decentration of the geometrical center of the entrance pupil compared to the actual pupil center exceeds 0.2 mm for a 6 mm pupil diameter, this effect is negligible for small angles relevant to the present study.28
Evaluating the image quality in through-focus simulationsThe through-focus analyses of image quality (IQ) carried out in the present study were based on incrementally changing the Z20 defocus Zernike coefficient of the total wavefront (eye + MIOL), and evaluating the resulting image-plane visual quality using the VSMTF metric - visual Strehl ratio computed in frequency domain (MTF method).29–31
where CSFN - Neural Contrast Sensitivity Function, MTFDL - diffraction-limited Modulation Transfer Function.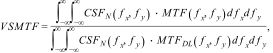
This image quality metric is known from previous experiments to account well for changes in retinal image quality.31 Modulation in spatial frequencies above the visual cut-off of about 60 c/deg is ignored by this metric, and modulation near the peak of the CSF (e.g. 6 c/deg) is weighted maximally. The metric gives weight to visible, high spatial-frequencies employed in typical visual acuity testing (e.g. 40 c/deg in 20/15 letters). In the MTF calculation, an apodized filter was also included in the amplitude function to simulate the Stiles-Crawford effect.32
In the present study it was assumed that the MIOL was of distance-dominant type, and as the first step of every analysis, the value of the Z20 Zernike defocus coefficient corresponding to emmetropia was found as the value that maximized the IQ. Taking this value as the reference far-point, the Z20 values corresponding to intermediate (66 cm) and near vision (33 cm) were also found. In the first part of the simulations, this reference Z20 value was found once for each eye, for κ = 0. In the second part this reference value was different for every κ. This step was performed to simulate a perfect calculation of the power of the MIOL and, again, to isolate the effect of the bifocal design from other factors.
Statistical analysisThe differences in IQ were compared using a one-way analysis of variance (ANOVA). Homogeneity of variance within groups was preliminarily tested by Levene statistics. A p-value less or equal than 0.05, corresponding to a significance level greater than 95% was considered significant. All of the statistical analyses were performed using SPSS software (version 13.0; SPSS, Inc., Chicago, IL).
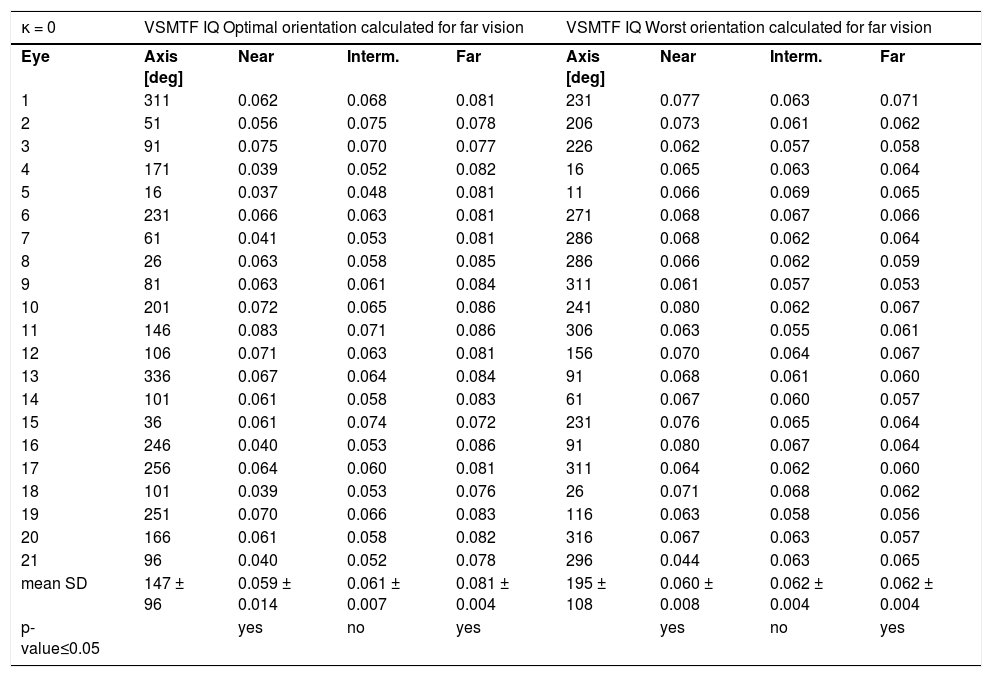
ResultsOptimal MIOL orientation with κ = 0In the ideal condition of κ = 0, the optimal intraocular orientation of the MIOL calculated for far vision varied for the 21 eyes (See Table 1). The differences between the metric values for the optimal and worst orientations for far and near vision were statistically significant (p-value ≤ 0.05). For intermediate vision, there were no statistically significance difference between best and worst orientations.
Image quality (IQ) evaluated using the VSMTF metric for kappa angle (κ) = 0 and for the best and worst intraocular orientations of the asymmetric multifocal intraocular lens calculated for far vision.
| κ = 0 | VSMTF IQ Optimal orientation calculated for far vision | VSMTF IQ Worst orientation calculated for far vision | ||||||
|---|---|---|---|---|---|---|---|---|
| Eye | Axis [deg] | Near | Interm. | Far | Axis [deg] | Near | Interm. | Far |
| 1 | 311 | 0.062 | 0.068 | 0.081 | 231 | 0.077 | 0.063 | 0.071 |
| 2 | 51 | 0.056 | 0.075 | 0.078 | 206 | 0.073 | 0.061 | 0.062 |
| 3 | 91 | 0.075 | 0.070 | 0.077 | 226 | 0.062 | 0.057 | 0.058 |
| 4 | 171 | 0.039 | 0.052 | 0.082 | 16 | 0.065 | 0.063 | 0.064 |
| 5 | 16 | 0.037 | 0.048 | 0.081 | 11 | 0.066 | 0.069 | 0.065 |
| 6 | 231 | 0.066 | 0.063 | 0.081 | 271 | 0.068 | 0.067 | 0.066 |
| 7 | 61 | 0.041 | 0.053 | 0.081 | 286 | 0.068 | 0.062 | 0.064 |
| 8 | 26 | 0.063 | 0.058 | 0.085 | 286 | 0.066 | 0.062 | 0.059 |
| 9 | 81 | 0.063 | 0.061 | 0.084 | 311 | 0.061 | 0.057 | 0.053 |
| 10 | 201 | 0.072 | 0.065 | 0.086 | 241 | 0.080 | 0.062 | 0.067 |
| 11 | 146 | 0.083 | 0.071 | 0.086 | 306 | 0.063 | 0.055 | 0.061 |
| 12 | 106 | 0.071 | 0.063 | 0.081 | 156 | 0.070 | 0.064 | 0.067 |
| 13 | 336 | 0.067 | 0.064 | 0.084 | 91 | 0.068 | 0.061 | 0.060 |
| 14 | 101 | 0.061 | 0.058 | 0.083 | 61 | 0.067 | 0.060 | 0.057 |
| 15 | 36 | 0.061 | 0.074 | 0.072 | 231 | 0.076 | 0.065 | 0.064 |
| 16 | 246 | 0.040 | 0.053 | 0.086 | 91 | 0.080 | 0.067 | 0.064 |
| 17 | 256 | 0.064 | 0.060 | 0.081 | 311 | 0.064 | 0.062 | 0.060 |
| 18 | 101 | 0.039 | 0.053 | 0.076 | 26 | 0.071 | 0.068 | 0.062 |
| 19 | 251 | 0.070 | 0.066 | 0.083 | 116 | 0.063 | 0.058 | 0.056 |
| 20 | 166 | 0.061 | 0.058 | 0.082 | 316 | 0.067 | 0.063 | 0.057 |
| 21 | 96 | 0.040 | 0.052 | 0.078 | 296 | 0.044 | 0.063 | 0.065 |
| mean SD | 147 ± 96 | 0.059 ± 0.014 | 0.061 ± 0.007 | 0.081 ± 0.004 | 195 ± 108 | 0.060 ± 0.008 | 0.062 ± 0.004 | 0.062 ± 0.004 |
| p-value≤0.05 | yes | no | yes | yes | no | yes | ||
The values of the IQ for near, intermediate and far distances and for each κ are presented in Fig. 4, where both methods of MIOL centration are compared. In all cases the orientation of the MIOL was the optimal one found for κ = 0 and far vision, and the reference Z20 defocus value was also the best one found for κ = 0 and far vision for each eye. All values of IQ were normalized to their corresponding best ones for that condition. There were no statistically significant differences between the IQ values between both centration methods for any of the distances (p-value >0.05) at κ = 0. For far vision, comparing the IQ metric values for different κ with respect to the value at κ = 0, there was a statistically significant decrease (p-value ≤0.05) for both methods and all κ. Also, there was a statistically significant decrease for near vision, and Method 1 κ = 150 and 300 μm.
 centration. The values for each eye were normalized with respect to the values corresponding to κ = 0. The MIOL orientation was the same as the best orientation found for κ = 0 and far vision (Table 1). Method 1 - MIOL centered at the geometrical center of the pupil, Method 2 - MIOL centered at the corneal apex. Numbers indicate the p-value. An asterisk (*) indicates statistical significance of a method with respect to κ = 0 condition of the same method, with p-value ≤0.05. There were no significant differences between both methods. Kappa angle is expressed in microns as a Cartesian distance, however, if desired, it can be translated to degrees using the relation 13° ≈ 1 mm.26")
Mean VSMTF metric for different κ and two methods of asymmetric multifocal intraocular lens (MIOL) centration. The values for each eye were normalized with respect to the values corresponding to κ = 0. The MIOL orientation was the same as the best orientation found for κ = 0 and far vision (Table 1). Method 1 - MIOL centered at the geometrical center of the pupil, Method 2 - MIOL centered at the corneal apex. Numbers indicate the p-value. An asterisk (*) indicates statistical significance of a method with respect to κ = 0 condition of the same method, with p-value ≤0.05. There were no significant differences between both methods. Kappa angle is expressed in microns as a Cartesian distance, however, if desired, it can be translated to degrees using the relation 13° ≈ 1 mm.26
Fig. 5 represents the same experiment than Fig. 4 except in this case the intraocular orientation was re-calculated taking into account the value of κ. There were no statistically significant differences between the IQ values between both centration methods for any of the distances in this case (p-value >0.05).
 centration. The values for each eye were normalized with respect to the values corresponding to κ = 0. The MIOL orientation was calculated for each κ value and far vision. Method 1 - MIOL centered at the geometrical center of the pupil, Method 2 - MIOL centered at the corneal apex. Numbers indicate the p-value. An asterisk (*) indicates statistical significance of a method with respect to κ = 0 condition of the same method, with p-value ≤0.05. There were no significative differences between both methods. Kappa angle is expressed in microns as a Cartesian distance, however, if desired, it can be translated to degrees using the relation 13° ≈ 1 mm26.")
Mean VSMTF metric for different κ and two methods of asymmetric multifocal intraocular lens (MIOL) centration. The values for each eye were normalized with respect to the values corresponding to κ = 0. The MIOL orientation was calculated for each κ value and far vision. Method 1 - MIOL centered at the geometrical center of the pupil, Method 2 - MIOL centered at the corneal apex. Numbers indicate the p-value. An asterisk (*) indicates statistical significance of a method with respect to κ = 0 condition of the same method, with p-value ≤0.05. There were no significative differences between both methods. Kappa angle is expressed in microns as a Cartesian distance, however, if desired, it can be translated to degrees using the relation 13° ≈ 1 mm26.
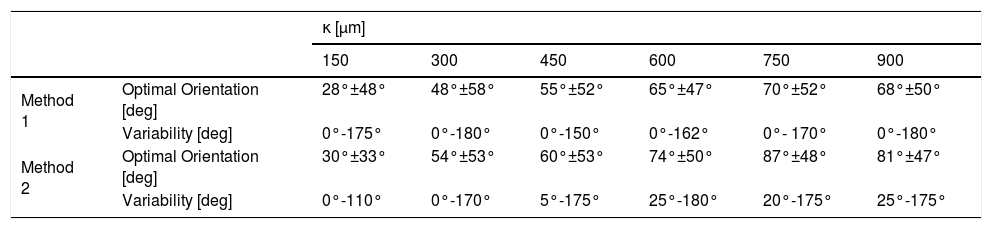
The optimal orientation of the MIOL varied with κ for each eye. Table 2 shows the optimal orientation along its range of variability (standard deviation for all eyes) of optimal MIOL orientation with respect to the average optimal orientation found for κ = 0 and far vision. The Z20 defocus coefficient that maximized the far vision IQ was found for each combination of eye, orientation and κ.
The range of variability (standard deviation for all eyes) in degrees of optimal asymmetric multifocal intraocular lens orientation with respect to the average optimal orientation found for kappa angle (κ) = 0.
| κ [μm] | |||||||
|---|---|---|---|---|---|---|---|
| 150 | 300 | 450 | 600 | 750 | 900 | ||
| Method 1 | Optimal Orientation [deg] | 28°±48° | 48°±58° | 55°±52° | 65°±47° | 70°±52° | 68°±50° |
| Variability [deg] | 0°-175° | 0°-180° | 0°-150° | 0°-162° | 0°- 170° | 0°-180° | |
| Method 2 | Optimal Orientation [deg] | 30°±33° | 54°±53° | 60°±53° | 74°±50° | 87°±48° | 81°±47° |
| Variability [deg] | 0°-110° | 0°-170° | 5°-175° | 25°-180° | 20°-175° | 25°-175° | |
There is growing evidence to support the hypothesis that it is important to take the optimal MIOL orientation into account during implantation, which is individual for each patient.17,19,23 The present study by computational simulations has reinforced this hypothesis by finding statistically significant differences in IQ depending on the intraocular orientation as shown in Table 1.
In a hypothetical situation where the calculations of the optimal orientation of implantation was calculated without taking into account the presence of a kappa angle ≠ 0, results indicate that far-vision IQ was affected negatively (Fig. 4), p ≤ 0.05. The larger the κ, the higher the negative impact on the metric value, which ranged from 5% (for 150 μm) to 18% (for 900 μm) drop in IQ with respect to κ = 0. No statistically significant differences were found for near and intermediate vision, except for two isolate point of significance in near vision, seen in Fig. 4. In general, the data suffered from large inter-subject variability; in some subjects the metric value rapidly decreased with the increase of kappa angle, while in others it increased. This can be attributed to inter-subject difference of corneal aberrations, and it is in agreement with the results of Prakash et al,4 who found a statistically significant relation between κ and photic phenomena, and noted that many patients with high κ were asymptomatic.
However, this general deterioration of IQ could be reversed when calculations of optimal intraocular orientation were made including the value of κ, as can be seen in Fig. 5. This new optimal axis of orientation of the MIOL varied significantly, on average, for each kappa angle (p-value ≤0.05). The standard deviation was high, existing eyes where the optimal axis barely varied while in others eyes it varied greatly.
Regarding the place of implantation, when the kappa angle was not taken into account in the calculations there were statistically better results centering the IOL in the corneal apex, as showed in Fig. 4. Clearly, this is because in this case the relative orientation of the MIOL with respect the cornea (the most aberrated component if we do not take into account the multifocality) is respected for any value of K. On the contrary, if the optimal implantation axis was calculated taking into account the kappa angle, there were no differences in the IQ between both methods (Fig. 5). In this case, the surgeon has to decide whether it is preferable to maintain the energy balance between both foci according to the original design (centering on the center of the pupil), or prefers to minimize possible measurement errors (centering on the corneal apex). It is important to highlight that we believe that these conclusions cannot be extended beyond this specific asymmetric multifocal lens model.
Our results reinforce the hypothesis that the implantation of an asymmetric MIOL it should not be based on general recommendations and a customized intraocular axis should be calculated in each patient in order to maximize the visual results. Addressing the practical issue of finding such an axis, these type of calculations are very simple to be performed, taking into account that the propagation between the cornea and the lens can be disregarded as commented in the results section.
Nevertheless, on average, the maximum IQ drop of 18% indicates the robustness of assymetric MIOL designs, and explains good implantation outcomes achieved with these MIOLs.4,14,16,33
Our study has some limitations. A simplified theoretical MIOL power profile does not exactly correspond to the profile of a real bifocal MIOL, but it is sufficient for estimating qualitative changes in visual quality metrics and it has been used before.18,19,23 Also, real asymmetrical MIOLs are designed to provide better far focus compared with the near focus, 34 which contrast with the results of our simulated MIOL that provides even a slightly better Strehl Ratio in the near focus, as can be seen in Fig. 2. Additionally, the considered diameter for the MIOL is bigger than the one of real IOLs in most of the cases. Finally, when we obtained the corneal aberrations of patients, we did not take into account the natural kappa angle present in each of them, supposing that it is equal to zero in all cases. Consequently, our methodology is very simplified, trying to isolate the effect of bifocal design, and at the same time gaining in readability. Another controversial point in the study is the decision to have eliminated astigmatism from the simulations. It has been shown in other works that in the presence of low-grade natural astigmatism, there is still an axis of preference in these types of IOLs with asymmetric designs.18,19 It could be thought that it is reasonable for this to happen since astigmatism is a strongly asymmetric aberration. We have eliminated astigmatism from our study because this specific aberration can be corrected by other methods, surgical or not, and also we have tried to assess whether the effect of IOL decentration is important even when astigmatism is not present. According to this, we have demonstrated that in the presence of asymmetric aberrations, taking the kappa angle into account is important. However, it is noteworthy that we have not tested this hypothesis in the specific case of residual astigmatism, but we speculated that the behaviour should be similar.
Despite the limitations of the present work, we think that the results of our study show qualitative and valid results for implantation of asymmetrical MIOL in the presence of angle kappa. In general, a model of bifocal MIOL should be robust in the presence of kappa angles. However, the inter-variability between subjects is very high and, according to our results, some patients could have a suboptimal result. This can help to find a possible explanation for the contradiction why some patients with a higher angle kappa are asymptomatic while others complain of disturbing photic phenomena.
ConclusionsThere exist scientifically evidences in the bibliography supporting that outcomes of intraocular lenses with an asymmetrical design can be maximized if the implantation is made in a personalized intraocular axis calculated based on corneal aberrations. Our results indicate that kappa angle could have an important role in this calculations and it should be taken into account when the optimal intraocular orientation is calculated.
FundingThis research did not receive any specific grant from funding agencies in the public, commercial, or not-for-profit sectors.
Conflict of interestNone of the authors had conflict of interest in this work.


