


To assess differences in a new objective metric obtained with a double-pass technique between a group with accommodation insufficiency (AI) and a control group and to explore the diagnostic capabilities of this new tool in comparison to conventional procedures.
MethodsRetrospective cross-sectional case-control phase 1 study. Two groups with ages ranging from 8 to 18 years were recruited: AI and control group. The diagnostic criterion of AI was based on monocular accommodative amplitude (AA), 2 D below Hofstetter’s calculation for minimum AA, and monocular accommodative facility (MAF), failing with minus lens and cut-off at ≤ 6 cycles per minute. Accommodative response with a double pass device (HD Analyzer, Visiometrics) was measured, performing an evaluation from +1.00 D to −3.50D (−0.5D steps), offering the width of the profile at 50% (WP) in minutes of arc.
ResultsDifferences were found between groups for the AA, MAF and MEM retinoscopy (p < 0.0001, p < 0.001, p = 0.037). The discriminative capacity of MEM retinoscopy for AI diagnosis was significant and the cut-off that maximized the sensitivity and specificity was > 0.5 D. Considering WP 50% in different points, the discriminative AI diagnosis capacities for the points of 2.0 D and 2.50 D were significant (ROC-AUC 0.78; p = 0.03 and p = 0.02).
ConclusionsDouble-pass system metric differed between patients with AI and control group, therefore the aim of a Phase I study was achieved. Further steps with higher sample sizes are required to evidence if the system really provides any advantage versus conventional methods in the diagnosis of AI.
Accommodation refers to the change in the dioptric power of the eye. Thus, the light comes focused on the retina from different distances from far to near due to changes in the shape of the crystalline lens.1 Measurement of accommodative function is mandatory for the management of presbyopia, the physiological loss of amplitude of accommodation with age2 in addition to the evaluation of non-presbyopic population with some accommodative dysfunctions such as Accommodative Insufficiency (AI).3
AI is a type of dysfunction in which the amplitude of accommodation (AA) is less than the age-expected value in non-presbyopic eyes.4 AI leads to several symptoms such as blurred vision, diplopia, visual fatigue or asthenopia, headache, difficulty to change the focus from distance to near vision, loss of concentration and understanding associated with near activities, such as reading.5–7 Therefore, AI can interfere with academic and educational learning, which is especially important in children and school-age students.8
There is a great variability regarding the prevalence of AI in children. As reported in various studies, prevalence rates can range from 2.0%9 to 61.7%,10 depending on the studied population and diagnostic criteria.11 In fact, the prevalence of cases of AI within the same clinical population varies with the clinical diagnostic criteria selected.6,12–14 Although there is not a single criterion for the detection of AI, according to the literature, the push-up monocular accommodative amplitude at least 2D below Hofstetter´s formula [15-(0.25xage)] and failing with the minus flip lens (-2.00 D) in monocular accommodative facility (MAF) seem to be the signs most used for diagnosing AI.13 Clinically, AA has usually been measured for more than a century with the conventional push-up method,15 based on increasing the accommodative demand, moving the test chart towards the patient’s eyes until it begins to blur. However, several studies have shown that subjective techniques generally overestimate the measured AA in comparison with objective techniques due to the depth-of-field of the eye, and many factors that can add errors when taking measurement (ie. pupil size,..).16–18
Although most of the methods used for the measurement of AA in clinical practice are subjective (push-up, push-away, minus lens) or partly objective requiring the clinician’s interpretation (monocular estimate method, MEM, retinoscopy), some objective techniques have been reported in the literature to measure the accommodative response.19–26 One of this is the double-pass technique, based on recording images of a point-source object after reflection on the retina and a double pass through the ocular media,25 which has been widely used in daily clinical practice to assess retinal image quality in patients with different eye conditions, and lately has been also applied to the study of accommodation with two investigations which suggest the suitability of the double-pass system to measure accommodation response on healthy adults.25,26
The main aim of this Phase I study was to assess differences in a new objective metric obtained with a double-pass technique between a group with accommodation insufficiency (AI) and a control group. A secondary aim was to explore the diagnostic capabilities of this new tool in comparison to conventional procedures
Material and methodsSubjectsThis prospective case-control phase 1 study was conducted at Miranza Clinic Madrid. They were subjects who came to the clinic for the exploration of any kind of functional problem including from blurred vision up to the presence of symptoms associated to daily tasks for which an extended accommodative and binocular evaluation was required. All patients provided written informed consent. The study was approved by the local ethics committee, and it was performed in accordance with the Declaration of Helsinki.
Inclusion criteria were patients with corrected distance visual acuity (CDVA) of 20/20 or better, spherical refractive error ranging from +5 D to −8 D, cylinder refractive error <1.50 D and age ranging from 8 to 18 years. Exclusion criteria included history of ocular disease (eg, uveitis, amblyopia, glaucoma, strabismus), active ocular allergy, refractive surgery, systemic medication known to affect tear film production, any acute or chronic condition or the presence of pupil abnormalities, any binocular or accommodative dysfunction beyond AI and abnormal fundus. Subjects were divided into two groups: AI and control group. For AI diagnosis the following criteria was followed: monocular accommodative amplitude (AA) 2 D diopters below Hofstetter’s calculation for minimum amplitude [15-(0.25×age)]27 and monocular accommodative facility (MAF) failing with minus lens and cut-off at ≤6 cycles per minute (cpm).3,28,29
Visual examination sequenceAll subjects had a previous comprehensive ophthalmic examination including: clinical history, uncorrected distance visual acuity (UDVA), corrected distance visual acuity (CDVA), corrected distance near visual acuity (CDNVA), subjective and cycloplegic refraction, slit-lamp examination of the anterior segment and funduscopy.
Mesopic pupil diameter was measured by OPD-Scan III (Nidek Co., Ltd.). A complete binocular vision and accommodative evaluation was performed with full subjective refraction by the same optometrist (EL). Monocular AA was tested using the push-up method performing with two lines lower than DCNVA30 with ETDRS near visual acuity chart 2000 (Precision Vision, Inc., Woodstock, IL). Monocular accommodative facility (MAF) was conducted following the procedure of Zellers et al.31 at 40 cm using ± 2.00 D flip lenses. Accommodative lag was measured by monocular estimate method (MEM) retinoscopy. MEM retinoscopy was performed under moderate room illumination with the patient seated 33 cm from the retinoscope with the Welch Allyn fixation card attached to the head of the retinoscope.32,33
Optical quality analysis system – high definition analyzerThe HD Analyzer™ (Visiometrics S.L., Terrasa, Spain) is based on the double-pass method and provides an objective clinical evaluation of the eye’s optical quality through the Point Spread Function (PSF) measurement. The HD Analyzer™ software shows the retinal image intensity distribution profile and calculates and registers the value of the width of the profile at 50% (WP) in minutes of arc. With these values the clinician can obtain information about the size of the image profile. The higher value, the worse quality of vision (Fig. 1).
 in minutes of arc (3.02 min of arc in the image) is the metric of optical quality used in the current pilot and phase I study. The higher value, the worse quality of vision.")
The right side of the image shows the retinal image intensity distribution profile that provides the HD Analyzer™ software. The profile width values are displayed at 50% and 10% of their maximum. The value of the width of the profile at 50% (WP) in minutes of arc (3.02 min of arc in the image) is the metric of optical quality used in the current pilot and phase I study. The higher value, the worse quality of vision.
Patients were tested with the double-pass system after comprehensive ophthalmic examination and complete binocular vision and accommodative evaluation under non cycloplegic condition.
The HD Analyzer™ has a software function named “Pseudoaccommodation”. Previously starting this software function, the subject’s spherical refractive error was automatically corrected by the Badal system and patient’s astigmatism >0.50 D was corrected by means of trial lenses placed in the front part. Measurement process of accommodative range is based on a sweep of four diopters [from +1D to −3D] around the selected value, usually of the best spherical correction. The device makes an evaluation in −0.5D steps taking double-pass images in each position until reach the final position and register retinal image intensity distribution profiles and offer the WP (optical quality) value at each accommodative vergence, expressed in minutes of arc (Fig. 2). For each different accommodation states an image of the stimulus was acquired when the change of vergence was compensated by the Badal system.
 in minutes of arc (2.30 min of arc for 0.0 D, 5.54 min of arc for 0.5 D,…31.34 min of arc for 2.5 D). In the bottom image, a simulation of how the image projected onto the retina of an optotype (Snellen letter E) is shown.")
Example of the 0.00 D, 0.5 D, 1.0 D, 1.5 D, 2.0 D and 2.5 D double-pass images recorded during the sequence of measurement of accommodative response in an AI subject. For each point tested a double image is represented. Although the entire PSF is not observed in the 2.5 D image, that is only a representation. If that error would occur, many of the measurements obtained would be similar if a limit would have been established. In the upper left part of the upper image, a number is shown that corresponds to the value, in minutes of arc, of the width of the profile at 50% (WP) in minutes of arc (2.30 min of arc for 0.0 D, 5.54 min of arc for 0.5 D,…31.34 min of arc for 2.5 D). In the bottom image, a simulation of how the image projected onto the retina of an optotype (Snellen letter E) is shown.
Measurements were taken under mesopic conditions (3–3.5 lux) measured by a photometer (Gossen Starlite II Foto- und Lichtmesstechnik GmbH, Nürnberg) and the recording of accommodative response started after a 5-minute period of adaptation to the dark. Subjects were seated at the device with their head stabilized in the instrument’s chin rest and forehead strap. Before start the recording, patients were asked to blink few times and to keep the target focused. Once the measurement of accommodation started the latter request was reinforced through all the process. The patient was instructed to try to focus the visual target (landscape with a house) that appeared inside the instrument. The measurement was performed with a 5 mm artificial pupil included in the device in non-cycloplegic conditions.
Statistical analysisDespite both eyes were measured, only right eyes were included in the statistical analysis. The normality of data distributions for the variables included in the study was tested with the Saphiro-Wilk test. Descriptive statistics are detailed in the results section as mean ± standard deviation. Differences between groups (AI vs control) were tested with the t-test for independent samples and the Receiver Operating Characteristic (ROC) curves were computed considering AI diagnosis as the state variable (AA < 2 D normative by age and MAF failing with minus lens and cut-off at ≤ 6 cpm). The Youden index was calculated for determining the diagnostic cut-off values for all the variables involved in the diagnosis of the AI.34 The area under the curves (AUC) for the WP (From 0 to −2.50 D) was computed with the trapz function of MATLAB (R2018Ba; MathWorks, Natick, MA) after subtracting at each point the WP at the 0 D location (WPx-WP0). SPSS software (version 24; SPSS Inc., Chicago, IL) was used for the statistical analysis.
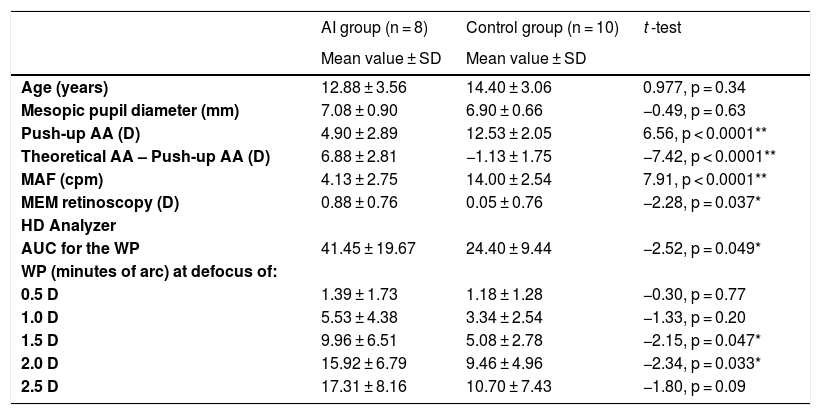
ResultsEighteen subjects (7 men and 11 women) were recruited. Eight of them met the inclusion criteria of IA group and 10 were included in the control group. Table 1 shows that no differences in age or mesopic pupil diameter were found between groups (p > 0.05). The mesopic pupil size was ranging from 5.65 to 8.43 mm in such a way the pupil was higher than the artificial 5 mm pupil used during the WP measurement in all the cases. Differences were found between groups for the AA, MAF and MEM retinoscopy (p < 0.05) (Table 1).
Descriptive statistics and comparative analysis results from AI group and control group.
| AI group (n = 8) | Control group (n = 10) | t -test | |
|---|---|---|---|
| Mean value ± SD | Mean value ± SD | ||
| Age (years) | 12.88 ± 3.56 | 14.40 ± 3.06 | 0.977, p = 0.34 |
| Mesopic pupil diameter (mm) | 7.08 ± 0.90 | 6.90 ± 0.66 | −0.49, p = 0.63 |
| Push-up AA (D) | 4.90 ± 2.89 | 12.53 ± 2.05 | 6.56, p < 0.0001** |
| Theoretical AA – Push-up AA (D) | 6.88 ± 2.81 | −1.13 ± 1.75 | −7.42, p < 0.0001** |
| MAF (cpm) | 4.13 ± 2.75 | 14.00 ± 2.54 | 7.91, p < 0.0001** |
| MEM retinoscopy (D) | 0.88 ± 0.76 | 0.05 ± 0.76 | −2.28, p = 0.037* |
| HD Analyzer | |||
| AUC for the WP | 41.45 ± 19.67 | 24.40 ± 9.44 | −2.52, p = 0.049* |
| WP (minutes of arc) at defocus of: | |||
| 0.5 D | 1.39 ± 1.73 | 1.18 ± 1.28 | −0.30, p = 0.77 |
| 1.0 D | 5.53 ± 4.38 | 3.34 ± 2.54 | −1.33, p = 0.20 |
| 1.5 D | 9.96 ± 6.51 | 5.08 ± 2.78 | −2.15, p = 0.047* |
| 2.0 D | 15.92 ± 6.79 | 9.46 ± 4.96 | −2.34, p = 0.033* |
| 2.5 D | 17.31 ± 8.16 | 10.70 ± 7.43 | −1.80, p = 0.09 |
AI: Accommodative Insufficiency; AA: accommodative amplitude; Theoretical AA: Hofstetter’s minimum value [15-(0.25×age)]; MAF: monocular accommodative facility; cpm: cycles per minute; MEM: monocular estimate method; AUC for the WP: area under the through focus width profile measurement of HD Analyzer; WP: width of the profile at 50%.
Regarding HD Analyzer, despite the device measured the range from +1.00 D to −3.50 D only the range from 0 to −2.50 D was finally included in the analysis because the device could not obtain a numeric value in 4 eyes in the −3.00 D defocus and in 11 eyes in the −3.50 D defocus. The Fig. 2 shows the WP for each one of the defocus lens tested, obtaining significant differences for the points of −1.50 D and −2.00 D. The AUC for the WP was also significantly different between groups (Table 1).
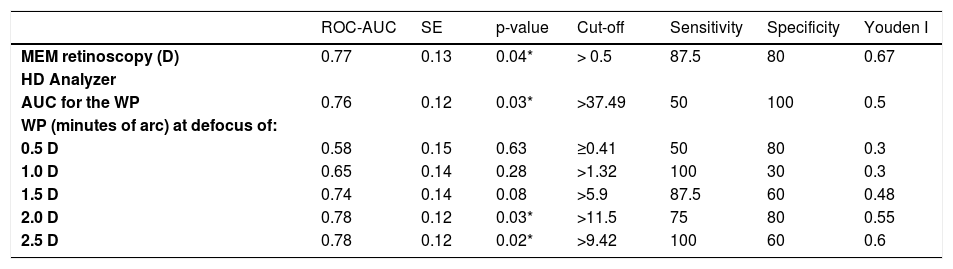
The diagnostic performance for MEM retinoscopy, AUC for the WP and WP values for each one of the defocus lens tested was determined and data were summarized for area under the ROC curve (ROC-AUC), standard error of the ROC-AUC, cut-off value, sensitivity, specificity and Youden index in Table 2. The discriminative capacity of MEM retinoscopy for AI diagnosis was significant (ROC-AUC 0.77; P < 0.05) and the cut-off that maximized the sensitivity and specificity was > 0.5 D. For the consideration of a singular defocus point in the measurement of the WP, instead of the integration of all with the AUC for the WP, the points with highest Youden indices were the 2.0 D and 2.5 D defocus locations. The discriminative AI diagnosis capacities of WP for the points of 2.0 D and 2.50 D were significant (ROC-AUC 0.78; P < 0.05) (Table 2) (Fig. 3).
Receiver operating characteristic (ROC) analysis for the diagnosis of accommodation insufficiency.
| ROC-AUC | SE | p-value | Cut-off | Sensitivity | Specificity | Youden I | |
|---|---|---|---|---|---|---|---|
| MEM retinoscopy (D) | 0.77 | 0.13 | 0.04* | > 0.5 | 87.5 | 80 | 0.67 |
| HD Analyzer | |||||||
| AUC for the WP | 0.76 | 0.12 | 0.03* | >37.49 | 50 | 100 | 0.5 |
| WP (minutes of arc) at defocus of: | |||||||
| 0.5 D | 0.58 | 0.15 | 0.63 | ≥0.41 | 50 | 80 | 0.3 |
| 1.0 D | 0.65 | 0.14 | 0.28 | >1.32 | 100 | 30 | 0.3 |
| 1.5 D | 0.74 | 0.14 | 0.08 | >5.9 | 87.5 | 60 | 0.48 |
| 2.0 D | 0.78 | 0.12 | 0.03* | >11.5 | 75 | 80 | 0.55 |
| 2.5 D | 0.78 | 0.12 | 0.02* | >9.42 | 100 | 60 | 0.6 |
MEM: monocular estimate method; AUC for the WP: area under the with profile measurement of HD Analyzer; WP: width of the profile at 50% ; ROC-AUC: Area under the ROC curve; SE: standard error of the ROC-AUC; Cut-off: value that maximize the sensitivity and specificity computed through the Youden index.
 for the AI group (dashed line) and control group (continuous line). Ordinate axis represented the difference of WP at the 0 D location (WP0) between each point (WPx). The figure shows significant differences between groups (AI vs control) for the points of −1.50 D and −2.00 D. *p < 0.05.")
Representation the WP for each point of the defocus lens tested (0.0 D, 0.5 D, 1.0 D, 1.5 D, 2.0 D and 2.5 D) for the AI group (dashed line) and control group (continuous line). Ordinate axis represented the difference of WP at the 0 D location (WP0) between each point (WPx). The figure shows significant differences between groups (AI vs control) for the points of −1.50 D and −2.00 D. *p < 0.05.
Subjective methods to measure accommodation functions are based in the ability of the accommodative system to detect blur, but it is mandatory the active participation of the subjects in order to keep attention in the target to detect and inform about blur. Objective methods have the advantage to not depend so stronger on the subject's response, even more in the children population. Diagnostic studies are mandatory in order to evidence the most useful procedures, that alone or in combination with others, can help to the clinician in the detection of anomalies. The Phase I of diagnostic studies involves the inclusion of equal size low sample groups in a cross-sectional case-control design to evaluate whether the test discriminates between patients who clearly have the anomaly.35 Therefore, the main aim of this Phase I study was to evaluate if the HD Analyzer could differentiate subjects with AI from a control group.
In the current study, we proposed for AI diagnosis criterion the subjective push-up monocular AA 2 D below Hofstetter’s calculation for minimum amplitude and MAF failing with minus lens with cut-off at ≤ 6 cpm. Despite nowadays there is no common clinical diagnostic criterion for the detection of AI all of them incorporate the push-up monocular accommodative amplitude at least 2 D below Hofstetter’s calculation for minimum amplitude.3,4,12,28,29,36–39
Regarding measuring AA, various studies showed that the subjective push-up monocular AA method overestimated the objective AA,16,19,22 particularly in young children.19 Therefore, there are several distinct sources of error that affect the measure: eye’s depth-of-field, target size, illumination, end-point criteria, proximal cues, subject variability affect the outcome of the AA measurement and pupil size.16–18 Our sample did not show differences in mesopic pupil diameter between groups and also the mesopic pupil size was ranging from 5.65 to 8.43 mm in such a way the pupil was higher than the artificial 5 mm pupil used during the WP measurement in all the cases.
Nowadays, the subjective push-up test is the method most routinely used to measure accommodative amplitude but it is inadequate for demonstrating true accommodative amplitude. Wold et al. suggested that objective measures of accommodation should be used to determine whether accommodation can be restored in presbyopia in case of scleral-expansion surgical procedures or replacement of the cataractous crystalline lens with so-called accommodating intraocular lenses.16 On the other hand, in the case of non-presbyopic subjects, specific children, our target population, Anderson et al. reported relatively stable amplitude does not begin to decline rapidly until the third decade of life.40 Therefore, the AA-age relation was not a bias in the current study, even observing that there weren't differences in age between groups.
It is well know that objective techniques are more accurate to determine the accommodative ability16,19 and several methods have been reported in the literature based on autorefractometry, aberrometers and double pass technologies.19–26,41 In fact, global image quality-based measurements seem more appropriate than techniques based just on defocus measurements in order to control spherical aberration (major contributor to higher-order aberrations with the accommodation).42 However, as far as we know, there are not researches that use objective methods to study the accommodative response in non-presbyopic subjects with AI. So, to the best of our knowledge, this is the first study to analyzed the accommodative response using an objective technique based on an optical quality metric using double-pass system: the width of the retinal image intensity distribution profile at 50% (WP) in minutes of arc (Fig. 1).
The double-pass technique, based on recording images of a point-source object after reflection on the retina and a double pass through the ocular media25 has been widely used in daily clinical practice to assess retinal image quality in patients with different eye conditions, and lately has been also applied to the study of accommodation with two investigations which suggest the suitability of the double-pass system to measure accommodation response on healthy adults.25,26
The metric of optical quality used in the current pilot and phase I study was based on the retinal image intensity distribution profile and the value of the width of the profile at 50% (WP) in minutes of arc was the study variable. Instead, other authors used the volume under the Modulation Transfer Function.26
The WP was analyzed for 0 D, 0.5 D, 1.0 D, 1.5 D, 2.0 D and 2.5 D and the ROC-AUC calculated for these defocus locations was higher for the AI group than for the control group. However, the differences were not significant between groups for defocus locations ≤1.5 D. (Fig. 2) (Table 1) The diagnostic performance based on ROC analysis for these significant variables (AUC for the WP and WP values from 1.50 D defocus lens tested) was significant for AUC for the WP and for WP value from 2.0 D. (Table 2) In order to establish a diagnostic value based on WP, we suggest choosing the singular defocus point in the measurement of the WP, specifically from 2.00 D, instead of the integration of all defocus point with the AUC for the WP. Therefore, the current phase one study would suggested the WP for 2.0 D defocus point as a possible clinical sign of AI, setting the cutoff point at 11.5 min of arc. (Table 2)
Moreover other authors have reported changes from other distances, such as the case of Chase et al.20 and Franco et al.,23 although they did not used double-pass system. Chase et al.20 used an open-field autorefractor, Grand Seiko autorefractor (WAM-5500), to measure the stimulus-response functions objectively in college students (mean age 20 years old), with and without near work induced discomfort symptoms as the AI criterion diagnosis. They reported significant correlations at viewing distances of 4D or closer. Instead, the device and the AI diagnostic criterion were different that ours. On the other hand, Franco et al.23 reported change in accommodation functions measured by Hartmann-Shack aberrometer, based on retinal image. They concluded that measurement of wavefront ocular aberrations can be a tool to diagnose accommodative disorders; however they reported only one case of a presbyopic subject while we studied young population.
Another objective technique to measure the accommodative response is MEM retinoscopy and some authors include it for AI criterion.29,40 The MEM retinoscopy was different between groups in the current study and the diagnostic performance based on ROC analysis was significant with a cut off higher than 0.50 D. Therefore, our result suggests that MEM retinoscopy could be a clinical sign to consider in the diagnosis of AI, setting the cut-off point at 0.50 D. Contrary, these results are not in accordance with those presented by Cacho et al.3 and they recommended use the standard deviation as the cutoff to maintain a high level of specificity.
It is relevance to reinforce that this technique is considered objective because it does not depend on the subject's response, but it depends on the examiner. Rouse et al. demonstrated its validity and established normative data32 in 0.75 D, however the mean differences between measurement found in a repeatability study were 0.23 ± 0.50 D.43 Consequently, despite the statistically significant results, it is not clinically relevant to consider a MEM value higher than 0.50 D as a clinical sign of AI when the measure itself has an error of the same value.
Although the main aim of a Phase I study was achieved detecting significant differences between groups, it is important to note that the device and the study have some limitations that should be taken into account for the development of the required future studies. Among device limitations, difficulties in the measurement can appear in some subjects such as subjects with abnormal fundus,44 myopia induction by the device might affect to the IA detection,45 the spatial frequency of the target used by the device might not allow participants to accurately perceive the blur and therefore modifying the accommodative response,46 and finally the diagnosis with the device intends to detect AI through the decrease in optical quality with the increase of accommodative demand which differs from the conventional method of measuring the accommodation amplitude. Although the system cannot reach in some cases the accommodative limit, a decrease in optical quality might appear inside the range measured by the device that might help to overcome this limitation detecting the AI through the area under the curve instead of in the depth of field measured range in diopters. However, this metric is not familiar for clinicians and needs of cut-off points specifically designed for this metric and purpose. Among study limitations, we explored the sensitivity, specificity and cut-off point for detection of the IA as a secondary aim. However, it is important to note that our study has not enough sample size to transfer these values to the clinical practice. To achieve reliable values for this secondary aim, further steps (Phase II, III and IV studies) are required increasing the sample size and including patients with different degrees of the dysfunction.35,47
ConclusionIn conclusion, the study passed the Phase I suggesting that it is therefore worthwhile developing next stages, that can provide reliable evidence about the sensitivity, specificity and cut-off points for IA detection. However, our pilot study does not provide sufficient evidence to conclude that the system really provides any advantage versus conventional methods in the diagnosis of AI. A Phase II study with a higher sample size is required to assess if patients with certain test results are more likely to have AI than patients with other test results.
Conflicts of interestThe authors have no conflicts of interest to declare.


