


To characterize the optical performance of two models of refractive bifocal intraocular lenses, with medium and high addition, using defocus curves.
Methods20 eyes from 20 subjects were included in this study. 10 eyes underwent caratact surgery with an implant of a medium addition refractive bifocal intraocular lens (IOL) (Lentis LS-313 MF20) and the other 10 eyes underwent cataract surgery with an implant of a high addition refractive bifocal IOL (Lentis LS-313 MF30). Six weeks after surgery, subjective refraction and defocus curve were made.
ResultsMean final residual refraction in spherical equivalent was +0.10±0.07D in the LS-313MF30 group and +0.12±0.10D in the LS-313MF20 group. Defocus curve showed a different optical performance in intermediate/near distance depending on the IOL model. The medium addition IOL provided good visual acuity (VA) at far and intermediate distance up to 50cms, and the high addition IOL provided better VA in near distance up to 25cms.
ConclusionsThe high addition intraocular lens provides better visual acuity in the spatial range from infinity to the point close to 25cm. The medium addition intraocular lens provides excellent visual acuity in far and intermediate vision.
The defocus curve seems to be a valid and reproducible tool for evaluating the optical behavior of multifocal sector refractive lenses.
Caracterizar el comportamiento óptico de dos modelos de lentes intraoculares bifocales refractivas, con adición media y alta, utilizando curvas de desenfoque.
MétodosSe incluyó en este estudio a 20 ojos de 20 sujetos: 10 ojos sometidos a cirugía de cataratas con implante de lentes intraoculares (LIO) bifocales refractivas con adición media (Lentis LS-313 MF20), y los 10 ojos restantes sometidos a cirugía de cataratas con implante de LIO bifocales refractivas de adición alta (Lentis LS-313 MF30). Transcurridas seis semanas de la cirugía, se realizó refracción subjetiva y curva de desenfoque.
ResultadosLa refracción residual final media en el equivalente esférico fue de+0,1±0,07 D en el grupo LS-313MF30, y de+0,12±0,1 D en el grupo LS-313MF20. La curva de desenfoque mostró un comportamiento óptico diferente en la distancia intermedia/de cerca, dependiendo del modelo de LIO. La LIO de adición media aportó buena agudeza visual (AV) en la distancia de lejos e intermedia, de hasta 50cm, y la LIO de adición alta aportó mejor AV en la distancia de cerca de hasta 25cm.
ConclusionesLas lentes intraoculares de adición alta aportan mejor agudeza visual en el rango espacial comprendido entre el infinito y el punto próximo a 25 centímetros. Las lentes intraoculares de adición media aportan una agudeza visual excelente en la visión de lejos e intermedia.
La curva de desenfoque parece ser una herramienta válida y reproducible para evaluar el comportamiento óptico de las lentes refractivas multifocales.
The use of multifocal intraocular lenses (IOL) to reduce reliance on optical corrections after cataract surgery is widely documented.1 The results obtained in visual acuity (VA) and objective and subjective visual quality2,3 are proven as well. However, given the different technologies and designs available, it is necessary to know them and choose the best multifocality design according to the patient's visual demands. The existence of bi or trifocal IOLs with various additions facilitates VA at different distances. Because of this, a personal interview between surgeon and patient is required during the preoperative process so they can assess the ideal solution for the compensation of presbyopia in each case. The eye care professional should know the different designs and features of the lenses in order to advise the patients and offer them the best optical solution, including the possibility of use a residual or occasional optical compensation. The optometrist must also know and apply techniques for assessing the general refractive state of the patient, depending on the implanted IOL or the refractive surgery technique used.
In this paper, the characterization of the visual results in the measurement of VA in patients implanted with high and medium addition bifocal IOLs is presented using a defocus curve.
Material and methodsPatients undergoing cataract surgery with a bifocal refractive intraocular lens were selected at “Instituto de Ciencias Visuales”, Hospital La Zarzuela, Madrid, Spain. Patients were informed of the study and informed consent was obtained following the guidelines of the Declaration of Helsinki. Patients were selected with the following inclusion criteria: no pathological ocular alterations or previous ophthalmological surgeries, topographic astigmatisms lower than 1.00D, and whose surgery had been carried out without incident in the intra and postoperative period and postoperative VA was better than 0.2LogMAR after subjective refraction.
Patients who have had corneal edema with a central pachymetry increase of more than 15% in the postoperative period were excluded.
Optical biometry was carried out using IOLMaster 700™ (Carl Zeiss Meditec, Jena, Germany) and the power of the intraocular lens was calculated using the Haigis formula and the IOL constants according optimized data from the User Group for Laser Interference Biometry – ULIB website (http://ocusoft.de/ulib/c1.htm) (a0=0.95; a1=0.40 and a2=0.1), always with the aim of looking for emmetropia. In the surgical act, a corneal incision was made on the steepest meridian according to the keratometry obtained in IOLMaster 700™, and ultrasonic phacoemulsification was performed with the Stellaris PC™ phacoemulsifier (Bausch & Lomb, Rochester, USA). Intraocular lenses Lentis MPlus LS-313 MF30™ or Lentis LS-313 MF20™ (Oculentis GmbH, Berlin, Germany) were implanted. This IOLs models, LS-313 MF30 and LS-313 MF20, have a rotationally asymmetric design with a sectorial-embedded near zone that splits the image into two focal planes according their addition. Both IOLS have the same design, being different exclusively according to the effective addition of each IOL. These IOLs, LS-313 MF30 and LS-313 MF20, have additions of +3.00D and+2.00D in the corneal plane, respectively, that allows patients to work at different distances according to their work distance priority: intermediate (medium addition) or near (high addition). The final decision of the IOL model to implant, and therefore their addition, was determined by the surgeon and the patient jointly, depending on the patient's work distance and their requirements.
Six weeks after surgery and coinciding with medical discharge, subjective refraction was performed to seek the maximum positive for maximum VA. The protocol was Canon RK-1™ autorefracto-keratometry (Canon Inc, Japan), retinoscopy, and adjustment of the cylinder with Jackson crossed cylinder technique. After that, a defocus curve was performed with the aid of the Multifocal Lens Analyzer application4 installed in an iPad Air, in the diopter range of +1.00 to −4.00D with intervals of 0.50D.5–7
Statistical analysis was performed using SPSS software (Version 21. IBM corp). Data distribution was checked for normality using the Kolmogorov–Smirnov Test. Paired t-test and Mann–Whitney test were used to analyze the differences between means and medians VA in each group according data distribution. p value lower than 0.05 was considered to be statistically significant.
ResultsWe included 10 eyes from 10 subjects with high-add bifocal IOLs implanted (Lentis LS-313 MF30) and 10 eyes from 10 subjects with medium addition bifocal IOLs implanted (Lentis LS-313 MF20).
The mean final residual refraction in spherical equivalent, six weeks after surgery, was +0.10±0.07D in the LS-313MF30 group and +0.12±0.10D in the LS-313MF20 group.
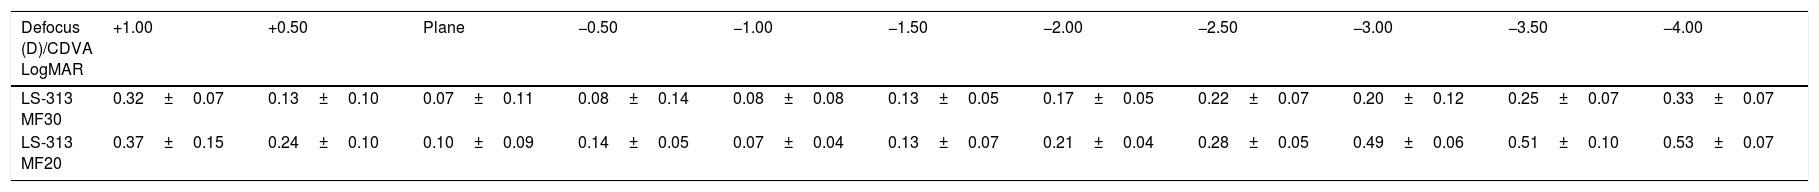
Table 1 shows LogMAR VA measurements in each step of the defocus curve with the corresponding standard deviations, and Fig. 1 graphically depicts the LogMAR VA measurements and defocusing curve in each group of patients.
Corrected distance visual acuity (CDVA) in LogMAR, in each of the steps of the defocus curve. Range +1.00 to −4.00D with intervals of 0.50D.
| Defocus (D)/CDVA LogMAR | +1.00 | +0.50 | Plane | −0.50 | −1.00 | −1.50 | −2.00 | −2.50 | −3.00 | −3.50 | −4.00 |
|---|---|---|---|---|---|---|---|---|---|---|---|
| LS-313 MF30 | 0.32±0.07 | 0.13±0.10 | 0.07±0.11 | 0.08±0.14 | 0.08±0.08 | 0.13±0.05 | 0.17±0.05 | 0.22±0.07 | 0.20±0.12 | 0.25±0.07 | 0.33±0.07 |
| LS-313 MF20 | 0.37±0.15 | 0.24±0.10 | 0.10±0.09 | 0.14±0.05 | 0.07±0.04 | 0.13±0.07 | 0.21±0.04 | 0.28±0.05 | 0.49±0.06 | 0.51±0.10 | 0.53±0.07 |
 and extended depth of focus – EDOF IOLs (LS-313 MF20 – orange line).")
Table 2 shows the relationship between median LogMAR VA and the defocus level according the IOL model. There was a statistical difference between mean of VA in the defocus levels of −3.00, −3.50 and −4.00D (p<0.05 in all cases).
Statistical analysis of the relationship between the median of visual acuity and the defocus level according to the intraocular lens model. The equality of medians was assessed with Mann–Whitney test.
| Mean difference | Mann–Whitney U | 95% CI | |
|---|---|---|---|
| +1.00 | −0.05±0.06 | 0.631 | −0.189 to 0.089 |
| +0.50 | −0.11±0.05 | 0.105 | −0.228 to 0.008 |
| Plane | −0.03±0.06 | 0.481 | −0.151 to 0.091 |
| −0.50 | −0.06±0.06 | 0.105 | −0.187 to 0.067 |
| −1.00 | 0.01±0.05 | 0.739 | −0.093 to 0.113 |
| −1.50 | 0.00±0.05 | 0.912 | −0.095 to −0.095 |
| −2.00 | −0.04±0.03 | 0.353 | −0.106 to 0.026 |
| −2.50 | −0.06±0.05 | 0.315 | −0.167 to 0.470 |
| −3.00 | −0.29±0.06 | <0.001* | −0.424 to −0.155 |
| −3.50 | −0.26±0.06 | 0.002* | −0.393 to −0126 |
| −4.00 | −0.20±0.05 | 0.001* | −0.299 to −0.100 |
CI=confidence interval of the difference between medians.
In order to correct presbyopia by implanting multifocal intraocular lens, the surgeon must previously decide which of the available options is the most suitable according to visual demands of the patient. Visual needs and patient's demands should be determined before choosing the design. Due to the optical behavior and design of each multifocal IOL, the eye care professional should know the different options and technologies available in intraocular lenses, as well as specific refractive techniques for these patients, to offer the best optical solution to satisfy the visual demands of the patient at different distances.
Performing subjective refraction is one of the most complicated aspects involved in the refractive management of patients implanted with multifocal intraocular refractive lenses. In relation to asymmetric design lenses, such as those used in this study, the difficulty in performing retinoscopy or the imprecise nature of auto-refractometry has been described.8 In auto-refractometry there is a hypercorrection in negatives with these lenses due to the interaction of the near/far refractive zones, as well as a low correlation in astigmatism, which hinders the subjective refraction to the optometrist. In addition, the performance of retinoscopy in these asymmetric distribution lenses causes irregular shadows that can make the technique harder to interpret. However, it is important to obtain a reliable postoperative refractive result to correctly assess the visual function and real functionality of the implanted lenses, and to consider optometrical treatments options for optical compensations, if the VA is not good enough at the distances that the patient demands.
Therefore, and considering the previously mentioned difficulties in the refractometry of these patients, the defocus curve is presented as a high-value clinical tool in the refractive management of patients using presbyopic compensating solutions based on simultaneous vision,9,10 such as contact lenses and multifocal intraocular lenses.
For a correct exploration of the VA at different distances, the defocus curve has proven to be an effective, simple and reproducible method that allows to characterize the optical functionality of the multifocal IOLs7,11 as well as to assess the effective addition and their performance. This allows the prescription of optical aids to improve the patient's VA in those areas where the IOL is not completely functional or has optical limitations.12
The choice of different additions in bifocal IOLs, when available, offers the patient a personalized VA according to their visual needs,1 maintaining dysphotopsia at low levels even in scotopic environments,13 lower than other intraocular correction options such as diffractive trifocal lenses.13–15
In the case of this study, the objective was to characterize the optical behavior of two refractive bifocal IOLs with asymmetric design and different additions.
In this work, the post-surgical residual refraction can be classified as excellent, considering the minimum error in spherical equivalent obtained. Furthermore, the use of defocus curves in both groups of patients, implanted with high addition or medium addition bifocal IOLs, showed high repeatability in each group, with very similar behaviors among the different patients in each focus condition.
Regarding the optical behavior difference between the IOLs, as expected, the medium addition IOL provides good performance up to a distance equivalent to the blur of −2.50 D, about 40cm, from which there is a progressive loss of VA. It should be noted that the medium addition IOL implanted in this group (LS-313 MF20) has a+2.00D add in the corneal plane, which would provide a correct focus up to an intermediate distance close to 50cm.
Table 2 shows the relationship between VA and defocus level according the IOL Model. There was a statistical difference between mean VA on the defocus levels over -3.00 D. This fact confirms the difference in optical behavior and VA achieved between IOL groups shown in Fig. 1, confirming statistically the group of high addition IOL as the best AV provided at close distances.
However, patients included in this study were able to obtain an acceptable VA (close to 0.20LogMAR) at a closer point, i.e., at 40cm, probably because of the small pupillary diameter that could cause an increase in depth of focus. This is one of the limitations of this study: we obtained interesting results in near vision, but it was not possible to perform a dynamic control of the pupil diameter and it could vary depending on the light conditions or accommodative stimuli. In our study, the lighting conditions in the room were controlled, with a constant luminance of 85cd/m2, and the fact of making the defocus curve at a distance of 2m according to the examination protocol described by the developer of the app used.6 The Multifocal Lens Analyzer app4 has been used to study performance of multifocal IOL.16 This application has been developed to present calibrated optotypes at a distance of 2m, it is therefore necessary to optically compensate this distance, taking the optical vergence of 2m to infinity, by interposing a+0.50 D lens before starting the scan and the defocus curve.6,16 This fact could help to control proximal myosis due to the induced convergence when the patient focuses at close distances such as 30 or 40cms. However, despite this fact, the optical behavior of the IOLs is different depending on the addition of each lens, so the influence of the pupil diameter is not decisive in the near vision in this case. Therefore, we suspect that in our study, the role of the pupillary diameter is not very important, although it could provide a slight increase in the depth of the nearby focus.
Other curious phenomenon was about the VA achieved in different levels of defocus. In the medium addition group, the mean VA achieved in the −1.00D level of defocus was slightly higher than the VA achieved in Plane level (VA at −1.00=0.07±0.04/VA in plane=0.10±0.09). Despite of this difference of 0.03LogMAR VA, the paired statistical analysis between those means of VA in those defocuses levels showed that there were no significant statistical difference between the means of VA between these defocus levels (paired t-test p=0.541). This fact could also be explained with some myopic residual refraction that could affect VA in plane level and improving VA in close distances, but actual mean refraction of this group was not myopic (mean spherical equivalent in the LS-313MF20=+0.12±0.10D group). Probably the existence of high order aberrations in this IOL models could affect to this phenomenon,17 causing the fluctuation of VA in those defocus levels. Other authors described better VA in intermediate distances in refractive multifocal IOLs with medium addition compared with the same model with high addition,18 fact that matches our results.
On the other hand, the high addition lens, with a corneal plane equivalence of +3.00D, allows patients to maintain an acceptable near VA of more than 33cm (AV 0.2LogMAR), maintaining a good and consistent VA in the rest of the distances up to refractive infinity, values that agree with what has been previously published by other authors.19
The good optical performance of the lenses in out of focus points is remarkable, contrary to what usually happens with diffractive bifocal IOLs, in which, irrespective of the addition, optical performance out of focus causes a remarkable loss of quality visual. In other IOLs, the assessment of VA at out of focus distances, reveals a marked reduction in VA due to the more concentrated distribution of light in the focal points. The good tolerance to residual refractive errors of these lenses was previously described,3 and the good results obtained previously in visual function after a high number of implanted lenses20 were similar to the values obtained in this study.
ConclusionsThe high addition intraocular lens provides better visual acuity in the spatial range from infinity to the point close to 25cm. The medium addition intraocular lens provides excellent visual acuity in far and intermediate vision.
The defocus curve seems to be a valid and reproducible tool for evaluating the optical behavior of multifocal sector refractive lenses.
FundingThis research did not receive any specific grant from funding agencies in the public, commercial, or not-for-profit sectors.
Conflict of interestNone of the authors had conflict of interest in this work.
The authors thank the technical staff and Equipment and the Optometry Department of the Instituto de Ciencias Visuales (INCIVI) – Hospital La Zarzuela, who made this research possible. The authors also thank Professor M.A. Zato and the Optometry Department staff for their scientific and personal support.


