


Artificial Intelligence, Data Science and E-health in Vision Research and Clinical Activity
More infoRetinal and optic disc images are used to assess changes in the retinal vasculature. These can be changes associated with diseases such as diabetic retinopathy and glaucoma or induced using ophthalmodynamometry to measure arterial and venous pressure. Key steps toward automating the assessment of these changes are the segmentation and classification of the veins and arteries. However, such segmentation and classification are still required to be manually labelled by experts. Such automated labelling is challenging because of the complex morphology, anatomical variations, alterations due to disease and scarcity of labelled data for algorithm development. We present a deep machine learning solution called the multiscale guided attention network for retinal artery and vein segmentation and classification (MSGANet-RAV).
MethodsMSGANet-RAV was developed and tested on 383 colour clinical optic disc images from LEI-CENTRAL, constructed in-house and 40 colour fundus images from the AV-DRIVE public dataset. The datasets have a mean optic disc occupancy per image of 60.6% and 2.18%, respectively. MSGANet-RAV is a U-shaped encoder-decoder network, where the encoder extracts multiscale features, and the decoder includes a sequence of self-attention modules. The self-attention modules explore, guide and incorporate vessel-specific structural and contextual feature information to segment and classify central optic disc and retinal vessel pixels.
ResultsMSGANet-RAV achieved a pixel classification accuracy of 93.15%, sensitivity of 92.19%, and specificity of 94.13% on LEI-CENTRAL, outperforming several reference models. It similarly performed highly on AV-DRIVE with an accuracy, sensitivity and specificity of 95.48%, 93.59% and 97.27%, respectively.
ConclusionThe results show the efficacy of MSGANet-RAV for identifying central optic disc and retinal arteries and veins. The method can be used in automated systems designed to assess vascular changes in retinal and optic disc images quantitatively.
Retinal vascular abnormalities may indicate several sight-threatening conditions and cerebral and cardiovascular diseases. The optic nerve position is a potentially vulnerable anatomical location for blood vessels in the presence of several sight-threatening diseases because all blood vessels in the retina enter and leave through the centre of the optic nerve.1 Asymmetric morphological changes in the optic disc and retinal vessels have been observed in the presence of hypertension2 and diabetic retinopathy (DR).3,4 DR is alone responsible for 5.2% of blindness in Australia.5 Arteriolar vessel walls are morphologically thinner and less elastic than veins.3 In the presence of DR, arteries tend to be more tortuous and constricted in diameter, which signifies the risk of stroke.4 Furthermore, in the case of central retinal artery and vein obstruction, a significant expansion is observed behind the obstruction location of the central vessels, and the most significant expansion is observed in the optic disc region.1 Such obstruction leads to central retinal vein occlusion (CRVO) and central retinal artery occlusion. Vascular occlusions cause 3.7% of blindness in Australia.5 Glaucoma is the second most common cause of blindness (10.7%) in Australia5 and significantly affects veins in both the retina and optic disc region. It represents a common risk factor for CRVO.6 Moreover, major changes in the central vein at the optic disc region are detected during raised intracranial pressure (ICP).7
Physiologically, the retinal vessels carry haemoglobin. Variations in light absorption of haemoglobin inside the vessel can indicate quantitative vessel amplitude variations related to vessel wall movement (i.e., pulsation). Pulse amplitude at the optic disc region induced by ophthalmodynamometry can indicate vessel wall changes from vascular disease and be used for ICP prediction.8 Structural and functional vascular variations can be automatically assessed from the optic disc and retinal images.
Digital ophthalmoscopic photography offers non-invasive visualisation of the retinal vasculature. Individual images can be used to assess morphological attributes of retinal vessels such as diameter, tortuosity, and branching patterns. Image sequences can be used to assess vascular pulsation associated with blood flow. Changes in retinal vasculature structure and function are hallmarks of eye diseases, including glaucoma and retinal vascular diseases such as DR, macular degeneration and retinal vein occlusion. These changes can be assessed to gauge severity, progression and response to treatment.9 Ophthalmodynamometry is a procedure used to induce changes in central vascular pulsation via external compression of the globe. Quantitative assessment of these changes permits the measurement of vascular pressure and, indirectly, intracranial pressure(ICP) prediction. General colour fundoscopy provides visualisation of the optic disc, macula, and central and peripheral retina. However, these images have low optic disc occupancy, limiting the vascular detail that can be seen at the optic disc. Optically magnified colour optic disc imaging is used to obtain more detailed images of the central vessels in the optic disc region. These images can be used to record ophthalmodynamometry-induced changes and analyse the pulse wave variations along the central superior and inferior vessels in the optic disc region,7 can be a foundation to measure indirect ICP automatically.8
Automatic assessment of vascular changes from the colour optic disc and retinal images from fundus photography is highly reliant on the accurate segmentation of retinal blood vessel pixels and classification of those vessel pixels as either artery or vein pixels. Manual segmentation is time-consuming, subjective, and impractical when large sets of high-resolution images and image sequences are involved. Consequently, several computational methods for the automatic segmentation and classification of veins and arteries from such images have been published. These methods can be broadly categorised into two categories: (i) methods based on traditional machine learning using handcrafted features (quantitative measurements) and (ii) deep learning methods.
Handcrafted feature methods have used hierarchical strategies to distinguish the artery and vein vessels from the background.10–12 These methods have segmented the binary maps of the vessels from the image. In other words, they subtracted the vessels from the background (including the optic disc and other visible components). They then found artery or vein pixels using handcrafted (e.g., shape and intensity profiles) feature-based classifiers. However, artery-vein classification can be affected by the design of extracting handcrafted features and poor segmentation accuracy. Deep learning methods have set an avenue to segment and classify retinal vessels by automatically exploring and learning quantitative features by identifying patterns from retinal images.13–21 However, scarcity and imbalance of artery-vein-background pixel data on individual images pose additional challenges for deep-learning methods. Even the appearance of clinical retinal and optic disc images can vary depending on the instrument used and the practitioner. These methods are still prone to misclassifying choroids as vessels and identifying different segments of the same vessel as both artery and vein at the pixel level. And, to the best of our knowledge, no such automated methods have been proposed to classify central vessels in the optic disc. Therefore, we propose a deep-learning method called Multiscale Guided Attention Network (MSGANet-RAV) for artery and vein segmentation and classification from both optic disc images and retinal images from fundus photography. We train and test our method on both type of images and compare the performance with several popular methods and semantic segmentation and classification architectures, including DeepLab,19 PspNet,22 U-Net,23 SegNet24 and the state-of-the-art architecture.21
MethodThis section includes a description of the datasets of the ophthalmic images on which the algorithm was trained and tested, an overview of the proposed deep-learning architecture and implementation details for semantic (pixel-wise) vessel segmentation and artery-vein classification. Details of the algorithm are available in the Supplementary Materials:. It is a novel end-to-end multiscale guided attention deep neural network architecture for classifying artery and vein pixels in both optic disc and retinal images. We use a multiscale feature encoder to extract and fuse the variable scaled features at an exact resolution of the deep encoding or decoding network stages. We also include a guided attention module that attends to the retinal structural information of vasculature and emphasises vessel-like feature information over background-like features.
This study was approved by the Human Research Ethics Committee of the University of Western Australia and has been carried out in accordance with The Code of Ethics of the World Medical Association (Declaration of Helsinki).
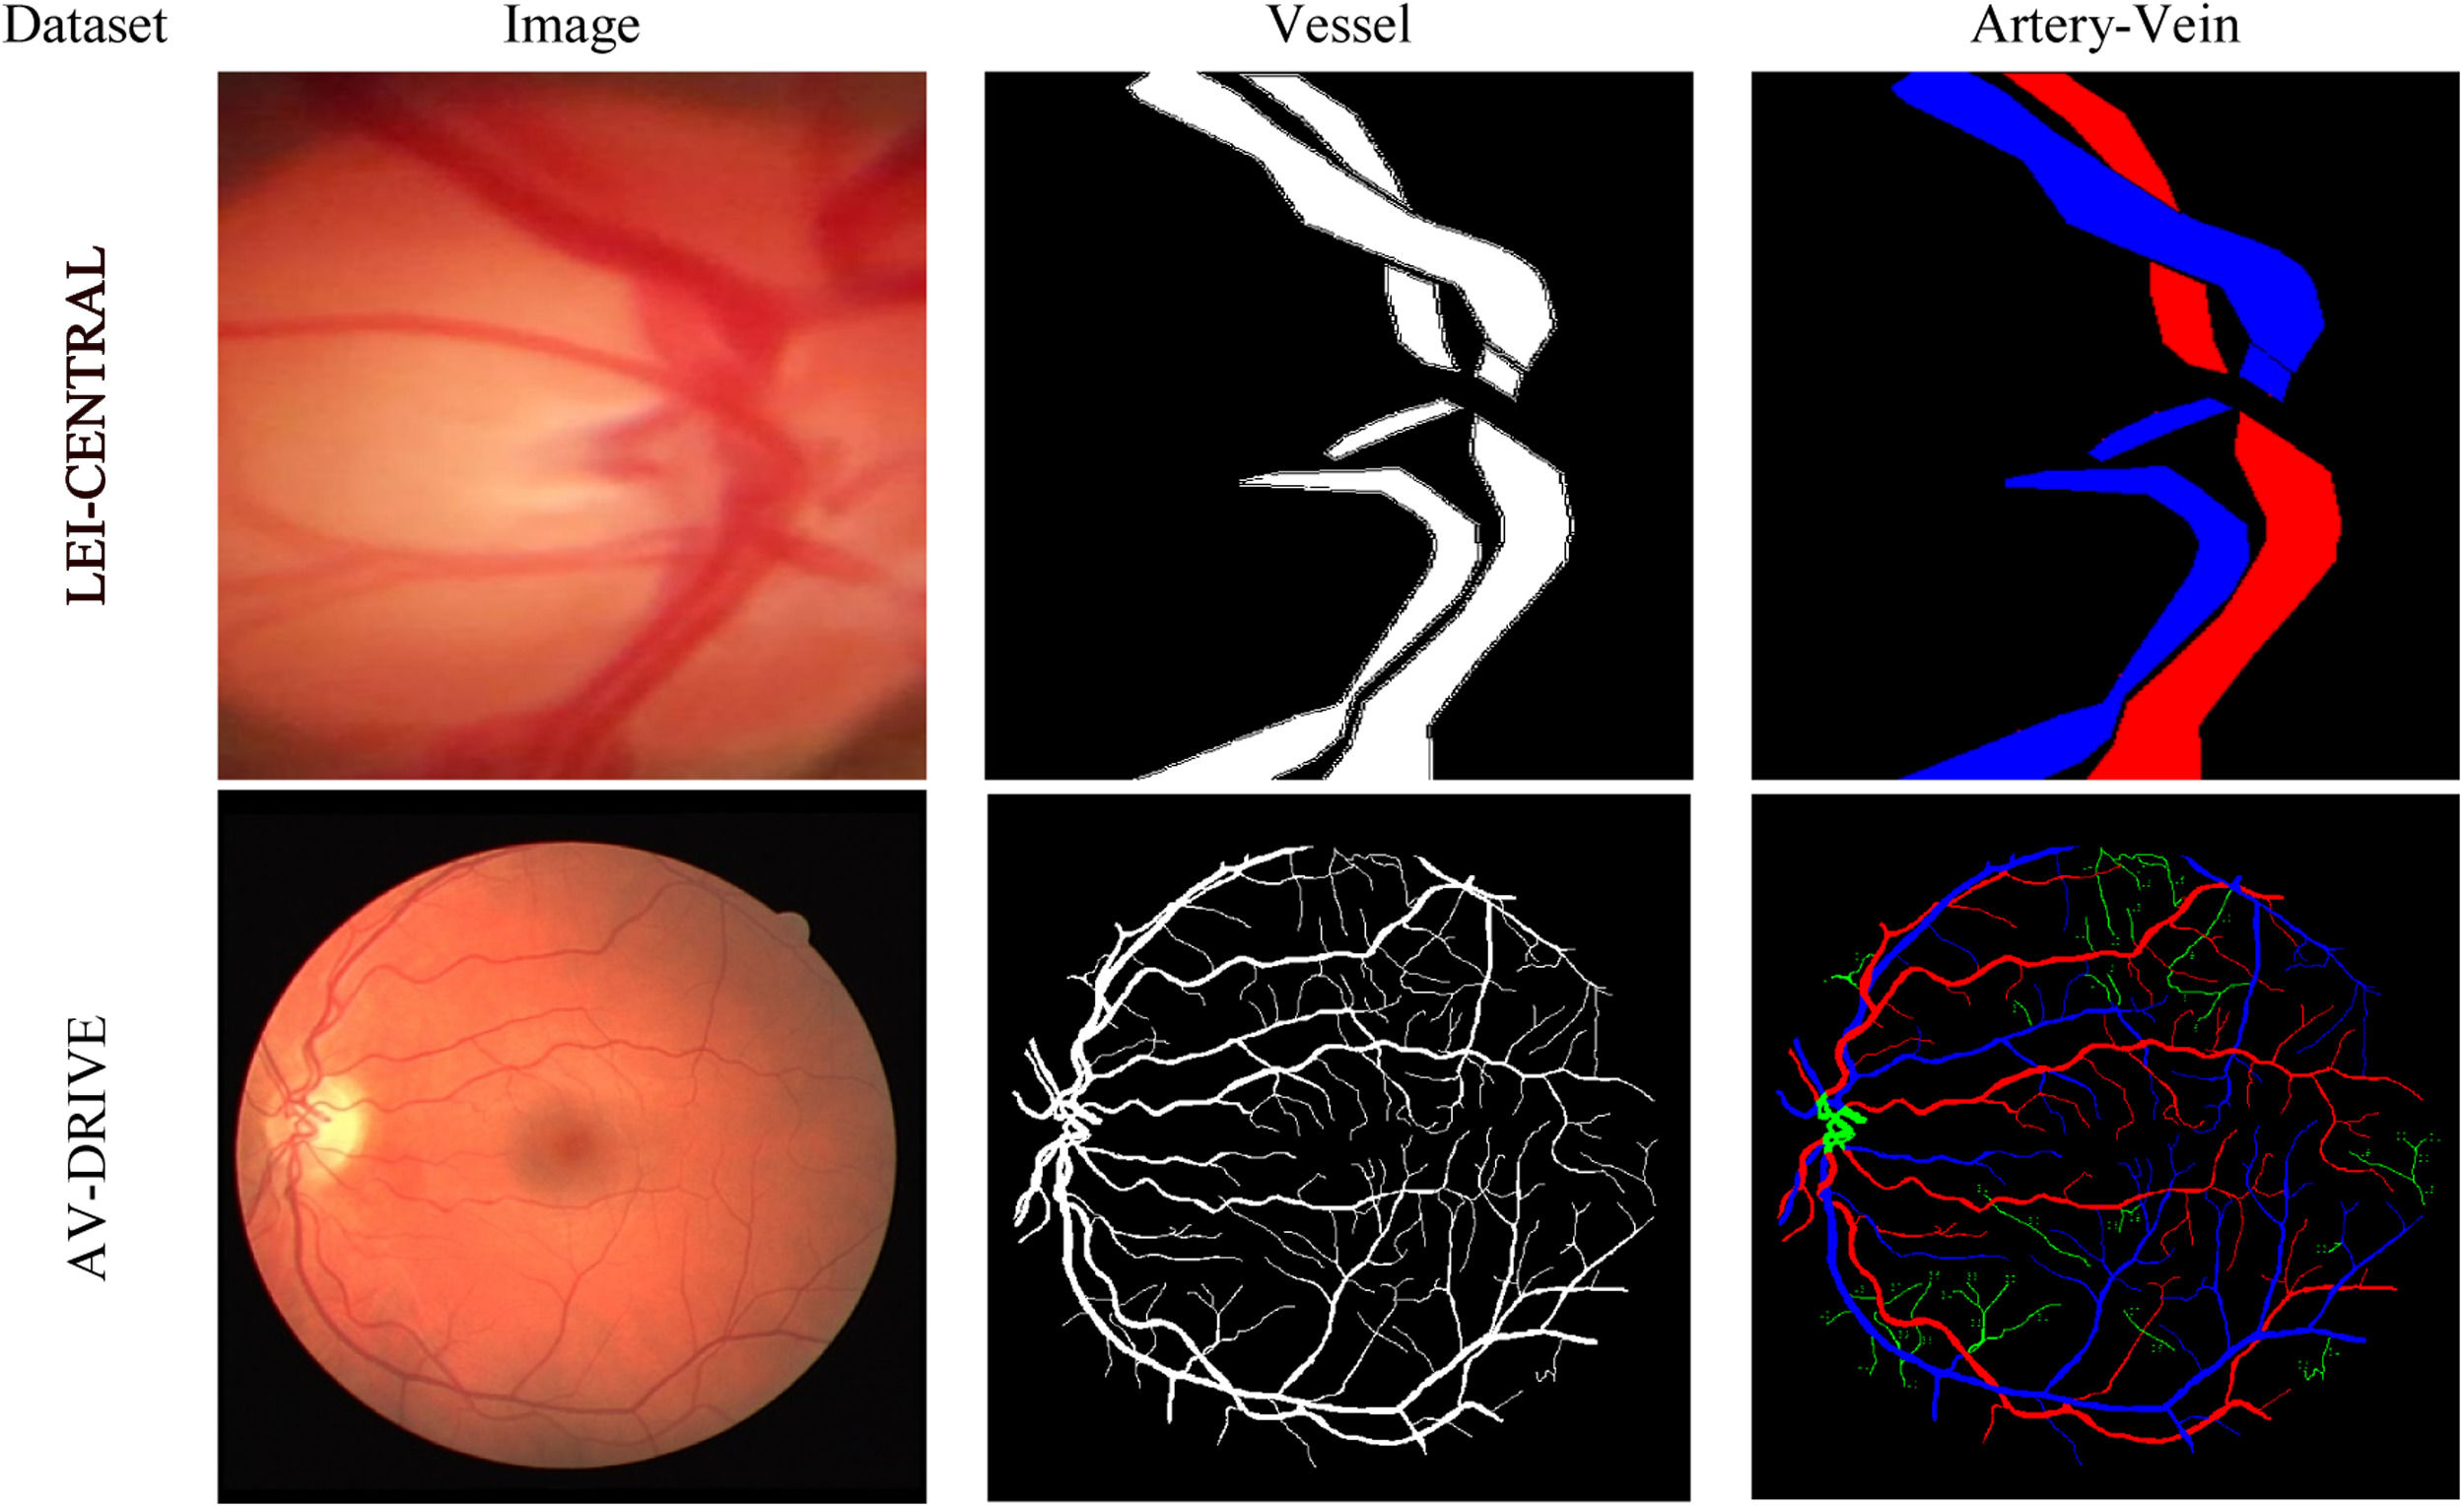
DatasetsTwo datasets were used in this study: (i) LEI-CENTRAL and (ii) AV-DRIVE.25Fig. 1 shows one example of a retinal image, its binary vessel segmentation and artery-vein labels from each dataset.
LEI-CENTRAL
This is an optic disc image dataset constructed from clinical optic disc images collected at the Lions Eye Institute (LEI) in Australia. The images were captured using a Goldman 3 mirror lens attached to a Meditron ophthalmodynamometer (Meditron, Volklingen, Germany) using a video slit lamp camera recording of 25 fps (Canon 5D mark III, Japan). The field-of-view (FoV) for the acquisition setup was 10∘ The eyes were dilated using 1% Tropicamide during the image acquisition. The dataset comprises 383 images of the optically magnified optic disc region. A set of 3-cardiac cycle videos were captured at varying ophthalmodynametric forces. The captured frames dimension (width×height) was 1920×1080 pixels. The acquired frames from each subject were cropped to remove the shadows, resulting in a different dimension for separate acquisition. We generally selected the first cropped frame as our input image. Thus, a multi-centred image dataset was prepared from the videos. The optic disc area varies in size for different subjects due to ODM lens movement (sliding and pressure) on the eyeball. The average optic disc occupancy on the LEI-CENTRAL dataset image is about 60.6% of the retinal content, providing detailed vascular morphological and physiological information on the optic disc surface. To the best of our knowledge, no public dataset contains the labels of optic disc vessels such as arteries and veins at an optically magnified level. For experiments, we split the dataset into training and test sets at an 80:20 ratio, which resulted in 306 training and 77 test images and labels. We also resized the images and associated ground truth labels to 512×512 pixel dimensions for experiments.
Experts manually labelled the artery and vein pixels of the both central superior and inferior vessels inside and outward of the optic disc using a custom-written interactive FIJI26 script. The task was considered challenging because of the variable contrast and complex vessel structures. Numerous points around each central superior and inferior vessel boundary were selected to form a polygon. Each of the polygons, including the pixels within, defines a vessel region. Then each polygon was labelled as either artery (red) or vein (blue), while the rest of the pixel area was labelled as background (black). Thus, a ground truth masque was formed from an optic disc image. During artery-vein labelling, experts accessed the video of pulsating vessels at the optic disc region and considered the functional and physiological characteristics of the vessel system. For example, the widest superior artery and vein through the optic disc centre were generally selected as the central vein and central artery, respectively.
AV-DRIVEThis is a publicly available retinal image dataset derived from the DRIVE dataset,27 with pixel-wise artery-vein ground truth labels.25 The images were obtained from a DR screening program in the Netherlands. The images were captured using a non-mydriatic 3CCD camera with a 45°FoV. Such camera has three independent charged-coupled integrated circuits to receive filtered red, green and blue colour ranges of light. Specifically, it contains 20 training and 20 test macula-centred images, including the associated ground truth vessel segmentation labels and masks. The dimension of the images and labels was 584×565 pixels. It has been used in several retinal image analysis tasks, including vessel registration, segmentation and retinal disease progression.25 AV-DRIVE is also a benchmark dataset for evaluating artery-vein classification, which comprises classification labels for both big and capillary vessels. However, unlike the LEI-CENTRAL image, average disc occupancy on the DRIVE image is only about 2.18% area of total retinal content on an image. The major parts of the optic disc vessel pixels in the optic disc centre were not annotated as an artery or vein; they were rather labelled as undefined.
AV-DRIVE ground truth masks are publicly available. According to Qureshi et al., artery-vein labellings were performed by three observers (two computer vision experts and one ophthalmologist).25 Observers revised their conflicting labelling for the few vessel by sharing conflicting labels discussing between themselves. They made several assumptions about the characteristics of the retinal vascular system (e.g. the vessels crossing each other must be from the opposite classes and, the arteries are usually thinner and brighter than the neighbouring veins). According to the authors of AV-DRIVE,25 undefined vessel pixels lack distinguishable feature information to be recognized as an artery or vein pixel. More details about the dataset are available in the original articles.25,27
MSGANet-RAVOur proposed MSGANet-RAV is a deep convolutional neural network (CNN)28 architecture that segments and classifies retinal and optic disc vessel pixels. CNN is an algorithm in the field of artificial intelligence and machine vision that is somewhat analogous to the working of the human visual system. CNN has been designed to understand image pixels and recognise the salient characteristics of an image. Activity from the optic nerve is distributed to a visual field in the striate cortex, building up information about the world as the eyes saccade and fixate. This information is physically organised at the primitive level as a kind of visual map consisting of basic angular and colour features. These features are then subsequently processed into more integrated patterns at ever higher levels of abstraction, eventually being recognised as objects and their relationships. CNN uses the convolution operation (weighted sum of products of pixel neighbourhoods) to explore patterns (colour, shape, size and so on) in an visual image. A number of filter kernels (i.e., weights) are used to perform the convolution with the input image to explore the patterns. Usually, the convolution kernel spatial resolution is much smaller than the image. The idea is to learn the patterns in smaller but connected grids of pixel neighbourhoods covering the whole image. These grids with numerous representations or patterns are then densely connected in several layers, followed by a final layer to classify the image. MSGANet is built upon a widely used CNN-based U-Net23 architecture for pixel-wise segmentation tasks (recognition and localization of contents). We extend this in our MSGANet-RAV with addition of two major components: multiscale (MS) feature encoding and guided attention (GA).
U-Net is a compound and multi-staged CNN that has also been broadly used for biomedical image segmentation, e.g., retinal vessel segmentation. The architecture contracts and expands spatial feature maps of an input image on its encoder and decoder network, respectively. It automatically explores patterns of vessels at each stage using repeated operations e.g., convolutions, normalization and activation functions. Patterns are learnt at lower resolution that are projected onto higher resolution pixel space for classification. We extends this architecture by incorporating multiscale encoding at all encoder stages. We also developed and fused a guided attention module into the decoder network.
Multiscale (MS) feature encoding extracts various scaled features of vessels in gradually enlarged receptive fields at the same network stage. It enhances the representation of vessels having variable widths, e.g., thin vessels at the periphery and thick central vessels. As a feature encoder, we adopted a Res2Net29 backbone model. Res2Net effectively extracts vessel features on multiple scales at the same stages. Technically, the Res2Net provides a coarse representation of multiscale features analogous to range enhancement of receptive fields at a network level.
Our proposed guided attention (GA) network at the decoder stages of the network, guides the acquisition of information toward salient elements of the vessel structure in an image by feature combinations from two submodules: guided filter (GF) and self-vessel attention (SVA). The GF improves the identification of complex boundary structures (capillary vessels and edge of thick vessels). It emphasizes multiscale feature maps of the same resolution and preserves structural information (i.e., edge) at the decoder stage. Thus it highlights the foreground vessel pixels while reducing the influence of the background pixels at the vessel boundary by filtering less relevant background-like details. SVA module refines vessel feature representation by exploring the vessel distribution and additional contextual information from a context learner layer. It explores the global context from the surrounding spatial location of local vessel features at the decoder stages to emphasize vessel-like features in preference to background-like features. A separate SVA block is also used at the end of the decoder to strengthen the vessel context before the depth channel reduction. The channel reduction or input to output mapping convolution lacks context from the surrounding pixels of a vessel pixel at the last stage.
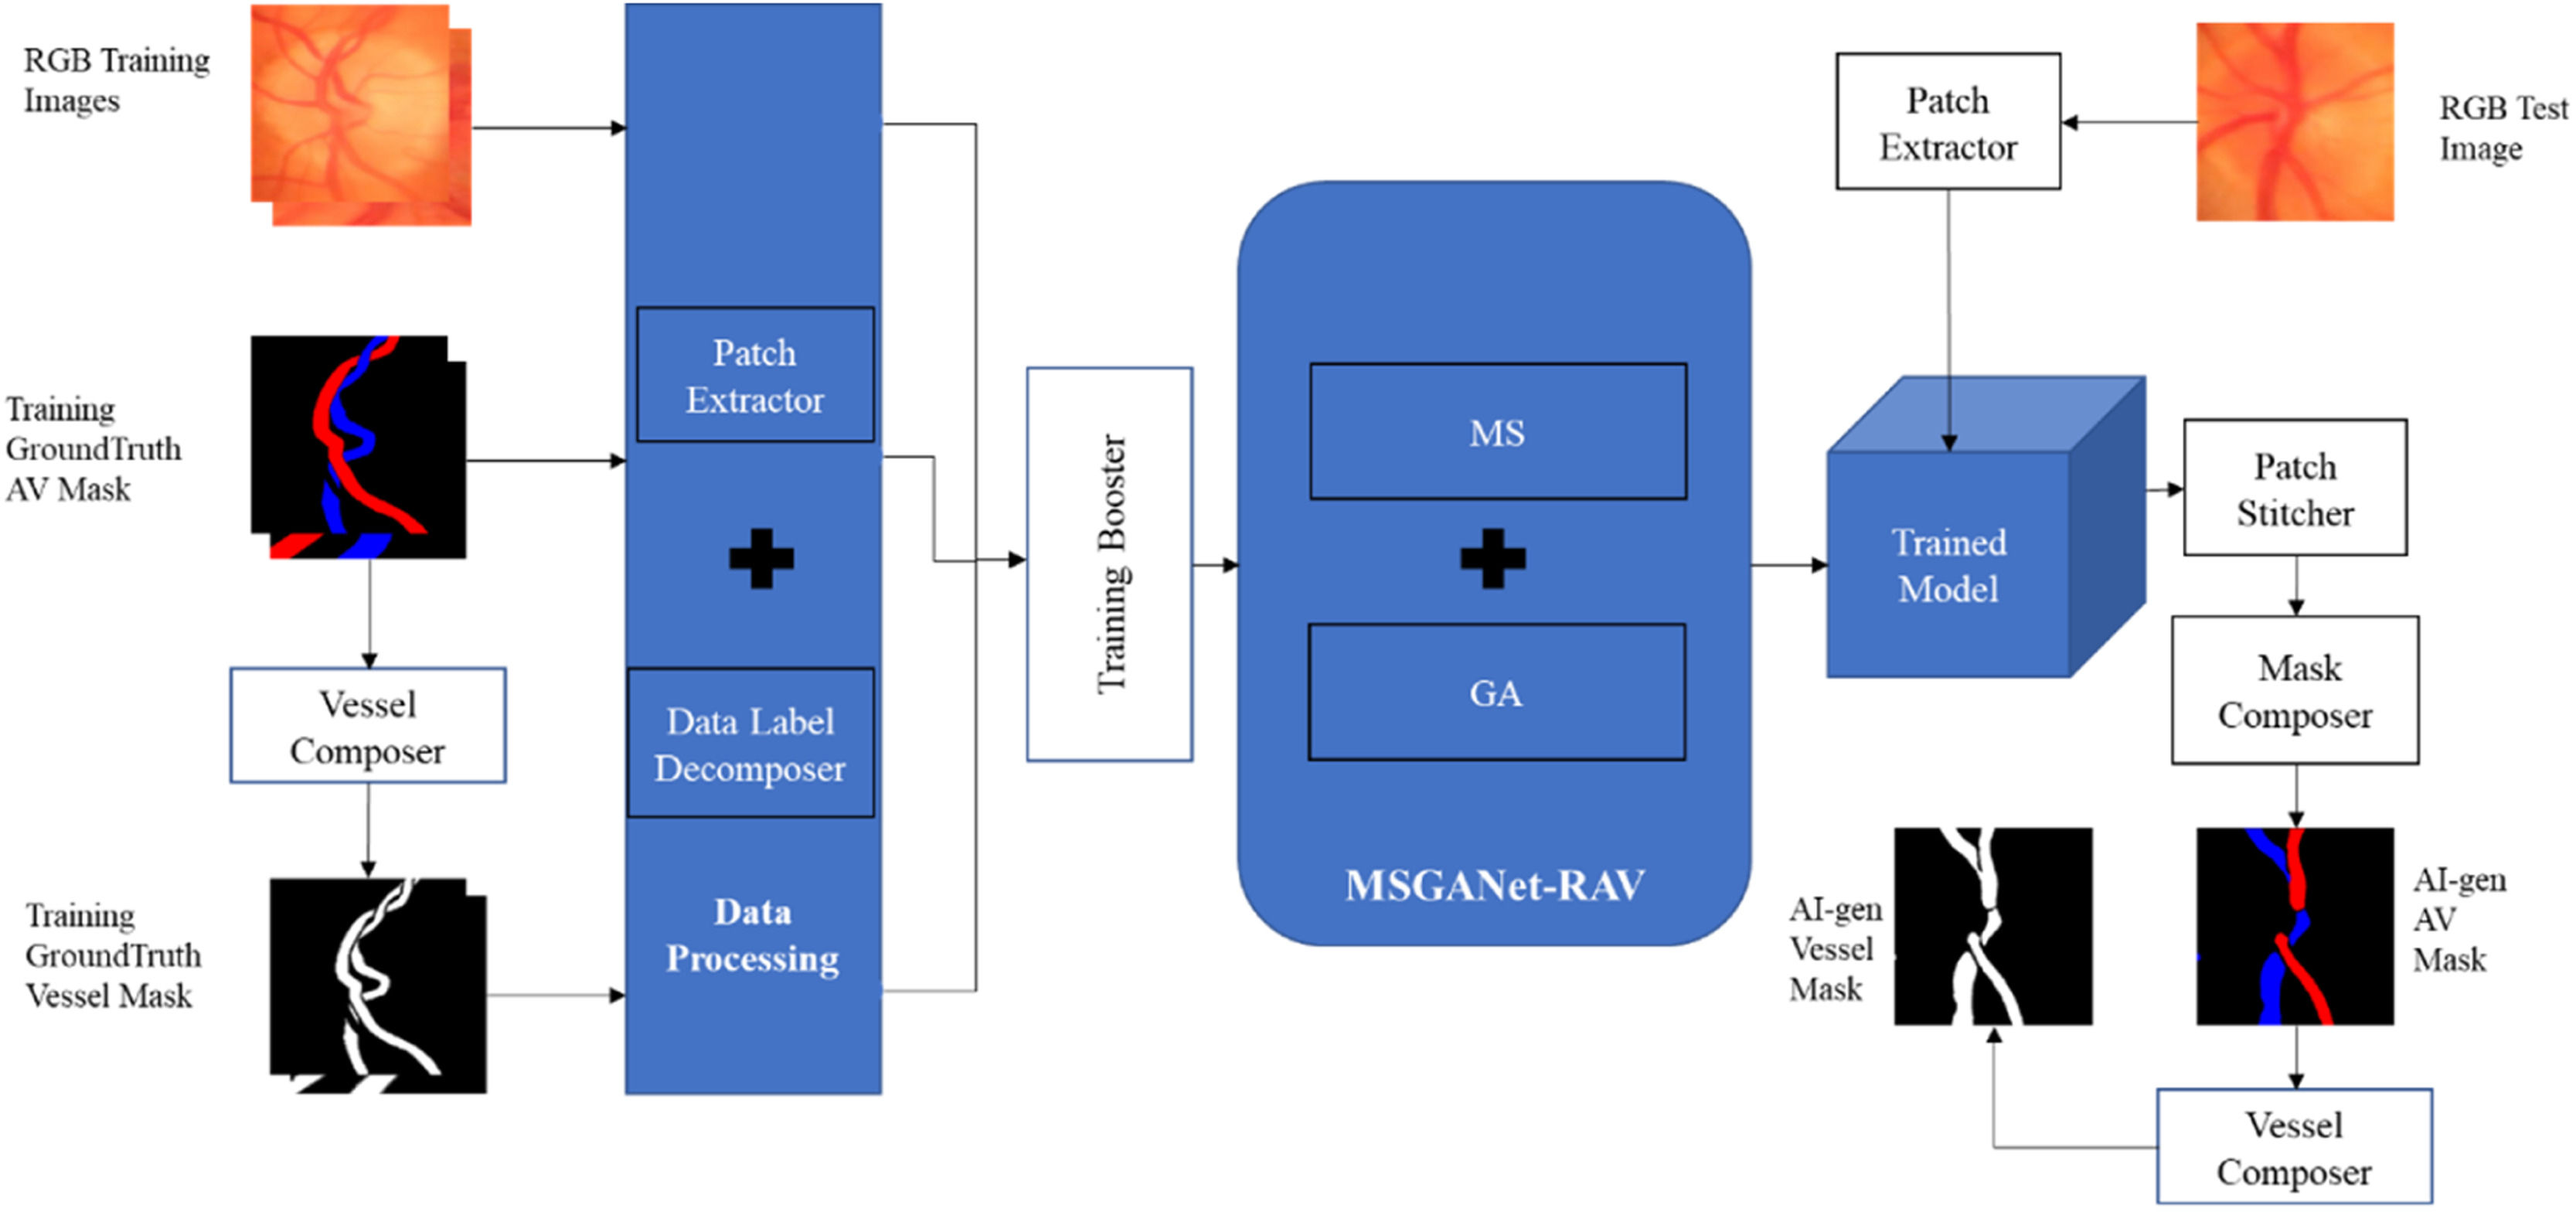
ImplementationThe implementation workflow of the deep-learning method of automatic artery-vein classification and vessel segmentation is illustrated in Fig. 2. We discuss the major implementation aspects in the following sections.
Model training
We independently trained the model from scratch on the training sets of both datasets, i.e., we trained separate models for the two datasets. Before the training, a vessel composer composed a ground truth RGB artery-vein (AV) masque (artery: red, vein: blue, background: black, undefined: green [only AV-DRIVE]) into a ground truth vessel masque (vessel: white, background: black) by colouring the artery and vein pixel white. The model was trained to jointly perform pixel-wise classification tasks of the artery-vein-background label and vessel-background label. Artery-vein and vessel masks were decomposed into corresponding class labels for each pixel. A patch extractor was used to extract random training patches of 256×256 pixels from each training input image and corresponding AV and vessel masks of the training set. Insufficient numbers of training examples are a frequent problem in deep learning work. To synthesize more training data from the datasets at hand without introducing spurious information, we transformed the existing images by horizontal and vertical flips, random rotations and x-y shifts. In machine learning, this technique is called boosting. We used the Adam optimiser with training with an initial learning rate of 0.0001 and a weight decay (2λ) of 0.00001 with L2 regularisation. We also set the minimum number of iterations as 1000 and the maximum as 4000. These hyperparameters were selected by experimentation for optimal joint-task classification. In other words, these hyperparameters were updated automatically during each training iteration to get finest version of the trained model. We usually use a loss function to evaluate the set of weights of the neural networks after each training iteration. In our method, the final joint training loss function was itself a self-learnable function of the joint tasks vessel segmentation from background and artery-vein classification by binary cross-entropy and general cross-entropy criteria, respectively. After completion of training, we had an artificially intelligent (AI) model, specifically a deep-learning model, for automatically generating RGB AV and vessel segmentation masks.
AI labellingA patch extractor extracted sequential patches of 256×256 pixels from an input image of the test set of a dataset. Then, those patches were tested on the trained deep-learning model. This model generated outputs as a matrix of probability scores for each class (e.g., Artery, Vein or Background) for the corresponding patches. Similarly to the semantic segmentation approach of U-Net, the last network layer was followed by an 1×1 convolution with a sigmoid activation function to get the probability scores. Then, a patch stitcher sorted and stitched the sequential output patches (with probability scores) to form the output matrix of the test image. Then, a masque composer composed an RGB AV masque by labelling one class label for each pixel according to its maximum probability score of the classes and coloured the pixel based on its respective class label. The vessel masque was generated from the RGB AV masque generated by a vessel composer.
System and platform specificationMethod development and experiments were conducted on an Intel® Core™ i9–10900X central processing unit with a processing speed of 3.7 GHz, primary memory of 128GB of space, and a Compute Unified Device Architecture30 (CUDA)1 enabled graphical processing unit (NVIDIA® TITAN RTX™)2 running under Linux (Ubuntu 20.04LTS3). We used CUDA deep neural network library31 (cuDNN 11.0)4 along with PyTorch32 backend. However, few comparing methods for the LEI-CENTRAL dataset were trained and tested using the TensorFlow33 (TensorFlow-GPU 2.3.1)5 deep learning framework.
ResultThis section presents the results of artery-vein classification and vessel segmentation from the background. We evaluated the independent test subsets of both LEI-CENTRAL and AV-DRIVE datasets. The same training and test fractions were used for comparative analysis between methods. LEI-CENTRAL contains images for one (26 subjects) or both eyes (101 subjects) for 147 subjects (Female 76, Male 71) between 16 and 96 years of age, from multiple imaging sessions. Most of the subjects were ethnically Caucasian (60%), while 20%, 8% and 5% of subjects were Asian, African and Hispanic, respectively. Of the patients, 37 had healthy eyes, while other vision-related conditions were diagnosed in at least one eye for the remainder (Idiopathic Intracranial Hypertension 39, Central Retinal Vein Occlusion 30, Glaucoma 15, AV Nip 21, Papilledema 2, Idiopathic Optic Neuropathy 1). AV-DRIVE contains images from a study of 453 subjects between 31 and 86 years of age. Amongst the 40 images of this public dataset, there were seven abnormal cases (background DR, pigment epithelium changes, the pigmented scar in the fovea and vascular abnormalities).
As a joint-task problem, we used separate sets of evaluation metrics for vessel segmentation from background and artery-vein classification. Here, each semantic pixel location was considered i={x,y} in the prediction map and target map. Both maps had a dimension of M×M, where M is the height and width of the maps. We used four benchmark evaluation metrics for vessel segmentation: sensitivity (SEves), specificity (SPves), accuracy (ACCves) and dice score of vessels (Diceves). These metrics reflect the model's ability to segment vessel pixels from the background.21 We used three benchmark metrics for artery-vein classification.21 These were balanced accuracy (BACCAV), sensitivity (SEAV) and specificity (SPAV). These metrics showed the global model performance on artery and vein classification. We also used dice scores of arteries (DiceA) and vein (DiceV). We chose the balanced accuracy metric because our datasets had class imbalance, i.e., large background to artery-vein pixels ratio. We considered artery and vein as true positive and true negative for simplicity, respectively. Since we were solving a pixel classification problem, height×widthnumbers of data points were required for classification of each test image. We evaluated each of the test images separately and computed the mean performance scores of the evaluation metrics. 95% CI for the scores were constructed for the experimental test subset of both datasets. For all the above-mentioned metrics, a higher value represents a superior performance.
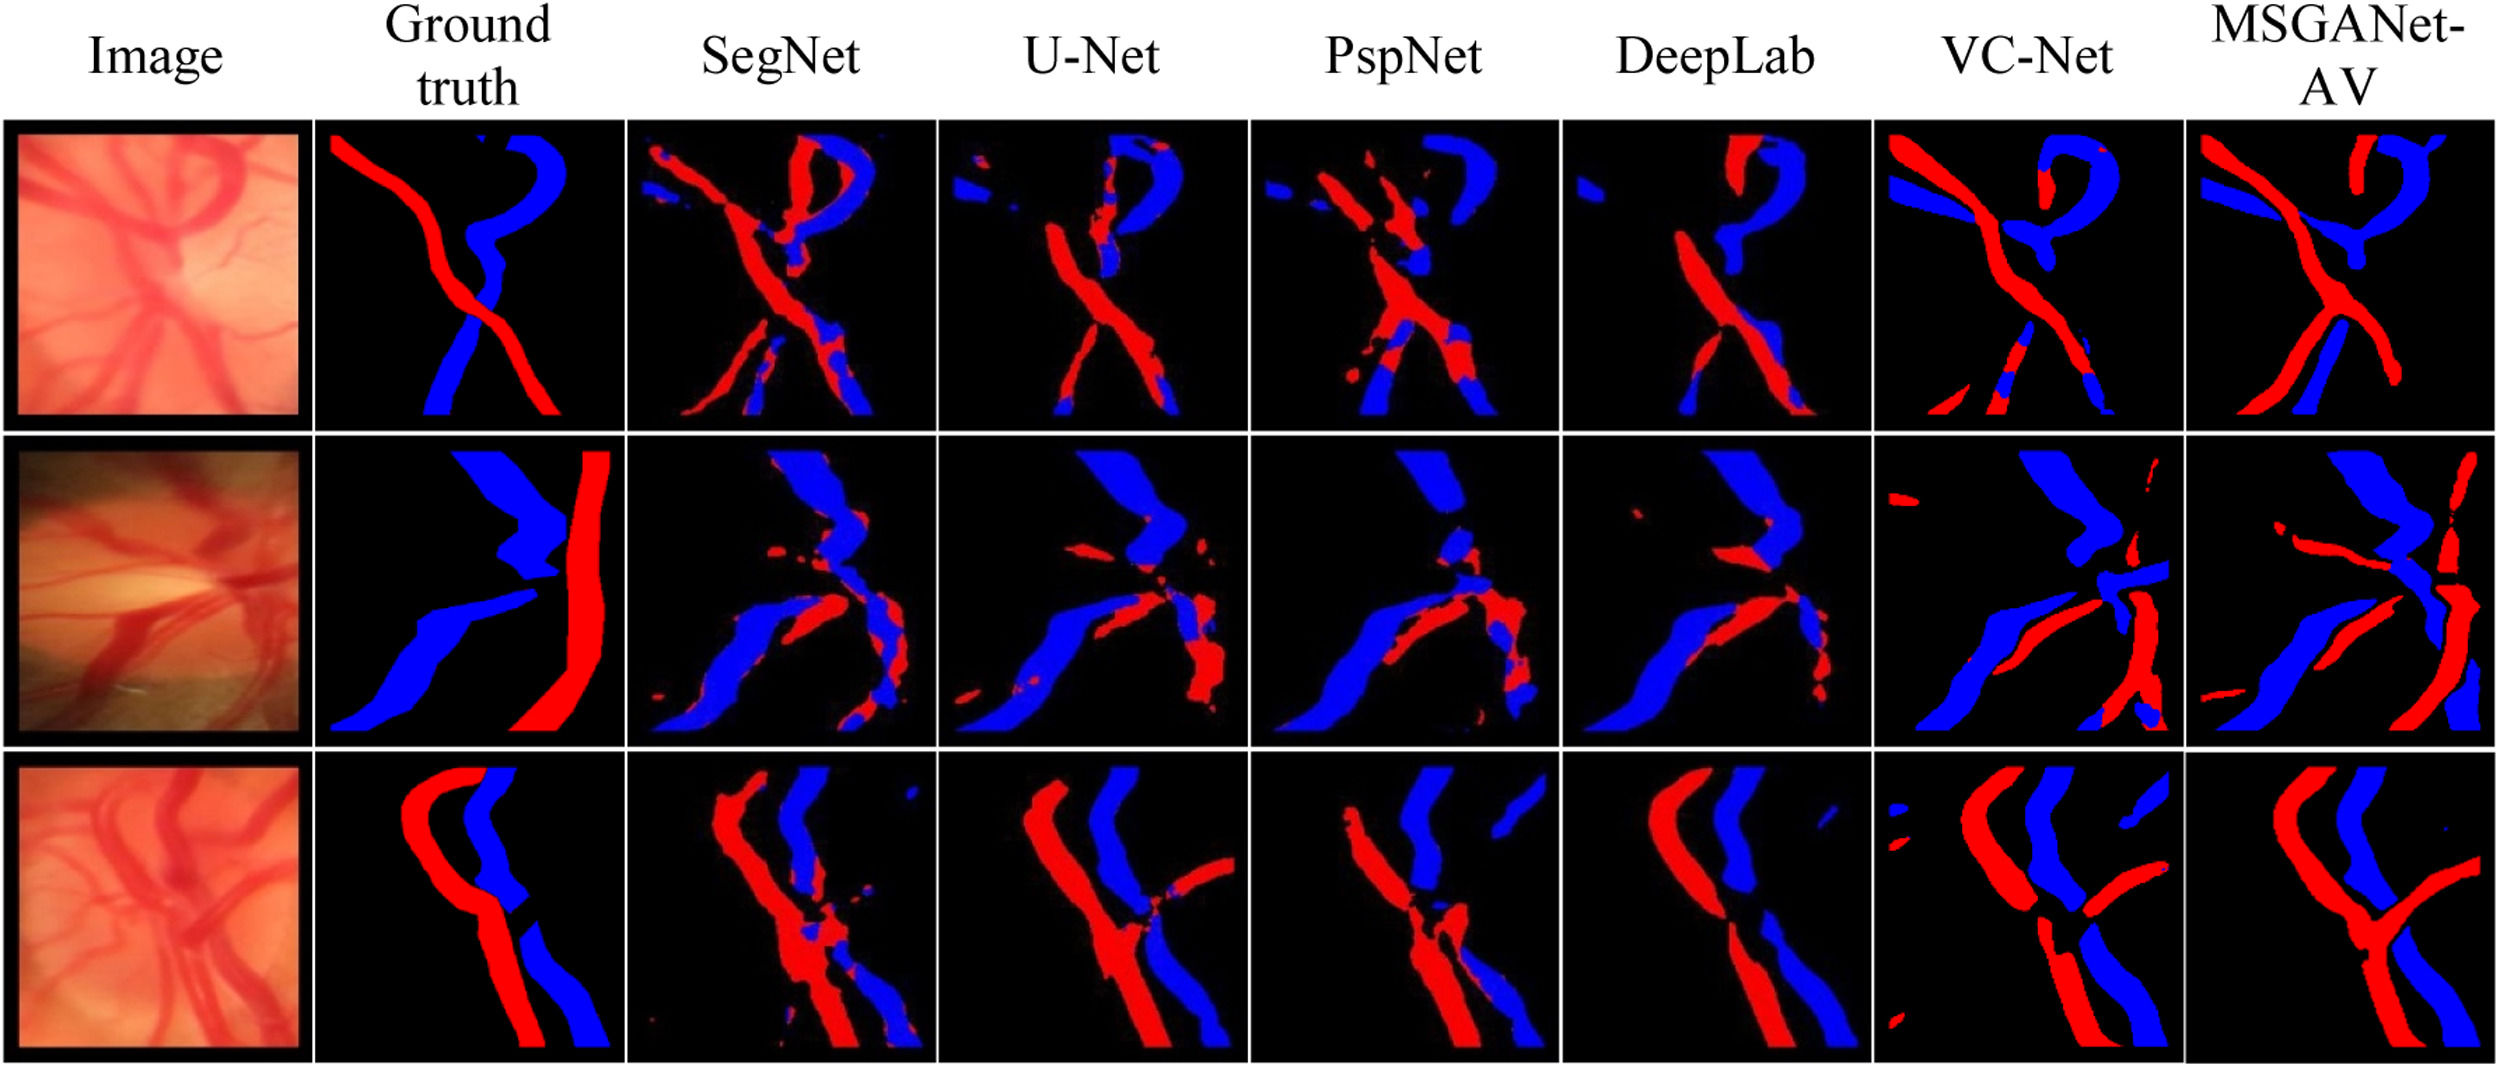
AV classification and vessel segmentationOur trained model on optic disc images (LEI-CENTRAL) from MSGANet-RAV architecture automatically generated optic disc central artery-vein classification masks and binary vessel segmentation masks. Table 1 summarises evaluation scores of classification and vessel segmentation on the LEI-CENTRAL dataset. We reported the artery-vein classification scores, balanced accuracy, sensitivity and specificity of 93.15%, 92.17% and 94.13%, respectively. The dice scores of the vein and artery classifications were 66.59% and 62.13%, respectively. We also reported the binary vessel segmentation scores, vessel accuracy, sensitivity, specificity and dice scores of 93.07%, 68.07%, 96.71% and 70.54%, respectively. We also reported evaluation scores for widely used deep retinal segmentation architectures, including DeepLab,19 PspNet,22 U-Net23 and SegNet24 and state-of-the-art multiscale vessel constraining architecture (VCNet)21 in Table 1. We obtained separate deep learning models by following a similar training approach for comparing architectures using identical training sets. Models generated the artery-vein and vessel segmentation masks from the exact test RGB images. Fig. 3 illustrates a few comparable artery-vein semantic classification maps from our MSGANet-RAV and other architectures.
Evaluation Scores of artery-vein classification and vessel segmentation from background on the test set of LEI-CENTRAL dataset (All scores are reported in percent. Top scores are highlighted in boldface).
| Methods | Artery-Vein Classification (%) | Vessel Segmentation from Background (%) | |||||||
|---|---|---|---|---|---|---|---|---|---|
| BACCAV | SEAV | SPAV | DiceV | DiceA | ACCVES | SEVES | SPVES | DiceVES | |
| MSGANet-RAV (GF+SVA) [ours] | 93.15 | 92.17 | 94.13 | 66.59 | 62.36 | 93.07 | 68.06 | 96.71 | 70.54 |
| MSGANet-RAV (GF) [ours] | 92.56 | 90.03 | 95.09 | 65.67 | 59.48 | 92.78 | 63.05 | 97.27 | 68.40 |
| VCNet21 | 90.79 | 89.56 | 92.02 | 63.83 | 56.77 | 92.37 | 66.17 | 96.42 | 68.44 |
| Deeplab19 (ResNet50) | 88.20 | 85.92 | 90.47 | 64.95 | 55.81 | 91.48 | 66.64 | 96.16 | 70.11 |
| PspNet22 (ResNet50) | 86.42 | 84.27 | 88.49 | 62.75 | 51.20 | 90.94 | 62.68 | 96.20 | 67.36 |
| SegNet24 (ResNet50) | 85.56 | 84.16 | 86.96 | 64.22 | 52.39 | 91.28 | 66.42 | 95.85 | 69.50 |
| SegNet24 (VGG16) | 89.13 | 88.16 | 90.23 | 60.95 | 50.35 | 90.67 | 54.84 | 97.16 | 63.10 |
| U-Net23 (ResNet50) [Baseline] | 87.21 | 85.61 | 88.79 | 64.74 | 55.74 | 91.48 | 67.02 | 96.08 | 70.33 |
| U-Net23 (VGG16) | 88.11 | 86.66 | 89.56 | 62.94 | 53.89 | 90.97 | 62.72 | 96.17 | 67.47 |
Artery-Vein Classification: BAACAV: Balanced Accuracy, SEAV: Sensitivity, SPAV: Specificity, DiceV: F1 of Vein, DiceA: F1 of Artery.
Vessel Segmentation: ACCVES: Accuracy, SEVES: Sensitivity, SPVES: Specificity, DiceVES: F1 of Vessel.

MSGANet-RAV generated the retinal artery-vein classification masks and binary vessel segmentation masks from the trained model on the AV-DRIVE25 fundus image dataset. Table 2 summarizes the comparable classification and segmentation results. Since it is publicly available, we used the provided separate train and test images for training and evaluation of the model, respectively. We noted mean artery-vein classification scores: balanced accuracy, sensitivity, specificity, dice-vein and dice-artery of 95.48%, 93.59%, 97.27%, 79.39% and 75.48%, respectively. We obtained vessel segmentation accuracy, sensitivity, specificity and dice scores of 95.61%, 83.51%, 97.47% and 82.73%, respectively. We also reported the classification and segmentation performance of state-of-the-art21 and other popular methods10–12,15,17,20,34 in Table 2. For comparison, we used the evaluation scores from the associated papers of the other popular methods. Otherwise, we generated resultant artery-vein masks and binary vessel segmentation masks from their implementation codes and evaluated them.
Evaluation scores of artery-vein classification and vessel segmentation from background on the test set of AV-DRIVE dataset. (All scores are reported in percentage. Top scores are highlighted in boldface).
| Methods | Artery-Vein Classification (%) | Vessel Segmentation from Background (%) | |||||||
|---|---|---|---|---|---|---|---|---|---|
| BACCAV | SEAV | SPAV | DiceV | DiceA | ACCVES | SEVES | SPVES | DiceVES | |
| MSGANet-RAV (GF+SVA) [ours] | 95.48 | 93.59 | 97.27 | 79.39 | 75.48 | 95.61 | 83.51 | 97.47 | 82.73 |
| MSGANet-RAV (GF) [ours] | 95.13 | 94.23 | 96.04 | 79.03 | 75.01 | 95.23 | 81.51 | 97.28 | 81.25 |
| VCNet21 [Experiment] | 89.29 | 85.79 | 92.78 | 73.89 | 67.94 | 94.43 | 81.53 | 95.62 | 79.71 |
| VCNet21[Paper] | 95.42 | 93.51 | 97.32 | 79.71 | 76.05 | 95.7 | 82.58 | 97.66 | 82.96 |
| TR-GAN20 | 95.46 | 94.53 | 96.31 | N/A | N/A | N/A | N/A | N/A | N/A |
| Ma et al.17 | 94.50 | 93.40 | 95.50 | N/A | N/A | 95.7 | 79.16 | 98.11 | N/A |
| Zhao et al.12 | 93.51 | 93.11 | 94.10 | N/A | N/A | N/A | N/A | N/A | N/A |
| Xu et al.10 | 92.30 | 92.90 | 91.50 | N/A | N/A | N/A | N/A | N/A | N/A |
| Xu et al.15 | 90.00 | N/A | N/A | N/A | N/A | 95.4 | 94.4 | 95.5 | N/A |
| U-Net23 [Baseline] | 91.22 | 91.45 | 90.83 | 75.86 | 70.89 | 95.41 | 83.19 | 97.13 | 81.62 |
| Estrada et al.11 | 93.50 | 93 | 94.10 | N/A | N/A | N/A | N/A | N/A | N/A |
| Dashtbozorg et al.34 | 87.40 | 90 | 84 | N/A | N/A | N/A | N/A | N/A | N/A |
Artery-Vein Classification: BAACAV: Balanced Accuracy, SEAV: Sensitivity, SPAV: Specificity, DiceV: F1 of Vein, DiceA: F1 of Artery.
Vessel Segmentation: ACCVES: Accuracy, SEVES: Sensitivity, SPVES: Specificity, DiceVES: F1 of Vessel.
VC-Net21[Experiment]: Reproduction from the program code provided in the paper. Excluded pre-processing on dataset image or post-processing on resultant maps for a fair and consistent comparison with all other techniques.
VC-Net21 [paper]: Results obtained from the paper. Results are reported with pre-processing on dataset images and post-processing on resultant maps.
N/A: Not available in the respective paper.
Table 3 reports the 95% confidence interval (CI) for the accuracy of artery vein classification and vessel segmentation from the background. It includes the performance scores MSGANet-RAV, state-of-the-art VCNET, baseline U-Net and other semantic segmentation architectures. Our MSGANet-RAV achieved 95% CI for artery-vein balanced classification accuracy from 90.34% to 95.96% and 94.39% to 96.57% for LEI-CENTRAL and AV-DRIVE, respectively. 95% CI for vessel segmentation accuracy was from 92.44% to 93.7% and 95.43% to 95.79%, respectively.
Classification accuracy confidence intervals (95% CI) of methods on the LEI-CENTRAL and AV-DRIVE dataset test subsets (All scores are reported in percent. Top scores are highlighted in boldface).
| Methods | Artery-Vein Classification (%) | Vessel Segmentation from Background (%) | ||
|---|---|---|---|---|
| LEI-CENTRAL | AV-DRIVE | LEI-CENTRAL | AV-DRIVE | |
| MSGANet-RAV (GF+SVA) [ours] | 90.34 - 95.96 | 94.39 - 96.57 | 92.44 - 93.7 | 95.43 - 95.79 |
| MSGANet-RAV (GF) [ours] | 89.73 - 95.39 | 94.03 - 96.23 | 92.11 - 93.45 | 95.07 - 95.39 |
| VCNet21 [Experiment] | 86.89 - 94.69 | 88.1 - 90.48 | 89.81 - 94.93 | 94.27 - 94.59 |
| U-Net23 [Baseline] | 84.44 - 89.98 | 89.84 - 92.6 | 90.76 - 92.2 | 95.24 - 95.58 |
| Deeplab19 | 85.25 - 91.15 | n/p | 90.72 - 92.24 | n/p |
| PspNet22 | 83.88 - 88.96 | n/p | 90.18 - 91.7 | n/p |
| SegNet24 | 82.17 - 88.95 | n/p | 90.58 - 91.98 | n/p |
n/p: not performed in our experiments.
In artificial intelligence, an ablation study evaluates the effective knowledge representation in each of its major parts (modules).35 It can also assess relative variation of classification performances due to the addition or removal of those parts. We evaluated a set of trained models for each ablated deep-learning network (network after deactivation of modules) on both datasets.
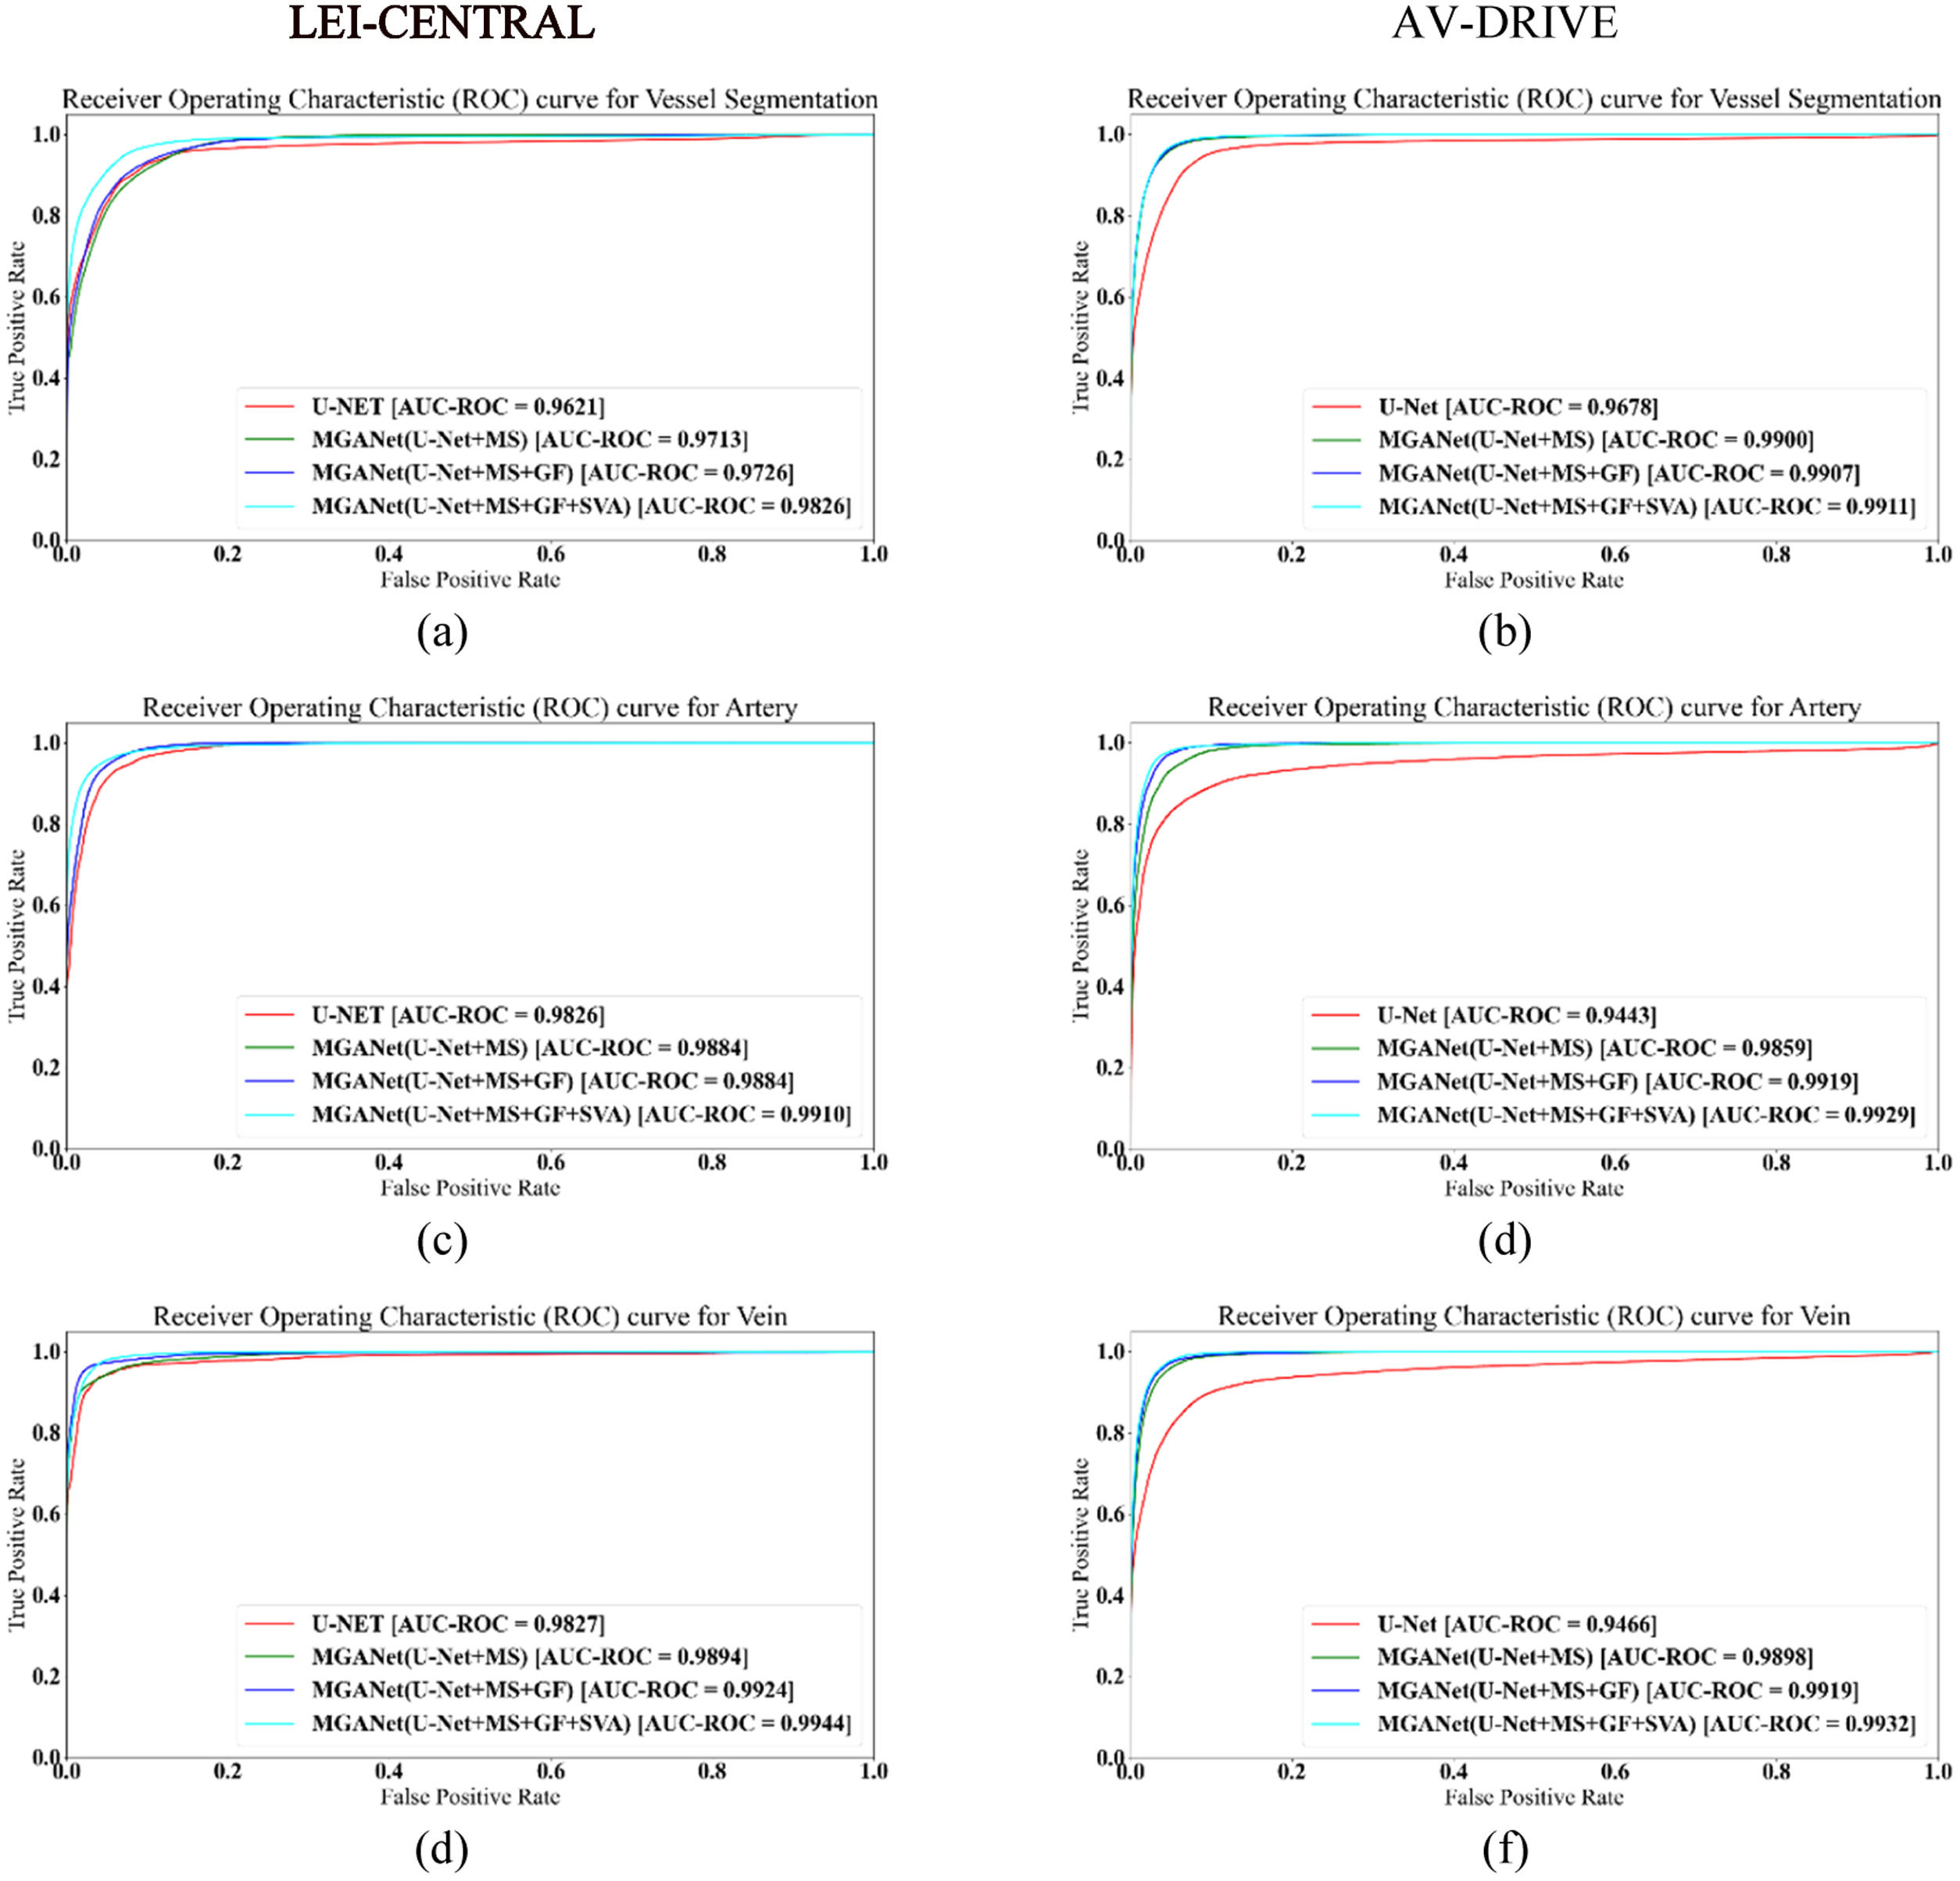
Table 4 reports the detailed ablation study for MSGANet-RAV on the removal of MS, GF and SVA modules. Models trained on LEI-CENTRAL and AV-DRIVE by combining all MSGANet-RAV modules achieved 93.15% and 95.38% of balanced accuracy, respectively, while the U-Net achieved 88.11% and 91.22%, respectively. For chronological deactivation of only SVA and both SVA and GF module, the balanced accuracy dropped to 92.56% and 89.27% for LEI-CENTRAL, and to 95.13% and 93.66% for AV-DRIVE. Fig. 5 shows receiver operating characteristic curves (ROC) for both tasks, artery-vein classification and vessel segmentation from the background, to validate the effectiveness of major modules in classifying each pixel (Fig. 5). Probabilities of the vein and artery classification for all pixels are considered thresholds. The area under these curves (AUC-ROC) for vessel segmentation and artery-vein classification from the MSGANet-RAV (GF+SVA) model on the LEI-CENTRAL test set are 0.9826, 0.9910 and 0.9939, respectively. AUC-ROC scores for vessel segmentation and artery-vein classification from MSGANet-RAV on the AV-DRIVE dataset are 0.9911, 0.9929 and 0.9932, respectively.
Ablation study of MSGANet-RAV on LEI-CENTRAL and AV-DRIVE datasets by artery-vein classification performances. (All scores are reported in percentage. ✓ symbol refers to active module. Top scores are highlighted in boldface).
Artery-Vein Classification: BACCAV: Balanced Accuracy, SEAV: Sensitivity, SPAV: Specificity
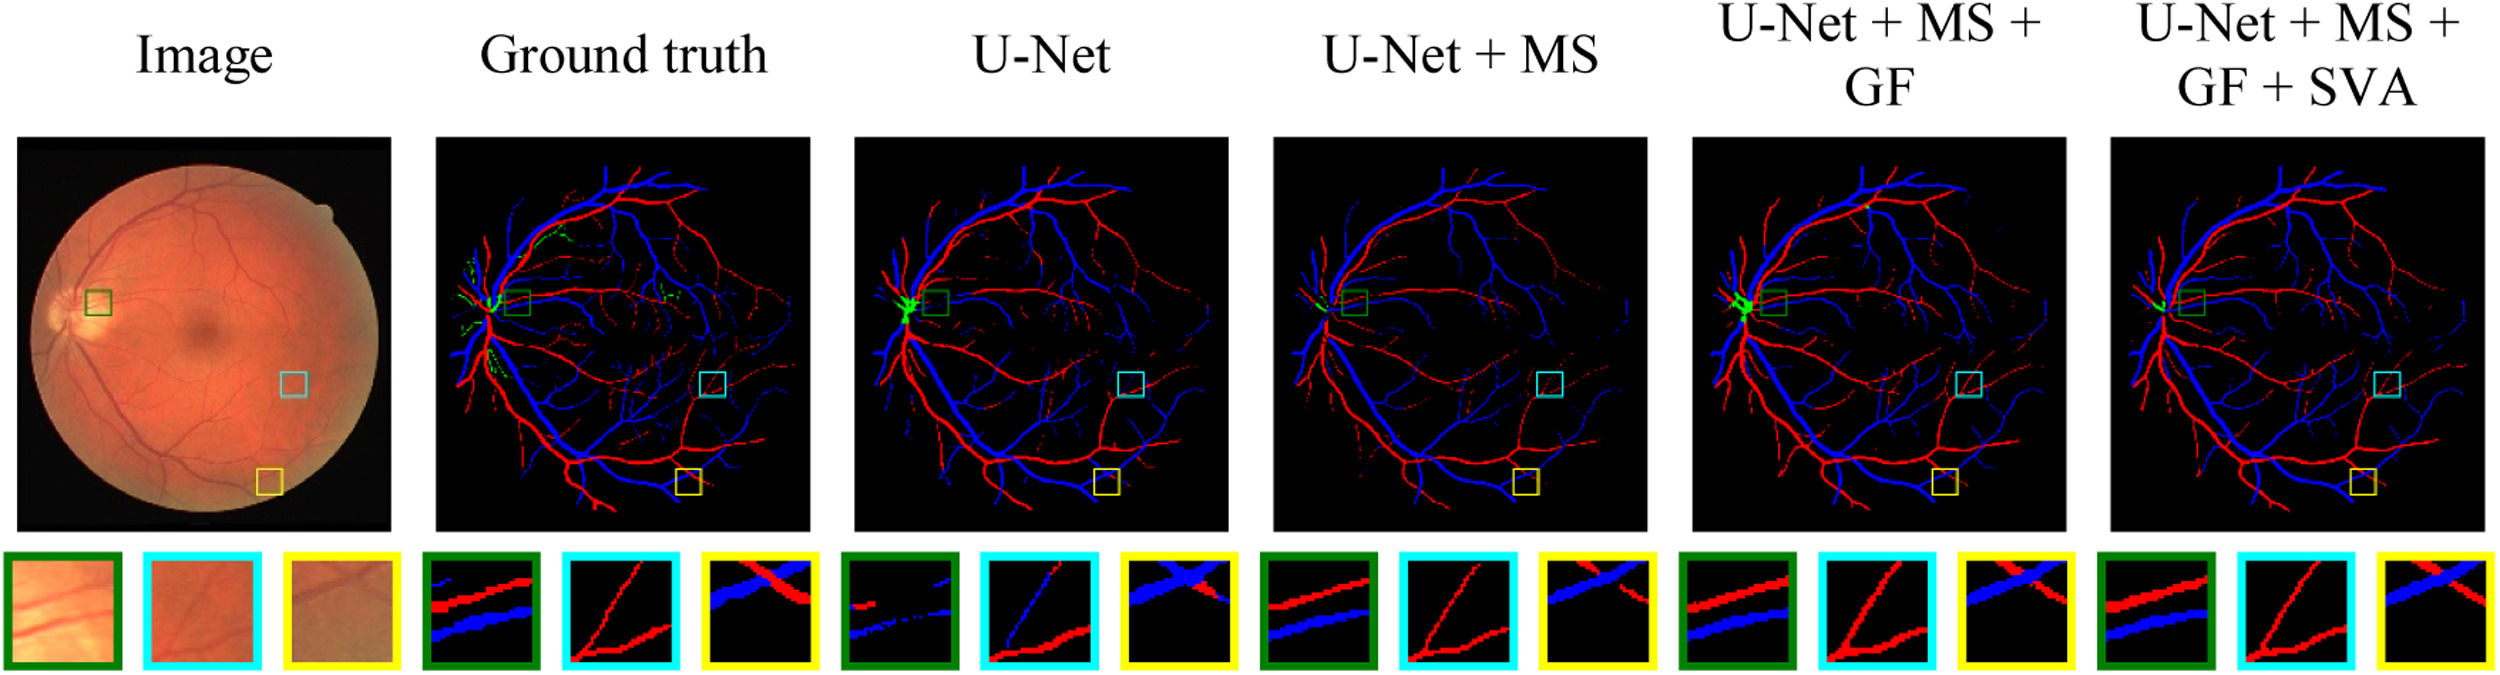
Fig. 4 illustrates a set of AI-generated artery-vein masks of a test example from the AV-DRIVE dataset by adding MS, GF and SVA modules with core U-Net (subjectively reverse ablation). It permits a visual assessment of the modules’ effectiveness on the pixel classification and segmentation from background over salient locations in an image. Three square regions (green, cyan and yellow) were selected to observe the continuity and boundary of central and thick vessels, and vessel intersections based on lost and mislabelled vessel pixels.

Artery-Vein classification maps of different modules for retinal fundus images from AV-DRIVE dataset. Three regions are enlarged in the second row. Artery and vein pixels are labelled with red and blue colours, respectively. Module components are added from left to right with baseline U-Net.
Our classification metrics—balanced accuracy, sensitivity, and specificity—are more focused on the artery-vein class than the background. Consequently these metrics penalize the scores if a specific pixel gets misclassified between artery-vein. The inclusion of background class does not reflect the accuracy of artery-vein classification because about 85% and 92% of image pixels are labelled background at public LEI-CENTRAL and AV-DRIVE datasets, respectively. The balanced accuracy was calculated from the average of specificity and sensitivity scores of artery-vein classification. Experimental results and evaluation scores show that our architecture achieved state-of-the-art performance in central optic disc superior and inferior artery-vein classification and central optic disc vessel segmentation (LEI-CENTRAL). Even all classification scores, including the dice scores of artery and vein and central vessel segmentation scores, are also superior to those of models from other comparing methods, as reported in Table 1. Therefore, we consider a U-Net model our baseline because the proposed MSGANet-RAV was developed following the U-Net23 structure. Although our core architecture followed a similar strategy of multiscale feature extraction to VCNet using Res2Net,29 our model has effectively emphasised the vessel boundaries with the help of a guided attention module. Optic disc central artery-vein classification balanced accuracy, sensitivity, and specificity of MSGANet-RAV model are 5.04%, 5.5% and 4.57% margins over the baseline model.23
This evaluation of artery-vein ground truth pixels in retinal fundus images (AV-DRIVE) is more challenging than on the already segmented vessels. Classification of vessels is relatively more complex in the presence of thin and capillary vessels. On the other hand, if segmentation and vessel classification is not required, major vessel pixels classification becomes easier. We evaluated the classification performance of our model on artery-vein ground truth pixels, while most other methods considered only segmented vessel pixels. Retinal artery-vein classification balanced accuracy, sensitivity, and specificity of MSGANet-RAV are 4.16%, 2.14% and 6.44% margins over the baseline.23 However, we reported the evaluation scores for state-of-the-art VCNet21 from our experiments and the paper. Our implementation (from the public repository of the author) gets lower scores for a few performance metrics than the scores reported in the referred paper.21 VCNet has implemented pre-processing on the dataset with contrast-limited histogram equalisation, gamma adjustment, and dataset-wise normalisation. However, the specific parameters for the hierarchical methodology of the pre-processing were unavailable. For this reason, we have not performed any pre-processing when applying VCNet to AV-DRIVE. Furthermore, such pre-processing is infeasible for the LEI-CENTRAL dataset due to notable differences (disc occupancy, dataset-wise contrast variation, dimension) in image content. We did not apply any pre-processing on dataset images or post-processing on artery-vein classification maps on both datasets because of having the above-mentioned issues and maintaining consistency with the model's generalisation capability on clinical images. MSGANet-RAV has a noteworthy classification improvement over the baseline U-Net.6 As reported in Table 4, 95% CI accuracy of MSGANet-RAV and U-Net are also non-overlapping for both tasks. Although the classification accuracy of MSGANet-RAV has a trivial improvement over State-of-the-art VCNet,5 we argue that a 1% improvement in pixel classification accuracy is correctness of classification for 2621 pixels on an image of 512×512 dimension.
The Ablation study in Table 4 also validates the effectiveness of MSGANet-RAV over the baseline and state-of-the-art architectures where both intervals of artery-vein classification and vessel segmentation are superior. However, undefined vessel pixels in AV-DRIVE mostly reflect capillaries and the vessels inside the optic disc. According to the authors of AV-DRIVE25, undefined vessel pixels lack distinguishable patterns to identify an artery or vein. However, these can be segmented from the background. Our deep-learning model labelled a pixel as undefined if the output did not have a maximum probability for either artery, vein or background classes, i.e., the model was trained and tested on four classes of pixels. According to our experimental results of VCNet without any processing steps reported in Table 2, our architecture achieves superior performance for the metrics compared to the latest VCNet and other models in the AV-DRIVE dataset.
We observed that some background and vessel structures likely have close feature representation due to higher scale convolution, pooling and inconsistent smoothing on the boundary between vessel and background without any attention to boundary and vessel. Incorporating GF improves boundary representation and relatively increases balanced accuracy, sensitivity and specificity by about 4.45%, 3.36%, and 5.53% for the LEI-CENTRAL dataset and 3.91%, 2.78%, and 5.21% for AV-DRIVE, respectively. SVA improves accuracy, although there are some trade-offs on sensitivity and specificity for both datasets. The balanced accuracy, sensitivity and specificity are relatively increased by about 5.04%, 5.5%, 4.57% for LEI-CENTRAL and 4.16%, 2.14% and 6.44% for AV-DRIVE, respectively. We infer the effectiveness of GF and SVA modules for retinal artery-vein classification because of a substantial margin over the baseline model. The area under the receiver operating characteristic curve (AUC-ROC) also gradually improves after incorporating the guided attention modules with baseline architecture (Table 4, Figs. 4 and 5).
 of the models from major MSGANet-RAV modules on LEI-CENTRAL and AV-DRIVE datasets. (a-b): semantic vessel segmentation; (c-f): artery-vein classification.")
We observed retinal bifurcating and crossover thick (central) and thin vessels in Fig. 4. All three selected regions (Fig. 4) in each masque show that the baseline model has more mislabelled pixels. First, the baseline U-Net model can lose segmentation pixels from big vessels (green region). Although MS recovered pixels, it still lacks some connecting pixels. With GA, structural vessel attention improved vessel segmentation and classification without losing segmentation pixels in big vessels. Thin and capillary vessels are hard to segment due to background-concentrated features. Hence, misclassification can be seen for those vessels in the cyan region. MSGANet-RAV has provided the correct segmentation and classification for such a bifurcating thin segment. The yellow region has crossover vessel segments that the baseline model misclassifies. Adding MS, GF and SVA modules with the core of baseline U-Net reduces the chance of such incidence by distinctive vessel features with the surrounding context. As shown in Fig. 4, MSGANet-RAV is more effective in classifying bifurcation, crossover and capillary vessels than the baseline.23 Therefore, MSGANet-RAV architecture is reasonably suitable for automatic semantic vessel segmentation from background and artery-vein classification tasks on both ophthalmic image datasets.
Although both datasets contain ophthalmoscopic images, the images show different degrees of vasculature detail in the retina. Central artery-vein classification and segmentation from the background from LEI-CENTRAL images are more challenging than for AV-DRIVE because of complex vessel topology around the optic nerve centre, large overlapping pixel blocks at bifurcating or crossover segments and the loss or fading appearance of vessels at the disc centre. The ground truth masque only reflects the central superior and inferior artery-vein while other vessels are considered to be of lesser importance like the background. Therefore, the evaluation scores (specifically sensitivity and dice scores) of classification and segmentation are inferior on LEI-CENTRAL compared to AV-DRIVE.
Vision degrading diseases such as glaucoma, DR, CRVO, IIH and macular degeneration are associated with vascular changes. For example, the artery-vein ratio is a marker of detecting and identifying the progression of DR and obstruction in the central retinal vein refers to the CRVO, which is more likely to be observed in patients with diabetes and other blood flow-related diseases. Accurate retinal vessel segmentation and artery-vein classification could be used to quantitatively analyse the vascular changes in retinal images and rapidly diagnose related diseases. Moreover, analysing vascular changes from temporally captured optic disc sequences could be used to assess pulse amplitude on optic disc veins and arteries to measure ICP non-invasively.8 Currently, external ventricular draining by creating holes in the skull and lumbar puncture are traditional approaches to measuring ICP. Such surgical procedures can introduce infections to the central nervous system and require special setup and observations. Our MSGANet-RAV could be a vital part of an automated non-invasive ICP measurement technique from the pulse amplitude analysis of optic disc vessels. This process currently depends on manual expert labelling of optic disc artery and vein. An automated and non-invasive ICP measurement could be useful when direct ICP measurement is not possible, such as in a traumatic brain injury when quick management of increased ICP could reduce the effect on the nervous system. Clinicians also could use such tools to rapidly observe the ICP correlate with underlying eye conditions such as swollen optic nerve, papilledema and IIH.
LimitationsOur model generally shows superior performance in optic disc central vessel classification and segmentation. However, there are a few cases where our model was not as effective. However, some regions are visibly indistinguishable from the nearby background pixels (Fig. 3, row 2). In such circumstances, arteries have become less distinguishable from the background due to the light intensity profile and retinal light reflex issue due to lack of haemoglobin. Models from all Table 1 architectures have resulted in poor classification maps for a few cases. MSGANet-RAV model comparatively generates better maps than other models. It should be noted that observers have considered the pulsations from the video to estimate the vessel boundary and class for the LEI-CENTRAL dataset. Therefore, an architecture capable of analysing sequential frames in a single image could be effective in such cases.
ConclusionThis paper proposes a multiscale guided attention network named MSGANet-RAV for pixel-wise retinal artery-vein classification. The proposed architecture employed a fusion of multiscale feature exploration and a sequence of GF and context learnable SVA modules. As a joint task of pixel identification of ophthalmic images, the model also included a learnable joint-task loss method where the weights of the individual task losses were balanced to improve the artery-vein classification. Multiscale features of these images were refined through the two-stage GA module. Structural information on variant vessels was explored at the first stage of GA. Later, more refined feature representations were obtained by contextual vessel information fusing with the vessel skeleton (probability map). MSGANet-RAV achieved state-of-the-art performance on the LEI-CENTRAL dataset and comparable performance on the AV-DRIVE dataset, using several benchmark metrics.
In future, MSGANet-RAV could be used in automated systems designed to quantitatively assess morphological and functional vascular changes in retinal and optic disc images. The method can be tested in clinical settings for early diagnosis and progression of sight-threatening conditions such as vascular occlusions, glaucoma, and diabetic retinopathy and for automated indirect measurement of ICP.
DisclosureProfessor William Huxley Morgan has a patent using the photo-plethysmography measurement of retinal vein pulsation to estimate intracranial pressure, US patent 10,368,759. The other authors have no proprietary or commercial interests in any product or concept discussed in the article.
This work is partially supported by a strategic partnership scholarship by Murdoch University and Lions Eye Institute, and an NHMRC project grant APP1162615.
https://developer.nvidia.com/cuda-11.0-download-archive?target_os=Linux
https://www.nvidia.com/en-au/deep-learning-ai/products/titan-rtx/
- Myopia progression in children during home confinement in the COVID-19 pandemic: A systematic review and meta-analysis
- Challenges and impact of COVID-19 lockdown on Indian optometry practice: A survey-based study
- Acute community ophthalmology services provided by independent prescribing optometrists supporting hospital eye services during the COVID-19 outbreak
- The impact of COVID-19 on global contact lens education
articles


www.publicationethics.org.


- Home
- All contents
- Publish your article
- About the journal
- Metrics
- Download PDF
- Bibliography
- Additional material