


The intrinsically photosensitive retinal ganglion cells (ipRGCs) signal environmental light, with axons projected to the midbrain that control pupil size and circadian rhythms. Post-illumination pupil response (PIPR), a sustained pupil constriction after short-wavelength light stimulation, is an indirect measure of ipRGC activity. Here, we measured the PIPR in young adults with various refractive errors using a custom-made optical system.
MethodsPIPR was measured on myopic (−3.50 ± 1.82 D, n = 20) and non-myopic (+0.28 ± 0.23 D, n = 19) participants (mean age, 23.36 ± 3.06 years). The right eye was dilated and presented with long-wavelength (red, 625 nm, 3.68 × 10¹⁴ photons/cm2/s) and short-wavelength (blue, 470 nm, 3.24 × 10¹⁴ photons/cm2/s) 1 s and 5 s pulses of light, and the consensual response was measured in the left eye for 60 s following light offset. The 6 s and 30 s PIPR and early and late area under the curve (AUC) for 1 and 5 s stimuli were calculated.
ResultsFor most subjects, the 6 s and 30 s PIPR were significantly lower (p < 0.001), and the early and late AUC were significantly larger for 1 s blue light compared to red light (p < 0.001), suggesting a strong ipRGC response. The 5 s blue stimulation induced a slightly stronger melanopsin response, compared to 1 s stimulation with the same wavelength. However, none of the PIPR metrics were different between myopes and non-myopes for either stimulus duration (p > 0.05).
ConclusionsWe confirm previous research that there is no effect of refractive error on the PIPR.
The ipRGCs are a distinct subtype of ganglion cells in the mammalian retina that contain a blue light-sensitive photopigment, melanopsin, with a peak sensitivity at ∼482 nm.1–3 These cells constitute only about 1–2% of the entire ganglion cell population, with widespread dendritic coverage across the entire retina, except the fovea.4,5 The ipRGCs are considered to be environmental irradiance detectors that can directly detect light levels through melanopsin, without any input from the rod and cone pathway.2,6 The ipRGC axons project to several brain centers and primarily regulate non-image forming functions, such as photoentrainment of circadian rhythms and controlling the pupillary light reflex (PLR).5–8 However, there is evidence that ipRGCs are also involved in image formation, contributing to contrast and colour detection and pattern vision.9–11
The stimulation of ipRGCs significantly influences retinal networks that are integral to the physiology of the retina and different visual functions.12 In addition to intrinsic activation, the ipRGCs also receive extrinsic synaptic input from rod and cone photoreceptors via bipolar cells.5,6 Studies have shown synaptic connections between dopaminergic amacrine cells and ipRGCs in the inner plexiform layer of the retina5,13 and evidence that these melanopsin cells may affect retinal dopamine release.14,15 Increased release of retinal dopamine through ON-bipolar cell activity inhibits experimental myopia in chicks16,17 and mice18 reared under high-intensity illumination.Furthermore, the protective effects of bright lighting on experimental myopia in primates19,20and guinea pigs21are believed to be mediated by light-induced increases in retinal dopamine release. Clinically, some characteristics of lighting have been hypothesised to influence human refractive development. Several cross-sectional and longitudinal studies have shown that children who spend more time outdoors have significantly reduced odds of myopia, which is believed to mediated by increased dopamine release in the retina.22–25 It is therefore possible that the ipRGCs and melanopsin may influence eye growth and myopia through changes in retinal dopamine.
Previously published research has found that rods, cones and ipRGCs control different phases of the PLR.1,26,27 With light stimulation, initial pupil constriction is primarily regulated by rod and cone photoreceptors,28 while the post-illumination pupil response (PIPR) following light offset is attributed to the ipRGCs.1,29 PIPR is characterised by a sustained constriction of the pupil following short-wavelength stimulation.1,29–31 This sustained miosis is attributed to prolonged firing of melanopsin cells following light offset.1 The PIPR has been reliably established as a robust biomarker for estimating the intrinsic activity of melanopsin cells.29,30,32 Impaired ipRGC function and PIPR has been recognised in several ocular diseases, including glaucoma,33 age-related macular degeneration,34 retinitis pigmentosa35 and diabetic retinopathy.36 Despite circumstantial evidence pointing towards a possible link between melanopsin function and refractive error development, previous studies have found no effect of refractive error on the ipRGC-driven PIPR in young adults and children.30,37,38 The goal of this study was to examine these previous findings using a custom-built optical system and measure the ipRGC-driven PIPR in a cohort of young adult myopic and non-myopic participants.
Material and methodsParticipantsThirty-nine myopic (n = 20, male = 8; female = 12), hyperopic (n = 5, male = 3; female = 2) and emmetropic (n = 14, male = 5; female = 9) participants between the ages of 20 and 35 years (mean age ± SD, 23.36 ± 3.06 years) were recruited to examine the association between the ipRGC-driven pupil response and refractive error. Prior to participation, all subjects underwent a comprehensive eye examination to assess their refractive status and ocular health. The mean spherical equivalent refraction (SER) was − 3.50 ± 1.82, +0.58 ± 0.23 and −0.02 ± 0.12 DS for participants in the myopic, hyperopic and emmetropic groups, respectively. None of the pupil metrics data were significantly different between the low hyperopic and emmetropic participants (p > 0.05, data not shown), and hence they were grouped together as one “non-myopic” group (n = 19; mean SER, +0.28 ± 0.23 DS). All subjects had normal visual acuity of 0.00 logMAR or better, and astigmatic refractive error of ≤1.00 DC. No participants had ocular pathology or a history of any major eye or refractive surgery.
No participants were taking any prescription medication known to affect the pupil size or sleep patterns (such as melatonin). In addition, participants were asked to refrain from alcohol, caffeine, and nicotine for 12 h prior to the pupil measurements. All participants were tested between 9:00 am and 12:00 pm to minimize the effects of circadian variation on ipRGC function and the PIPR.39 The study was approved by the Southern Adelaide Local Health Network (SALHN, ID: 156.17) ethics committee, and all participants provided written informed consent prior to their participation. All subjects were treated in accordance with the Declaration of Helsinki.
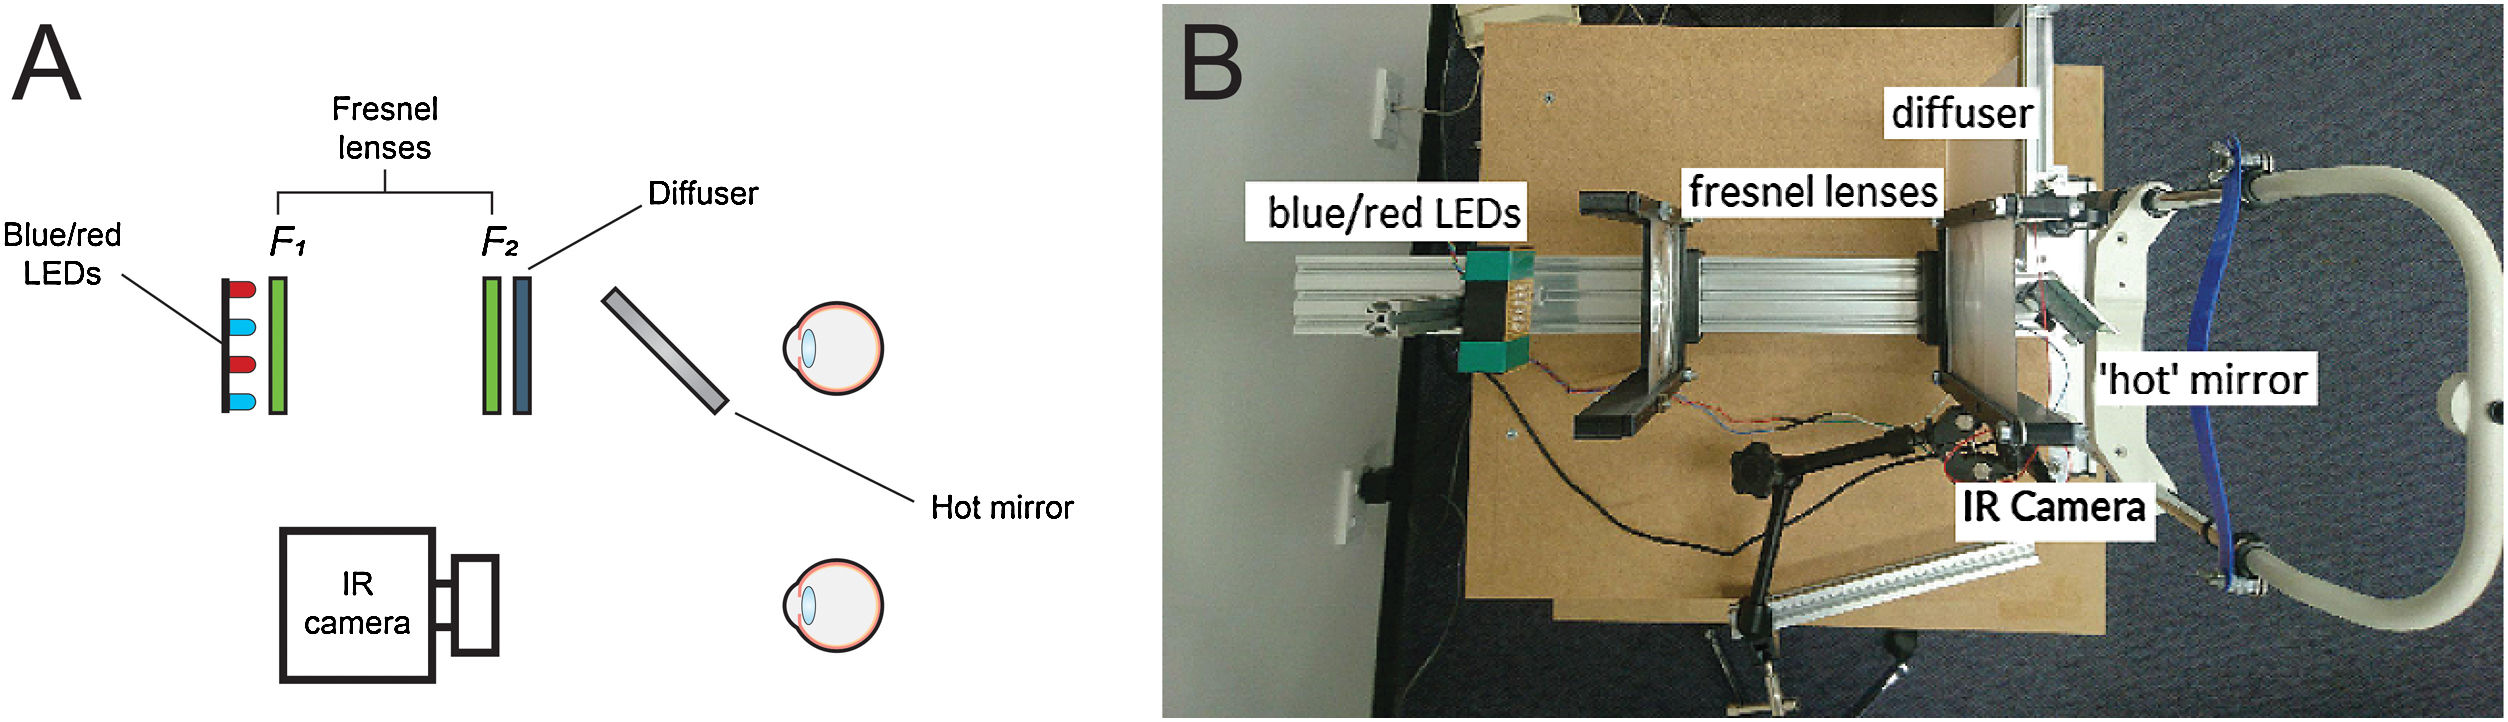
Optical system for pupil measurementsThe PIPR was measured using a custom-built optical system, similar to the one described by Kankipati et al.,31 as shown in Fig. 1A and B. The illumination system consisted of a set of red and blue light-emitting diodes (LEDs). The light from the red and blue LEDs was transmitted to the right eye via two Fresnel lenses; F1 and F2, each 10.16 cm in diameter and with a 10.16 cm focal length (Edmund Optics, Barrington, NJ). The blue (470 nm, 3 mm diameter, full width at half maximum [FWHM] 22 nm) and red LEDs (625 nm, 3 mm diameter, FWHM 20 nm) (Jaycar Electronics, Rydalmere, Australia) were positioned at the focal length of the first Fresnel lens, F1. The two Fresnel lenses were kept 20.32 cm apart (i.e. separated by twice their focal length). A 20.32 × 20.32 cm holographic diffuser of 5-degree diffusing angle (Edmund Optics, Barrington, NJ) was placed in front of the second Fresnel lens (F2), and the participant’s right eye was positioned at the focal point of F2. During the PIPR measurement, the right eye was presented with the light stimulus, and the effect of light stimulation was measured in the contralateral left eye. A modified Logitech C920 HD Pro webcam (Logitech, Newark, CA) with illuminating infrared LEDs (940 nm, 5 mm diameter, Core Electronics, NSW, Australia) was used to record the pupil responses from the left eye at a rate of 15 frames/s. The presentation of light stimulus and the duration of PIPR recording were controlled via a small single-board computer, Raspberry Pi 3 Model B (Core Electronics, NSW, Australia). During the experiment, the participants were positioned in a chinrest and instructed to look straight ahead at a small red laser spot on the wall at a distance of 4 m.
 and real image (B). Two Fresnel lenses, F1 and F2 (both 10.16 cm focal length and diameter), were placed at twice their focal length apart. Red and blue LEDs were placed at one end of the optical system. The subject’s dilated right eye was aligned at the other end, while the undilated left eye was recorded by the infrared camera (IR camera) attached to the computer. The diffuser had a 5 deg diffusing angle.")
Overview of the optical system used in the study; sketch (A) and real image (B). Two Fresnel lenses, F1 and F2 (both 10.16 cm focal length and diameter), were placed at twice their focal length apart. Red and blue LEDs were placed at one end of the optical system. The subject’s dilated right eye was aligned at the other end, while the undilated left eye was recorded by the infrared camera (IR camera) attached to the computer. The diffuser had a 5 deg diffusing angle.
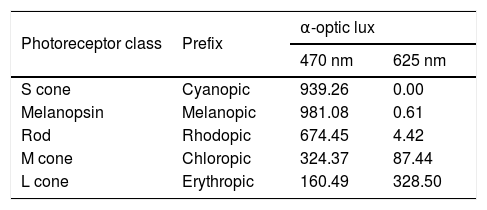
The red and blue LEDs illuminating the eye flickered at 10 Hz with a duty cycle of 80%. The two stimulus durations of 1 s and 5 s used in this study were within the range of previously published studies.29,37 The corneal irradiance levels, measured using an optical power meter (Newport Corporation, Irvine, CA), were 3.24 × 10¹⁴ photons/cm2/s for the blue stimulus (470 nm) and 3.68 × 10¹⁴ photons/cm2/s for the red stimulus (625 nm). These corneal irradiances were close to previously used irradiance levels in young, healthy participants.37,38,40Table 1 shows excitation for each photoreceptor class estimated using the toolbox provided by Lucas et al.41 The L cones have higher sensitivity to the 625-nm light, whereas melanopsin, rods, and S cones have higher excitation to the 470-nm light compared to L cones.
Individual photoreceptor excitation (α-optic lux) with 470 nm 3.24 × 10¹⁴ photons/cm2/s and 625 nm 3.68 × 10¹⁴ photons/cm2/s light stimuli (based on Lucas et al.41).
| Photoreceptor class | Prefix | α-optic lux | |
|---|---|---|---|
| 470 nm | 625 nm | ||
| S cone | Cyanopic | 939.26 | 0.00 |
| Melanopsin | Melanopic | 981.08 | 0.61 |
| Rod | Rhodopic | 674.45 | 4.42 |
| M cone | Chloropic | 324.37 | 87.44 |
| L cone | Erythropic | 160.49 | 328.50 |
On the day of experiment, the participant’s right eye was dilated with 1% Mydriacyl (tropicamide, Alcon, Fort Worth, TX) to ensure consistent retinal illumination within and between subjects during the PIPR measurement. After 20-minutes, all subjects were dark adapted for 5 min (∼2–5 lux) before commencing the pupil measurements. After dark adaptation, the right eye was presented with 1 and 5 s long-wavelength (red) and short-wavelength (blue) narrowband light stimuli while the consensual pupil response was measured in the undilated left eye as a measure of the ipRGC-induced PIPR, as shown in Fig. 2. The order of stimulus presentation was: 1 s red, 1 s blue, 5 s red, and 5 s blue. Testing with 1 s light pulses always preceded the 5 s pulses. Red and blue stimuli were alternated in all sessions, similar to previously published experiments,30 to control for the effect of melanopsin bistability.42 As light-induced melanopsin response could persist for up to 3–5 min after light offset,29,43 the 5-minute dark adaptation period between 1 s and 5 s trials was necessary to avoid potentiation of the response from previous light stimulation.44 Two repeats for each stimulus (470 nm and 625 nm) were recorded for each stimulus duration and were averaged for further analysis.
 was followed by a 10 s baseline and 1 s red stimulus with 60 s pupil measurements after stimulus offset. After another 10 s baseline, the same protocol was repeated for 1 s blue stimulus. Following 1 s measurements, a dark adaptation period of 5 min was observed before repeating the same protocol for 5 s red and blue stimuli. Two repeats for each stimulus (470 nm and 625 nm) were recorded for each stimulus duration and were averaged.")
Pupil stimulation protocols for the experiment. Dark adaptation (5 min) was followed by a 10 s baseline and 1 s red stimulus with 60 s pupil measurements after stimulus offset. After another 10 s baseline, the same protocol was repeated for 1 s blue stimulus. Following 1 s measurements, a dark adaptation period of 5 min was observed before repeating the same protocol for 5 s red and blue stimuli. Two repeats for each stimulus (470 nm and 625 nm) were recorded for each stimulus duration and were averaged.
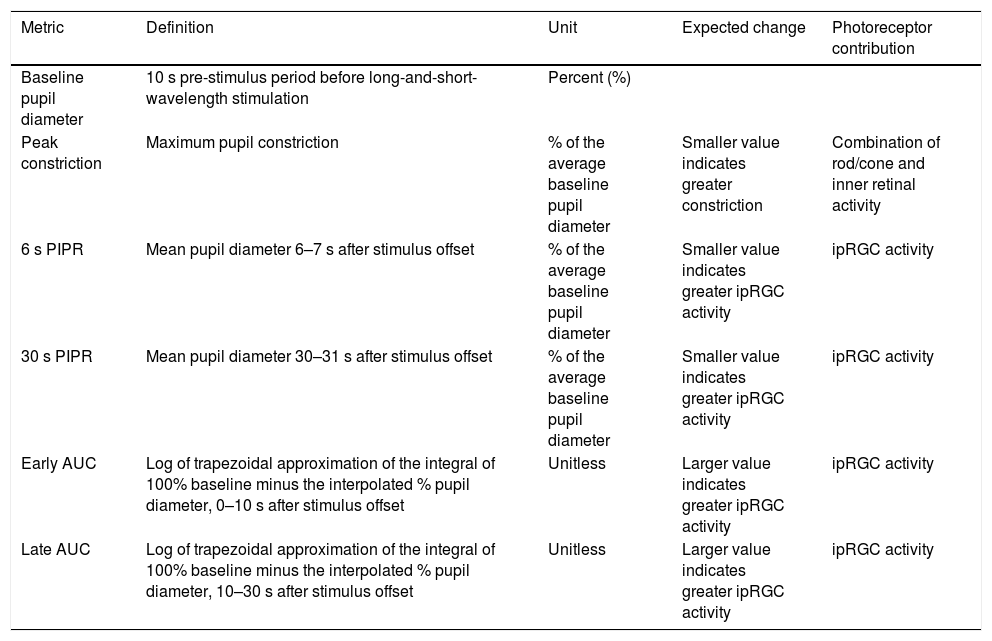
The change in pupil diameter in response to red and blue stimuli was measured from the pupil camera recordings using a custom Matlab program (Matlab 2017b, version 9.3, MathWorks, Natick, MA). For both 1 and 5 s trials, the Matlab program analysed the change in pupil area relative to the average baseline pupil area for each wavelength (i.e. the average of 10 s pre-stimulus period before red and blue stimulation). To calculate the pupil area, the Matlab algorithm cycled through each frame of the recording, and the ‘starburst’ algorithm was used to detect the pupil outline and fit an elliptical shape to the boundary. For each frame, the area of the ellipse was determined using the formula, A = a*b*pi (where a and b are the two semi-axes of the ellipse). Frames where an ellipse could not be detected due to blinks or poor fixation were automatically removed from the analysis. Data was smoothed using the moving average filter with a window of length 1 s. Finally, a time-stamped series of relative pupil responses was generated for further analysis. As outlined in Table 2, the PIPR was described by 5 metrics, the peak constriction, the 6 and 30 s PIPR, and the early and late area under the curve (AUC). These are well defined, robust and reliable metrics that have been frequently used by previous studies.29,37,38,45–47 All pupil metrics are shown as “normalized change” to the average baseline pupil diameter (expressed as a percentage). Whilst peak pupil constriction represents both rod/cone and inner retinal activity, the other four metrics are commonly used to describe the ipRGC activity.29,30
Pupil metrics used to quantify photoreceptor contributions to the post-illumination pupil response. Metrics include baseline pupil diameter (%), peak constriction (% of baseline), 6 s and 30 s post-illumination pupil response (PIPR, % of baseline) and early and late area under the curve (AUC, unitless).
| Metric | Definition | Unit | Expected change | Photoreceptor contribution |
|---|---|---|---|---|
| Baseline pupil diameter | 10 s pre-stimulus period before long-and-short-wavelength stimulation | Percent (%) | ||
| Peak constriction | Maximum pupil constriction | % of the average baseline pupil diameter | Smaller value indicates greater constriction | Combination of rod/cone and inner retinal activity |
| 6 s PIPR | Mean pupil diameter 6–7 s after stimulus offset | % of the average baseline pupil diameter | Smaller value indicates greater ipRGC activity | ipRGC activity |
| 30 s PIPR | Mean pupil diameter 30–31 s after stimulus offset | % of the average baseline pupil diameter | Smaller value indicates greater ipRGC activity | ipRGC activity |
| Early AUC | Log of trapezoidal approximation of the integral of 100% baseline minus the interpolated % pupil diameter, 0–10 s after stimulus offset | Unitless | Larger value indicates greater ipRGC activity | ipRGC activity |
| Late AUC | Log of trapezoidal approximation of the integral of 100% baseline minus the interpolated % pupil diameter, 10–30 s after stimulus offset | Unitless | Larger value indicates greater ipRGC activity | ipRGC activity |
Statistical analyses were performed using commercial software (SigmaStat 3.5, Aspire Software International, Ashburn, VA). For both 1 and 5 s stimulus durations, the difference in pupil metrics between myopes and non-myopes with red and blue stimuli were analysed with two-way analysis of variance (ANOVA) and Holm-Sidak post-hoc tests for statistical significance, using “refractive error” as the between-subjects factor and “wavelength” as the within-subjects factor. To determine the within-subject variability of the PIPR metrics, the intrasession coefficient of variation (CV or SD/mean) was calculated. The CV provides a reliable measurement of variability because it is dimensionless and is not affected by the changes in measurement units.48 A p-value of less than 0.05 was considered to be statistically significant. All data are expressed as mean ± standard error of mean (SEM).
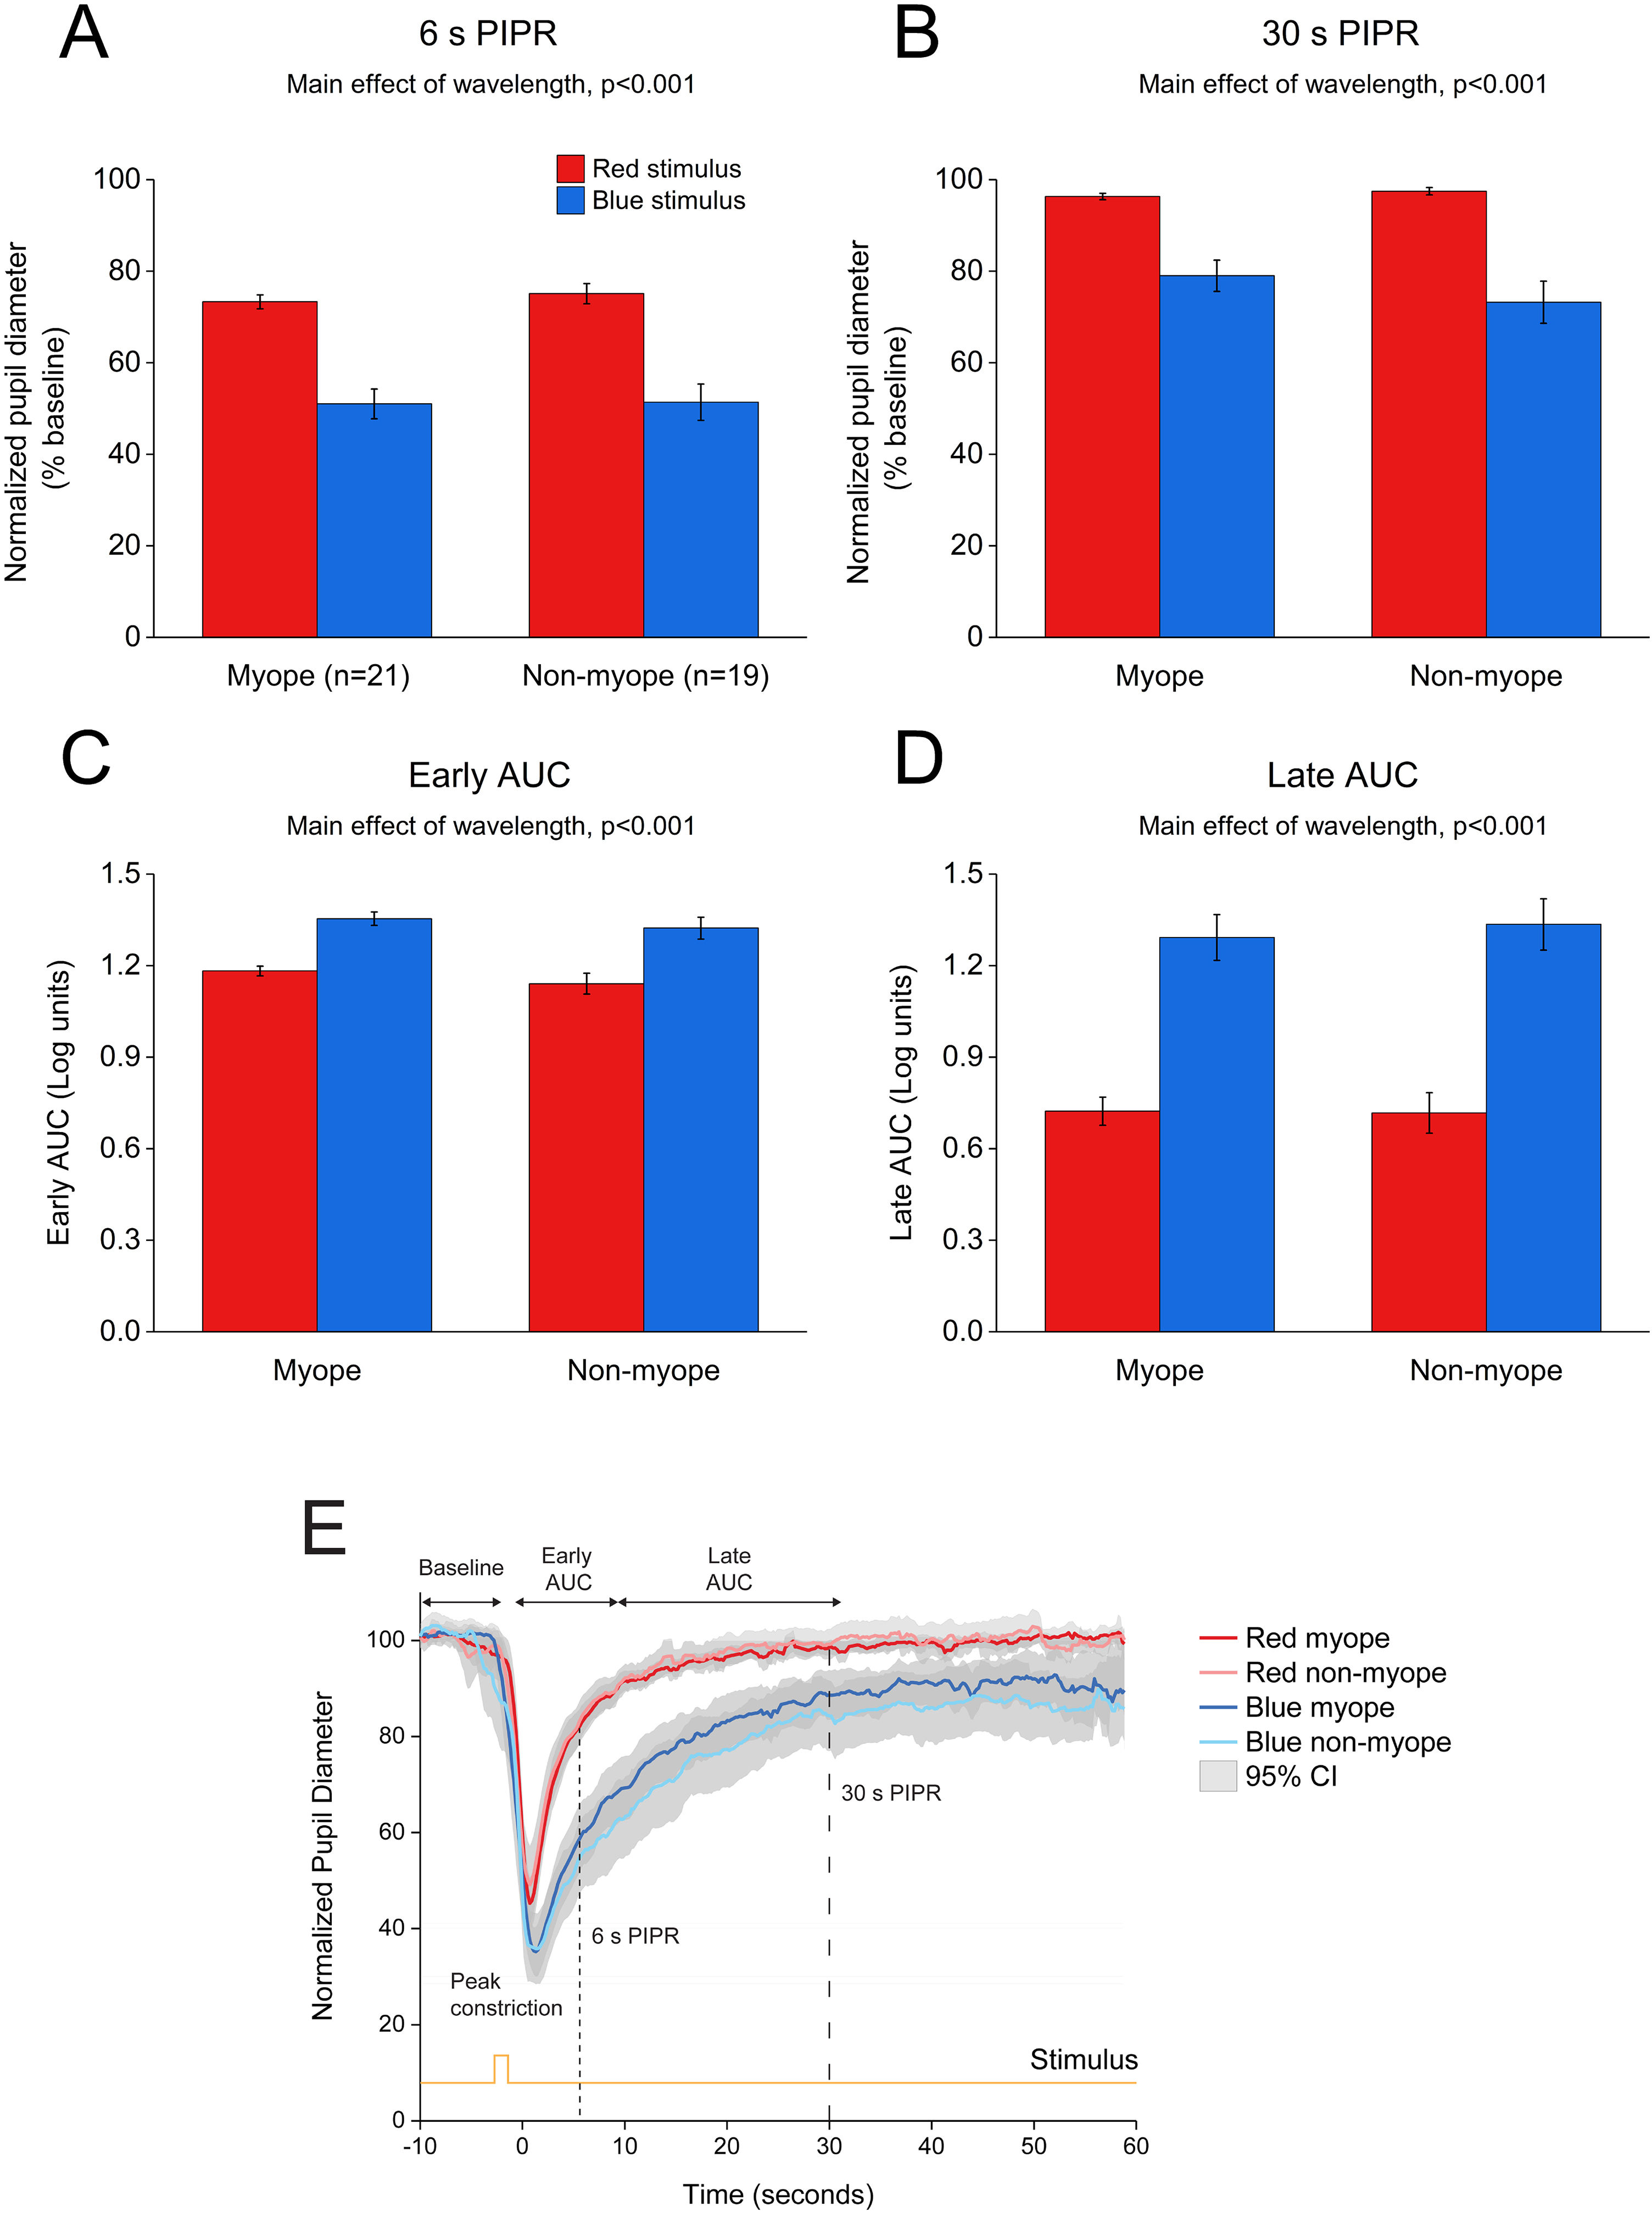
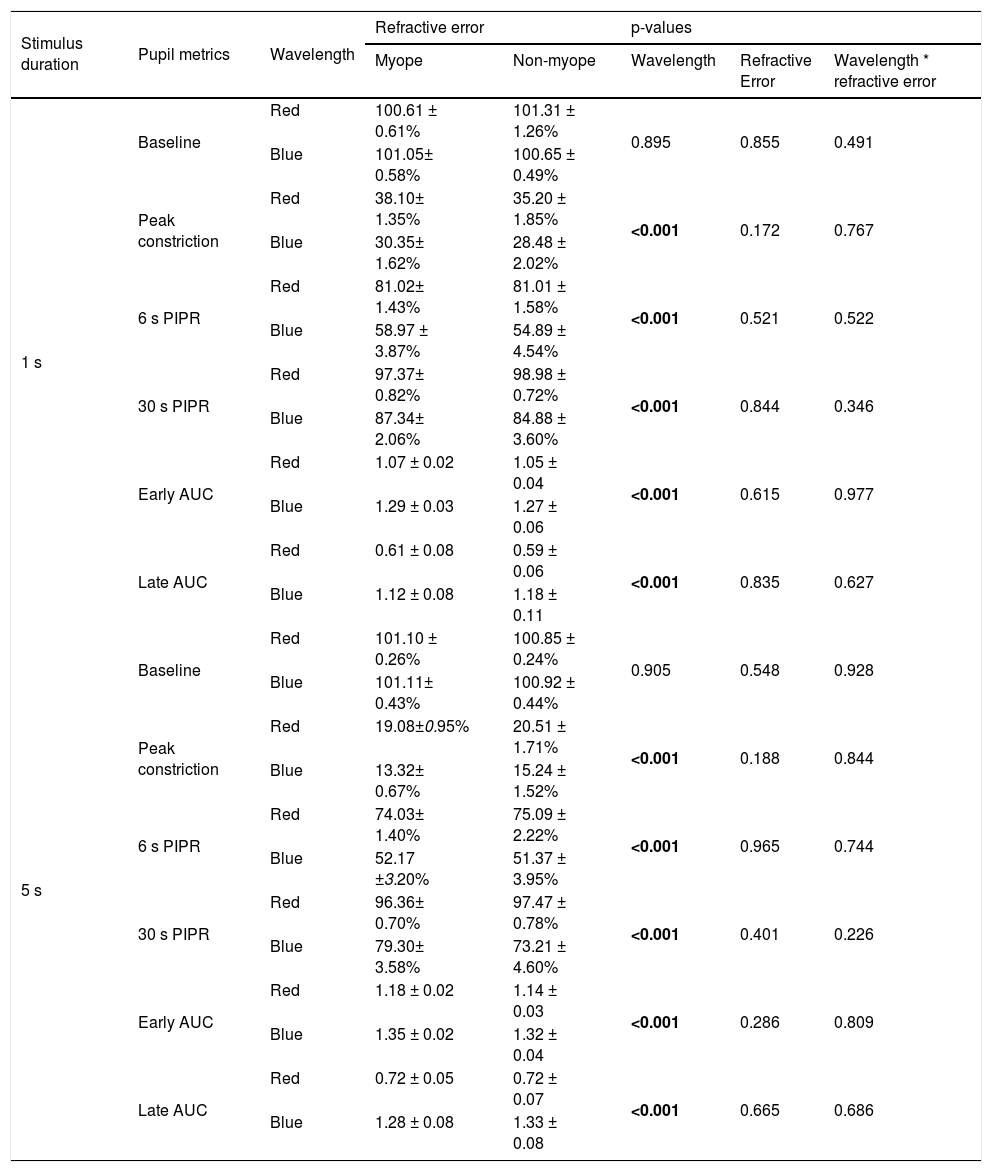
ResultsEffects of 1 and 5 s blue stimulation on the ipRGC-driven PIPRThe change in pupil metrics with 1 and 5 s long-wavelength (red) and short-wavelength (blue) stimuli for myopes and non-myopes is shown in Table 3. Following 5 min of dark adaptation, baseline pupil area of the undilated left eyes was not significantly different between 1 s red (mean ± SEM for the two refractive groups, 100.96 ± 0.94%) and blue stimuli (100.85 ± 0.53%, two-way ANOVA main effect of wavelength F(1,75) = 0.017, p = 0.895). For 36 participants (92%), pupils re-dilated rapidly after light offset following red stimulation; whereas, with blue stimulation the rate of re-dilation to the baseline pupil diameter was considerably slower (Fig. 3). Exposure to the blue stimulus caused a greater constriction of the pupil than the red stimulus (red stimulus, 36.65± 1.60%;blue stimulus, 29.42± 1.82%,two-way ANOVA main effect of wavelength, p < 0.001, Table 3). Compared to the 1 s red stimulus, the 6 s (red stimulus, 81.02± 1.51%; blue stimulus, 56.93± 4.20%) and 30 s PIPR (red stimulus, 98.18± 0.77%; blue stimulus 86.11± 2.83%) were significantly smaller for the blue stimulus across both refractive groups (two-way ANOVA main effect of wavelength, p < 0.001, Fig. 3A and B). In addition, the early (red stimulus, 1.06 ± 0.03, blue stimulus 1.28 ± 0.04) and late AUC (red stimulus, 0.60 ± 0.07, blue stimulus 1.15 ± 0.09) were significantly longer for the blue light than the red light (two-way ANOVA main effect of wavelength, p < 0.001, Fig. 3C and D). These results indicate a strong ipRGC-induced PIPR following short-wavelength stimulation.
Summary of pupil metrics for 1 s and 5 s red and blue stimuli for myopes and non-myopes, along with p-values from the two-way ANOVA illustrating the main effect of wavelength, refractive error and wavelength by refractive error interaction. Metrics include baseline pupil diameter (%), peak constriction (% of baseline), 6 s and 30 s post-illumination pupil response (PIPR, % of baseline) and early and late area under the curve (AUC, unitless). Significant p values (p < 0.05) are highlighted in bold.
| Stimulus duration | Pupil metrics | Wavelength | Refractive error | p-values | |||
|---|---|---|---|---|---|---|---|
| Myope | Non-myope | Wavelength | Refractive Error | Wavelength * refractive error | |||
| 1 s | Baseline | Red | 100.61 ± 0.61% | 101.31 ± 1.26% | 0.895 | 0.855 | 0.491 |
| Blue | 101.05± 0.58% | 100.65 ± 0.49% | |||||
| Peak constriction | Red | 38.10± 1.35% | 35.20 ± 1.85% | <0.001 | 0.172 | 0.767 | |
| Blue | 30.35± 1.62% | 28.48 ± 2.02% | |||||
| 6 s PIPR | Red | 81.02± 1.43% | 81.01 ± 1.58% | <0.001 | 0.521 | 0.522 | |
| Blue | 58.97 ± 3.87% | 54.89 ± 4.54% | |||||
| 30 s PIPR | Red | 97.37± 0.82% | 98.98 ± 0.72% | <0.001 | 0.844 | 0.346 | |
| Blue | 87.34± 2.06% | 84.88 ± 3.60% | |||||
| Early AUC | Red | 1.07 ± 0.02 | 1.05 ± 0.04 | <0.001 | 0.615 | 0.977 | |
| Blue | 1.29 ± 0.03 | 1.27 ± 0.06 | |||||
| Late AUC | Red | 0.61 ± 0.08 | 0.59 ± 0.06 | <0.001 | 0.835 | 0.627 | |
| Blue | 1.12 ± 0.08 | 1.18 ± 0.11 | |||||
| 5 s | Baseline | Red | 101.10 ± 0.26% | 100.85 ± 0.24% | 0.905 | 0.548 | 0.928 |
| Blue | 101.11± 0.43% | 100.92 ± 0.44% | |||||
| Peak constriction | Red | 19.08±0.95% | 20.51 ± 1.71% | <0.001 | 0.188 | 0.844 | |
| Blue | 13.32± 0.67% | 15.24 ± 1.52% | |||||
| 6 s PIPR | Red | 74.03± 1.40% | 75.09 ± 2.22% | <0.001 | 0.965 | 0.744 | |
| Blue | 52.17 ±3.20% | 51.37 ± 3.95% | |||||
| 30 s PIPR | Red | 96.36± 0.70% | 97.47 ± 0.78% | <0.001 | 0.401 | 0.226 | |
| Blue | 79.30± 3.58% | 73.21 ± 4.60% | |||||
| Early AUC | Red | 1.18 ± 0.02 | 1.14 ± 0.03 | <0.001 | 0.286 | 0.809 | |
| Blue | 1.35 ± 0.02 | 1.32 ± 0.04 | |||||
| Late AUC | Red | 0.72 ± 0.05 | 0.72 ± 0.07 | <0.001 | 0.665 | 0.686 | |
| Blue | 1.28 ± 0.08 | 1.33 ± 0.08 | |||||
 and non-myopes (n = 19). The 6 s (A) and 30 s (B) post-illumination pupil responses (PIPR) were significantly lower with the blue light compared to the red light (two-way ANOVA main effect of wavelength, p < 0.001). The early (C) and late (D) area under the curve (AUC) were significantly greater following blue light stimulation compared to red light stimulation (two-way ANOVA main effect of wavelength, p < 0.001). The PIPR values are shown as normalized change relative to the baseline pupil diameter; whereas the AUC values are shown in log units. None of the pupil metrics were significantly different between myopic and non-myopic participants (two-way ANOVA main effect of refractive error, p > 0.05). Error bars represent standard error of the mean. (E) Normalized change in pupil size for 1 s red and blue pulses across the two refractive groups. Pupil metrics include baseline, peak constriction, 6 s PIPR, 30 s PIPR, early AUC, late AUC. Shaded regions represent 95% confidence intervals. Stimulus is shown in yellow.")
Change in pupil metrics with 1 s red and blue stimulation for myopes (n = 20) and non-myopes (n = 19). The 6 s (A) and 30 s (B) post-illumination pupil responses (PIPR) were significantly lower with the blue light compared to the red light (two-way ANOVA main effect of wavelength, p < 0.001). The early (C) and late (D) area under the curve (AUC) were significantly greater following blue light stimulation compared to red light stimulation (two-way ANOVA main effect of wavelength, p < 0.001). The PIPR values are shown as normalized change relative to the baseline pupil diameter; whereas the AUC values are shown in log units. None of the pupil metrics were significantly different between myopic and non-myopic participants (two-way ANOVA main effect of refractive error, p > 0.05). Error bars represent standard error of the mean. (E) Normalized change in pupil size for 1 s red and blue pulses across the two refractive groups. Pupil metrics include baseline, peak constriction, 6 s PIPR, 30 s PIPR, early AUC, late AUC. Shaded regions represent 95% confidence intervals. Stimulus is shown in yellow.
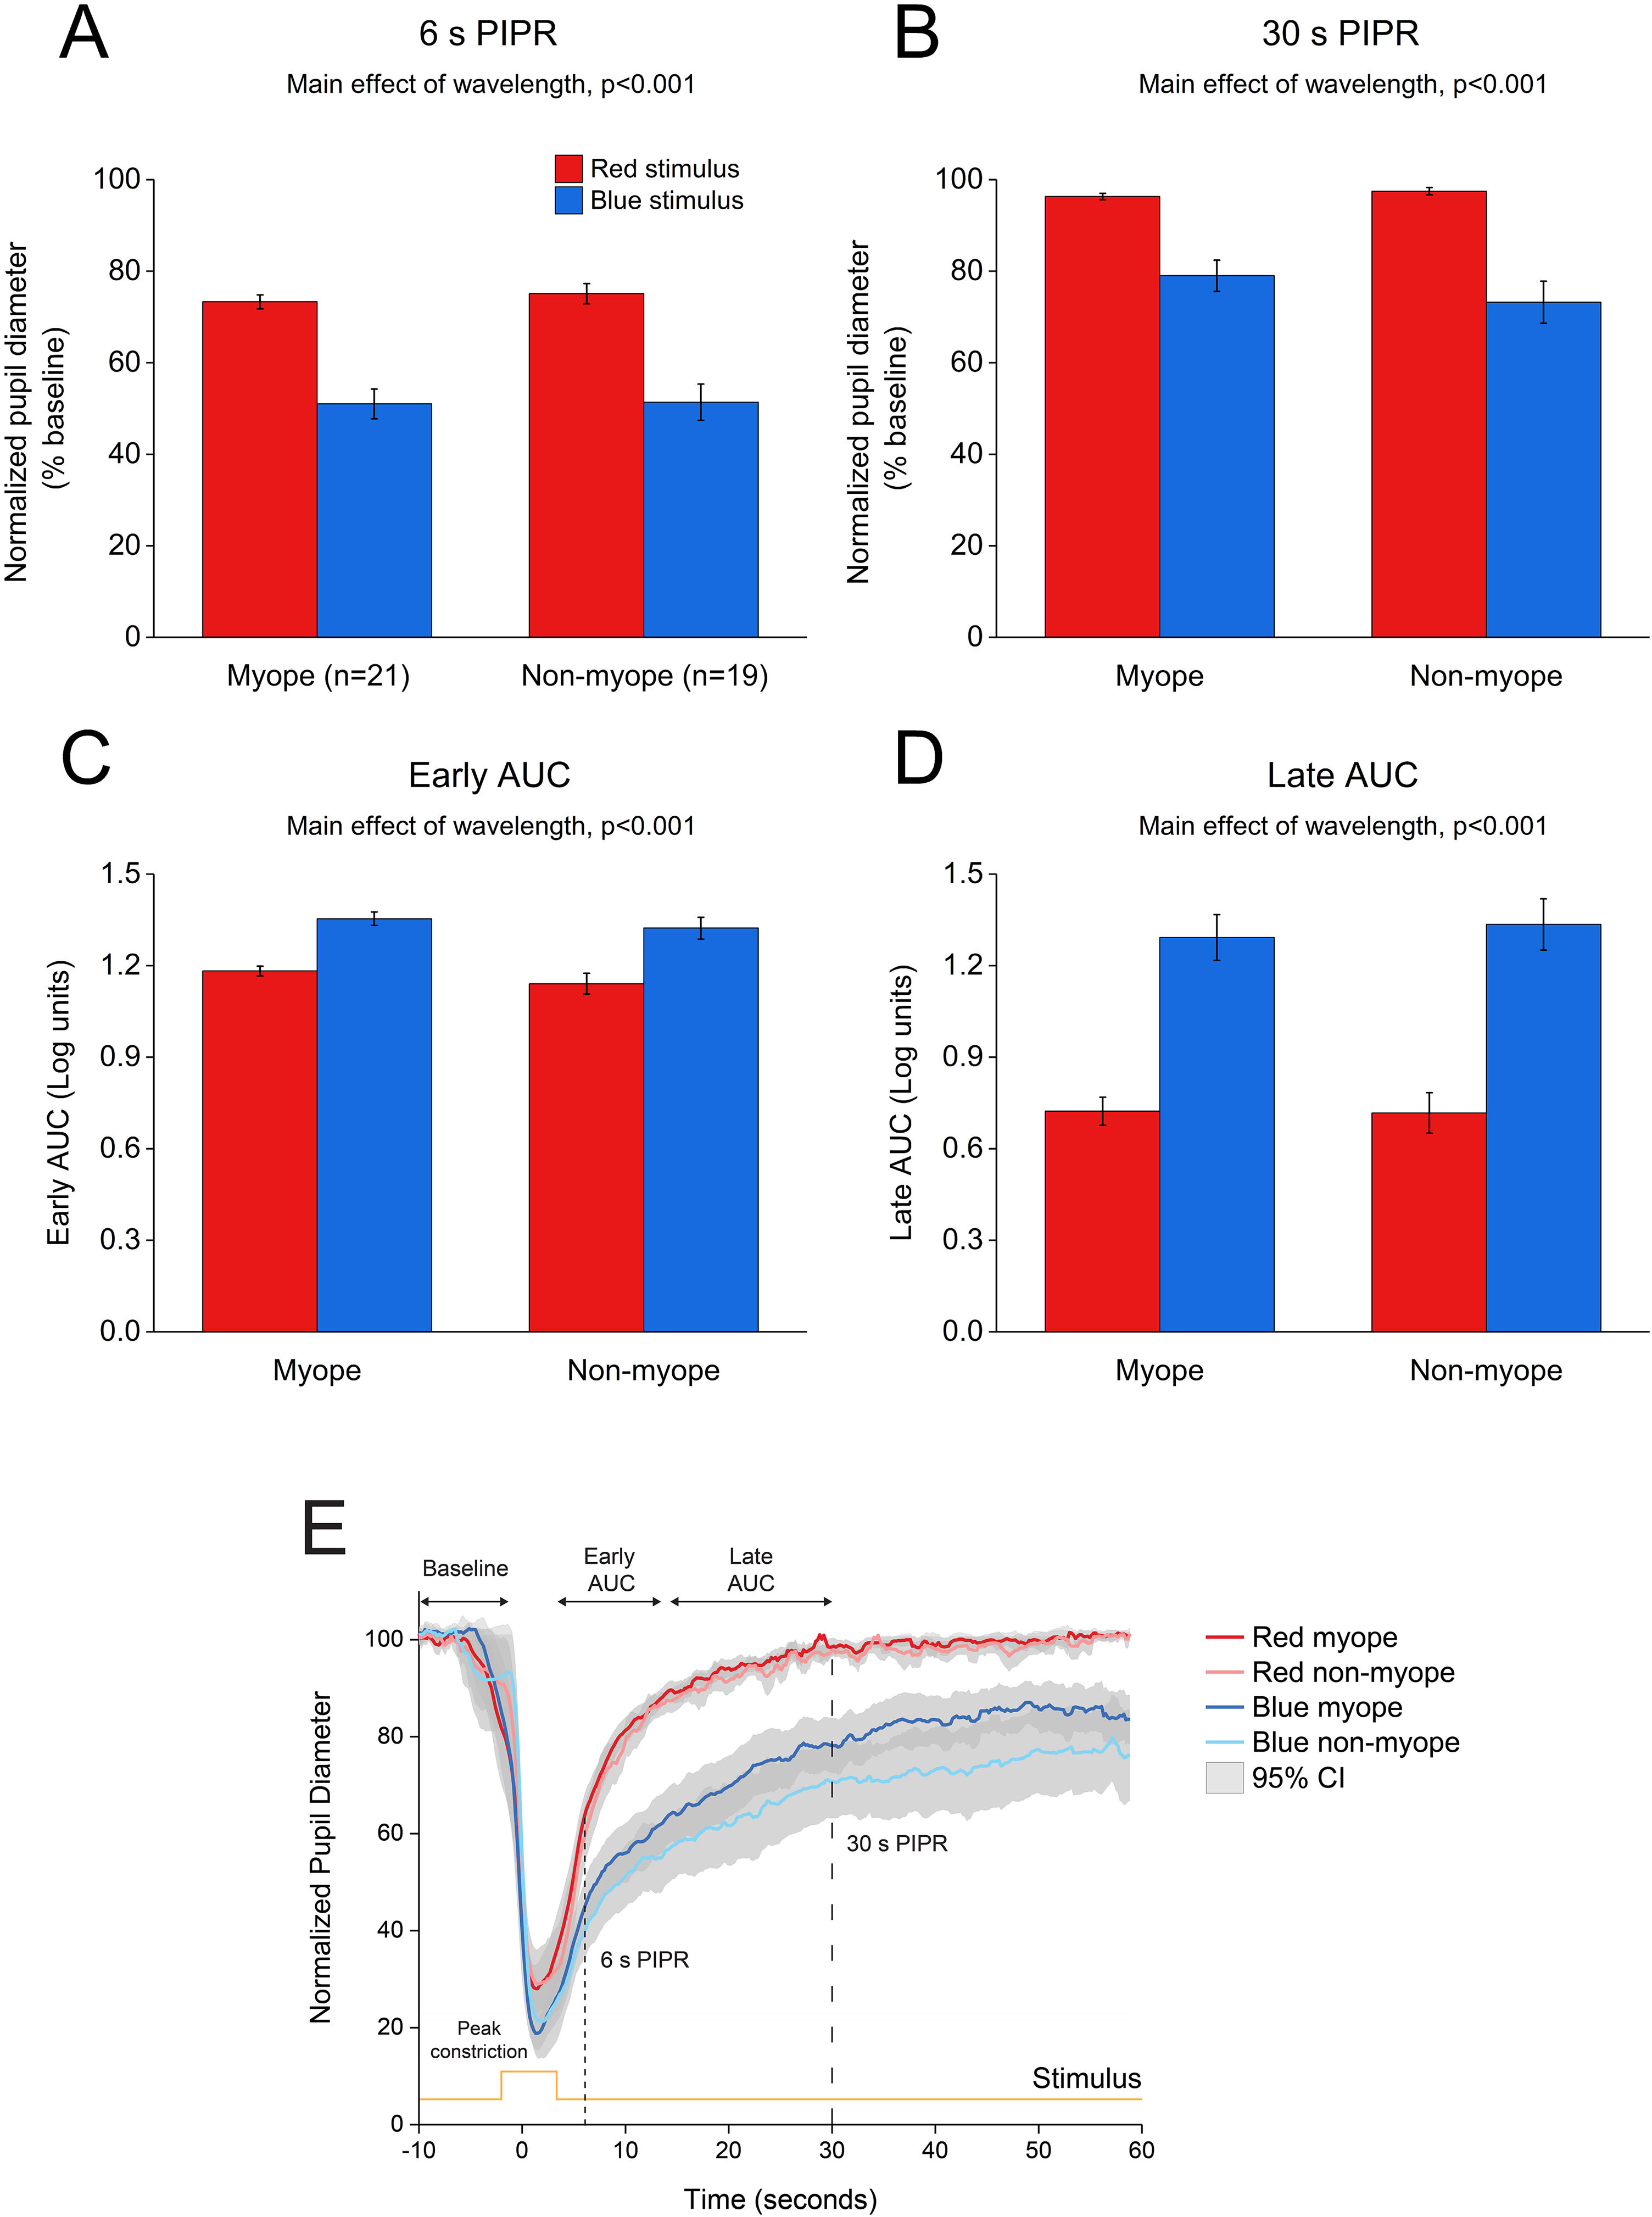
As illustrated in Fig. 4, 5 s blue stimulation induced a slightly stronger melanopsin response compared to 1 s stimulation with the same wavelength. All pupil metrics, including the peak constriction, the 6 s and 30 s PIPR, and the early and late AUC indicated a strong PIPR in response to blue stimulation for both groups (two-way ANOVA main effect of wavelength, p < 0.001 for all, Table 3).
 and non-myopes (n = 19). The 6 s (A) and 30 s (B) post-illumination pupil responses (PIPR) were significantly lower with the blue light compared to the red light (two-way ANOVA main effect of wavelength, p < 0.001). The early (C) and late (D) area under the curve (AUC) were significantly greater following blue light stimulation compared to red light stimulation (two-way ANOVA main effect of wavelength, p < 0.001). The PIPR values are shown as normalized change relative to the baseline pupil diameter; whereas the AUC values are shown in log units. None of the pupil metrics were significantly different between myopic and non-myopic participants (two-way ANOVA main effect of refractive error, p > 0.05). Error bars represent standard error of the mean. (E) Normalized change in pupil size for 5 s red and blue pulses across the two refractive groups. Pupil metrics include baseline, peak constriction, 6 s PIPR, 30 s PIPR, early AUC, late AUC. Shaded regions represent 95% confidence intervals. Stimulus is shown in yellow.")
Change in pupil metrics with 5 s red and blue stimulation for myopes (n = 20) and non-myopes (n = 19). The 6 s (A) and 30 s (B) post-illumination pupil responses (PIPR) were significantly lower with the blue light compared to the red light (two-way ANOVA main effect of wavelength, p < 0.001). The early (C) and late (D) area under the curve (AUC) were significantly greater following blue light stimulation compared to red light stimulation (two-way ANOVA main effect of wavelength, p < 0.001). The PIPR values are shown as normalized change relative to the baseline pupil diameter; whereas the AUC values are shown in log units. None of the pupil metrics were significantly different between myopic and non-myopic participants (two-way ANOVA main effect of refractive error, p > 0.05). Error bars represent standard error of the mean. (E) Normalized change in pupil size for 5 s red and blue pulses across the two refractive groups. Pupil metrics include baseline, peak constriction, 6 s PIPR, 30 s PIPR, early AUC, late AUC. Shaded regions represent 95% confidence intervals. Stimulus is shown in yellow.
As shown in Figs. 3 and 4, none of the pupil metrics were significantly different between myopic and non-myopic participants for either 1 s stimulus or 5 s stimulus (two-way ANOVA main effect of refractive error, p > 0.05 for all).
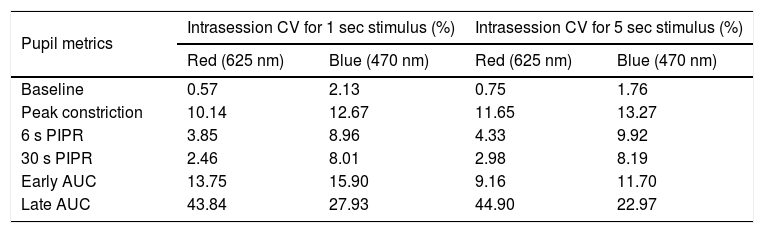
Intrasession variabilityTo quantify the within-subject variability in the PIPR metrics, we calculated the intrasession CV for each of the pupil metrics for both 1 and 5 s stimuli (Table 4 and Supplementary Figure A.1). For both the 1 and 5 s stimuli, the intrasession CV for the peak constriction and the 6 and 30 s PIPR were generally greater for the blue stimulus compared to the red stimulus, but they were all <20%, which is considered low and acceptable for PIPR measurements.29 The intrasession CV for both 1 and 5 s stimuli were significantly greater for AUC parameters, particularly for the late AUC with CV > 20% for both wavelengths (Supplementary Figure A.1).
Summary of the intrasession coefficient of variation (CV) for each of the PIPR metrics for both 1 and 5 s stimuli. Intrasession CV (expressed in %) was calculated as standard deviation/mean of the two long-wavelength (red) and two short-wavelength (blue) trials for each stimulus duration. Metrics include baseline pupil diameter, peak constriction, 6 s and 30 s post-illumination pupil response (PIPR), and early and late area under the curve (AUC).
| Pupil metrics | Intrasession CV for 1 sec stimulus (%) | Intrasession CV for 5 sec stimulus (%) | ||
|---|---|---|---|---|
| Red (625 nm) | Blue (470 nm) | Red (625 nm) | Blue (470 nm) | |
| Baseline | 0.57 | 2.13 | 0.75 | 1.76 |
| Peak constriction | 10.14 | 12.67 | 11.65 | 13.27 |
| 6 s PIPR | 3.85 | 8.96 | 4.33 | 9.92 |
| 30 s PIPR | 2.46 | 8.01 | 2.98 | 8.19 |
| Early AUC | 13.75 | 15.90 | 9.16 | 11.70 |
| Late AUC | 43.84 | 27.93 | 44.90 | 22.97 |
This study confirms previous findings that stimulation with 1 s and 5 s pulses of short-wavelength blue light generates a strong melanopsin-driven PIPR in young, healthy participants. Using a custom-built optical system, we have further validated that there is no effect of refractive error on the PIPR in young adults.30
In the current study, the optical system based on the design by Kankipati et al.31 effectively induced the melanopsin-driven PIPR in our participants. A number of previous studies using narrowband short-wavelength blue light (wavelength used across different studies, 448–470 nm) and similar irradiance levels to our study have shown a strong melanopsin response in young healthy subjects.29–31,37,38,40,45,49 In a comprehensive study, Adhikari et al. showed that the PIPR amplitude was largest with 1 s short-wavelength pulses (465 nm) of ≥12.8 log quanta.cm−2.s−1.29 Consistent with this observation, we were able to generate a strong PIPR using 1 s short-wavelength stimulus (470 nm) of 3.24 × 10¹⁴ photons/cm2/s (or 14.5 log quanta. cm−2.s−1 estimated using the toolbox by Lucas et al).41 For both 1 s stimulus and 5 s stimulus, pupil re-dilation was slower after blue stimulation compared to red stimulation. This is indicated by the smaller 6 and 30 s PIPR and larger early and late AUC values following blue light stimulation (Figs. 3 and 4). For both red and blue stimuli, all metrics were larger for 5 s stimulation compared to 1 s stimulation (i.e., lower PIPR values and higher AUC values as shown in Table 3), suggesting a stronger melanopsin response with the 5 s stimulus.37 Similarly, previous studies in humans29 and mice50 have also reported an increase in the PIPR duration with increasing stimulus duration, possibly due to increased light adaptation of melanopsin signaling over time.
Given the evidence of synaptic connections between the ipRGCs and dopaminergic amacrine cells in the inner retina,5,13 and the fact that dopamine agonists inhibit experimental and spontaneous myopia in chicks and guinea pigs,51,52 it has been hypothesised that the ipRGCs can modulate eye growth and myopia through changes in retinal dopamine levels. However, in agreement with earlier observations in children and adults,30,37,38 this study also found no effect of refractive error on the ipRGC-driven pupil response in this cohort of young adults. Future studies should examine the effects of other optical stimuli (such as optical defocus and light exposure) on the PIPR to further explore the potential association between the ipRGC pathways and refractive error.
Pupil size is influenced by several factors, including age, accommodation, psychological state, lighting, drugs and autonomic input.53 Several measures were taken in our experimental protocol to avoid any undue influence of these external factors on pupil measurements. This included using a quiet, dark room for measurements, presenting a distant fixation target to induce minimal accommodation, excluding subjects on prescription medication that may affect the pupil size, performing measurements at the same time of the day, and recruiting young participants (<40 years) to avoid the influence of age-related lenticular light scatter on the PIPR.45
We found that intrasession CV for both 1 and 5 s stimuli were generally lower for the 6 and 30 s PIPR (≤10%), and higher for the AUC parameters, particularly the late AUC (Supplementary Figure A.1). Previous studies have also reported differences in intrasession CV for different PIPR metrics.29,30,54 Importantly, other studies have also shown that the intrasession CV was found to be lower for the 6 s PIPR (≤20%), and higher for the early and late AUC (≥20%).30 Although the intrasession variability for the peak constriction, and the 6 and 30 s PIPR were slightly higher for the blue stimulus compared the red stimulus, they were all below 20%, which is considered acceptable for the PIPR metrics.29 The variability in the PIPR response can vary depending on the stimulus irradiance and size29; therefore, future experiments should consider these factors to control for the intrasession variability.
Similar to previous reports,29,37 we found that the L cones had higher sensitivity to the 625-nm light, whereas melanopsin, rods, and S cones had higher excitation to the 470-nm light (Table 1). This happens because all photoreceptors have distinct but overlapping spectral tuning, and even a monochromatic light matched to the peak spectral sensitivity of a given photoreceptor will stimulate other photoreceptors with similar spectral tuning.55 However, based on the relative differences in the individual photoreceptor excitations to red and blue stimuli, we can deduce a significant contribution of melanopsin cells to the PIPR following short-wavelength stimulation. Some studies have used the method of silent substitution that stimulate a specific photoreceptor class in the living human retina while leaving other classes unstimulated to examine the specific contribution of the melanopsin cells in the pupillary light response.55
In conclusion, the results of this study confirmed previous findings that stimulation with 1 s and 5 s pulses of short-wavelength blue light generates a strong PIPR in young adult participants. Similar to previous research, we found no effect of refractive error on any of the measured PIPR metrics.
FundingThis work was supported by the Flinders University College of Nursing and Health Sciences Establishment Grant [01.529.41820]; and the Contact Lens and Visual Optics Laboratory, Queensland University of Technology, Brisbane, Australia.
Declarations of interestNone.
NoteAspects of the article have been presented at the International Myopia Conference (IMC), September 2019 in Tokyo, Japan.
We would like to acknowledge Prof. Nicola Anstice, Flinders University, for careful editing of the manuscript.
The following is Supplementary data to this article:


