

Color vision and self-reported visual function in everyday life in young adults with Attention-Deficit/Hyperactivity Disorder (ADHD) were investigated.
MethodParticipants were 30 young adults with ADHD and 30 controls matched for age and gender. They were tested individually and completed the Visual Activities Questionnaire (VAQ), Farnsworth-Munsell 100 Hue Test (FMT) and A Quick Test of Cognitive Speed (AQT).
ResultsThe ADHD group reported significantly more problems in 4 of 8 areas on the VAQ: depth perception, peripheral vision, visual search and visual processing speed. Further analyses of VAQ items revealed that the ADHD group endorsed more visual problems associated with driving than controls. Color perception difficulties on the FMT were restricted to the blue spectrum in the ADHD group. FMT and AQT results revealed slower processing of visual stimuli in the ADHD group.
ConclusionA comprehensive investigation of mechanisms underlying visual function and color vision in adults with ADHD is warranted, along with the potential impact of these visual problems on driving performance.
Se investigó la visión de color y la función visual en la vida cotidiana auto-reportada de los jóvenes adultos con trastorno de déficit de atención con hiperactividad (TDAH).
MétodoParticiparon 30 jóvenes adultos con TDAH y 30 controles equiparados por edad y sexo. Fueron evaluados individualmente, debiendo completar el “Vision Activities Questionnaire (VAQ)-Cuestionario de Actividades Visuales, la prueba de 100 tonalidades de Farnsworth-Munsell (FMT) y una prueba rápida de velocidad cognitiva (AQT).
ResultadosEl grupo de TDAH reportó una proporción superior de problemas en 4 de las 8 áreas del VAQ: percepción de profundidad, visión periférica, búsqueda visual y velocidad de procesamiento visual. Los análisis adicionales de las cuestiones del VAQ revelaron que el grupo de TDAH reflejó más problemas visuales asociados a la conducción que el grupo de control. Las dificultades de percepción del color en la prueba FMT se restringieron al espectro del azul en el grupo de TDAH. Los resultados de FMT y AQT revelaron un procesamiento más lento de los estímulos visuales en el grupo de TDAH.
ConclusiónEstá garantizada una amplia investigación sobre los mecanismos subyacentes de la función visual y la visión de color con TDAH, junto con el impacto potencial de estos problemas visuales sobre la conducción.
Attention-Deficit/Hyperactivity Disorder (ADHD) is one of the most frequently diagnosed childhood psychiatric disorders, with worldwide prevalence rates estimated at 5.3%.1 A longitudinal study shows that approximately 65% of children with ADHD continue to show symptoms in adulthood.2,3 While adults with a history of ADHD may not meet the full criteria of symptoms listed in the DSM-IV, they continue to exhibit clinically significant symptoms.4 These continued symptoms are costly to society and the individual.5 For example, ADHD individuals were found to engage in higher risky driving behaviors and have more frequent car crashes.6–10
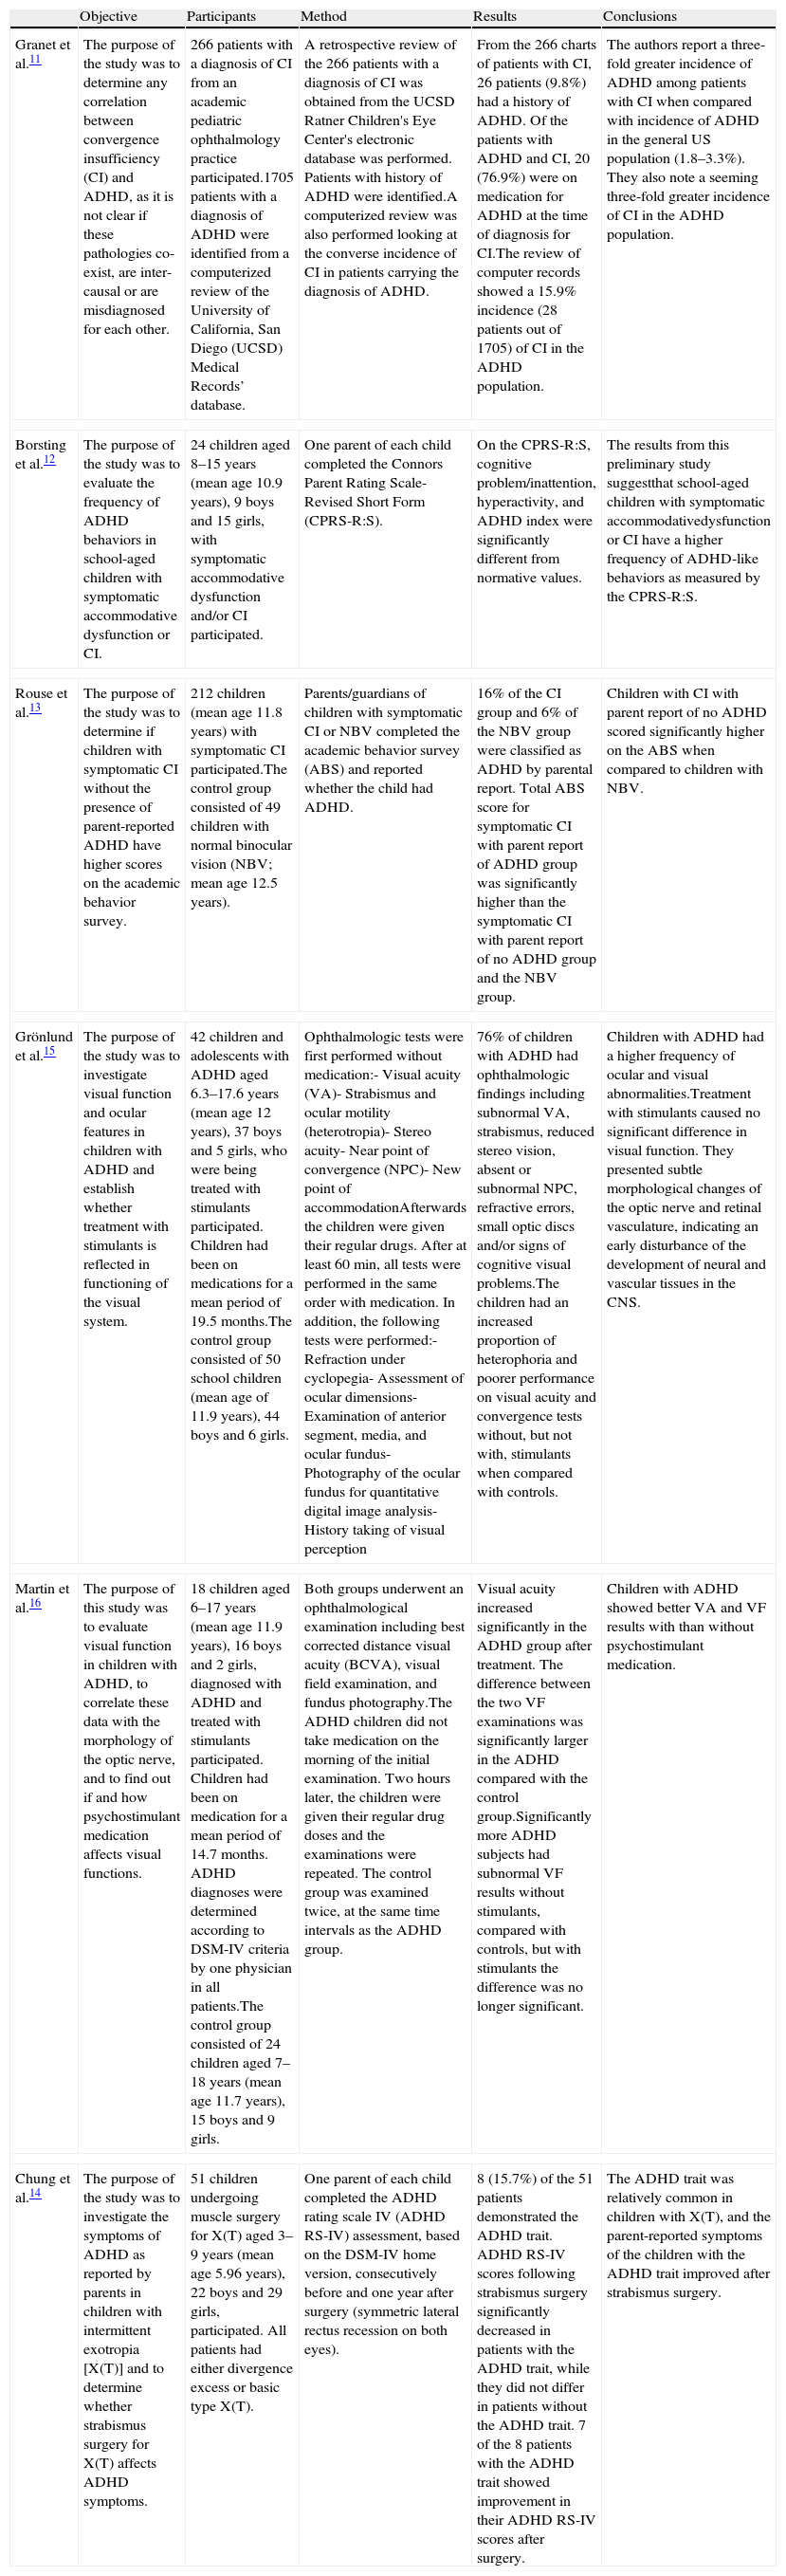
Current theories posit that executive function deficits account for poor outcomes in ADHD including driving problems. By contrast, we investigate a novel hypothesis that poor visual function might contribute to some of the negative outcomes. A review of the literature revealed several reports of ophthalmological problems in children with ADHD (see Table 1). For example, numerous studies report a significantly higher incidence of ADHD among children with convergence insufficiency.11–13 The ADHD trait was also found to be common in children with intermittent exotropia.14 Various visual function and ocular features including visual acuity, strabismus and ocular motility, near point of convergence and near point of accommodation were also tested in children with ADHD.15 The authors report that children with ADHD had a higher frequency of ocular and visual abnormalities, suggesting an early alteration of the development of neural and vascular tissues in central nervous system. Although Grönlund et al.15 found no effect of stimulant medication on visual function, another study reported that stimulant treatment seemed to improved visual field and best corrected distance visual acuity in children with ADHD.16
Literature summary on visual function in ADHD.
| Objective | Participants | Method | Results | Conclusions | |
| Granet et al.11 | The purpose of the study was to determine any correlation between convergence insufficiency (CI) and ADHD, as it is not clear if these pathologies co-exist, are inter-causal or are misdiagnosed for each other. | 266 patients with a diagnosis of CI from an academic pediatric ophthalmology practice participated.1705 patients with a diagnosis of ADHD were identified from a computerized review of the University of California, San Diego (UCSD) Medical Records’ database. | A retrospective review of the 266 patients with a diagnosis of CI was obtained from the UCSD Ratner Children's Eye Center's electronic database was performed. Patients with history of ADHD were identified.A computerized review was also performed looking at the converse incidence of CI in patients carrying the diagnosis of ADHD. | From the 266 charts of patients with CI, 26 patients (9.8%) had a history of ADHD. Of the patients with ADHD and CI, 20 (76.9%) were on medication for ADHD at the time of diagnosis for CI.The review of computer records showed a 15.9% incidence (28 patients out of 1705) of CI in the ADHD population. | The authors report a three-fold greater incidence of ADHD among patients with CI when compared with incidence of ADHD in the general US population (1.8–3.3%). They also note a seeming three-fold greater incidence of CI in the ADHD population. |
| Borsting et al.12 | The purpose of the study was to evaluate the frequency of ADHD behaviors in school-aged children with symptomatic accommodative dysfunction or CI. | 24 children aged 8–15 years (mean age 10.9 years), 9 boys and 15 girls, with symptomatic accommodative dysfunction and/or CI participated. | One parent of each child completed the Connors Parent Rating Scale-Revised Short Form (CPRS-R:S). | On the CPRS-R:S, cognitive problem/inattention, hyperactivity, and ADHD index were significantly different from normative values. | The results from this preliminary study suggestthat school-aged children with symptomatic accommodativedysfunction or CI have a higher frequency of ADHD-like behaviors as measured by the CPRS-R:S. |
| Rouse et al.13 | The purpose of the study was to determine if children with symptomatic CI without the presence of parent-reported ADHD have higher scores on the academic behavior survey. | 212 children (mean age 11.8 years) with symptomatic CI participated.The control group consisted of 49 children with normal binocular vision (NBV; mean age 12.5 years). | Parents/guardians of children with symptomatic CI or NBV completed the academic behavior survey (ABS) and reported whether the child had ADHD. | 16% of the CI group and 6% of the NBV group were classified as ADHD by parental report. Total ABS score for symptomatic CI with parent report of ADHD group was significantly higher than the symptomatic CI with parent report of no ADHD group and the NBV group. | Children with CI with parent report of no ADHD scored significantly higher on the ABS when compared to children with NBV. |
| Grönlund et al.15 | The purpose of the study was to investigate visual function and ocular features in children with ADHD and establish whether treatment with stimulants is reflected in functioning of the visual system. | 42 children and adolescents with ADHD aged 6.3–17.6 years (mean age 12 years), 37 boys and 5 girls, who were being treated with stimulants participated. Children had been on medications for a mean period of 19.5 months.The control group consisted of 50 school children (mean age of 11.9 years), 44 boys and 6 girls. | Ophthalmologic tests were first performed without medication:- Visual acuity (VA)- Strabismus and ocular motility (heterotropia)- Stereo acuity- Near point of convergence (NPC)- New point of accommodationAfterwards the children were given their regular drugs. After at least 60min, all tests were performed in the same order with medication. In addition, the following tests were performed:- Refraction under cyclopegia- Assessment of ocular dimensions- Examination of anterior segment, media, and ocular fundus- Photography of the ocular fundus for quantitative digital image analysis- History taking of visual perception | 76% of children with ADHD had ophthalmologic findings including subnormal VA, strabismus, reduced stereo vision, absent or subnormal NPC, refractive errors, small optic discs and/or signs of cognitive visual problems.The children had an increased proportion of heterophoria and poorer performance on visual acuity and convergence tests without, but not with, stimulants when compared with controls. | Children with ADHD had a higher frequency of ocular and visual abnormalities.Treatment with stimulants caused no significant difference in visual function. They presented subtle morphological changes of the optic nerve and retinal vasculature, indicating an early disturbance of the development of neural and vascular tissues in the CNS. |
| Martin et al.16 | The purpose of this study was to evaluate visual function in children with ADHD, to correlate these data with the morphology of the optic nerve, and to find out if and how psychostimulant medication affects visual functions. | 18 children aged 6–17 years (mean age 11.9 years), 16 boys and 2 girls, diagnosed with ADHD and treated with stimulants participated. Children had been on medication for a mean period of 14.7 months. ADHD diagnoses were determined according to DSM-IV criteria by one physician in all patients.The control group consisted of 24 children aged 7–18 years (mean age 11.7 years), 15 boys and 9 girls. | Both groups underwent an ophthalmological examination including best corrected distance visual acuity (BCVA), visual field examination, and fundus photography.The ADHD children did not take medication on the morning of the initial examination. Two hours later, the children were given their regular drug doses and the examinations were repeated. The control group was examined twice, at the same time intervals as the ADHD group. | Visual acuity increased significantly in the ADHD group after treatment. The difference between the two VF examinations was significantly larger in the ADHD compared with the control group.Significantly more ADHD subjects had subnormal VF results without stimulants, compared with controls, but with stimulants the difference was no longer significant. | Children with ADHD showed better VA and VF results with than without psychostimulant medication. |
| Chung et al.14 | The purpose of the study was to investigate the symptoms of ADHD as reported by parents in children with intermittent exotropia [X(T)] and to determine whether strabismus surgery for X(T) affects ADHD symptoms. | 51 children undergoing muscle surgery for X(T) aged 3–9 years (mean age 5.96 years), 22 boys and 29 girls, participated. All patients had either divergence excess or basic type X(T). | One parent of each child completed the ADHD rating scale IV (ADHD RS-IV) assessment, based on the DSM-IV home version, consecutively before and one year after surgery (symmetric lateral rectus recession on both eyes). | 8 (15.7%) of the 51 patients demonstrated the ADHD trait. ADHD RS-IV scores following strabismus surgery significantly decreased in patients with the ADHD trait, while they did not differ in patients without the ADHD trait. 7 of the 8 patients with the ADHD trait showed improvement in their ADHD RS-IV scores after surgery. | The ADHD trait was relatively common in children with X(T), and the parent-reported symptoms of the children with the ADHD trait improved after strabismus surgery. |
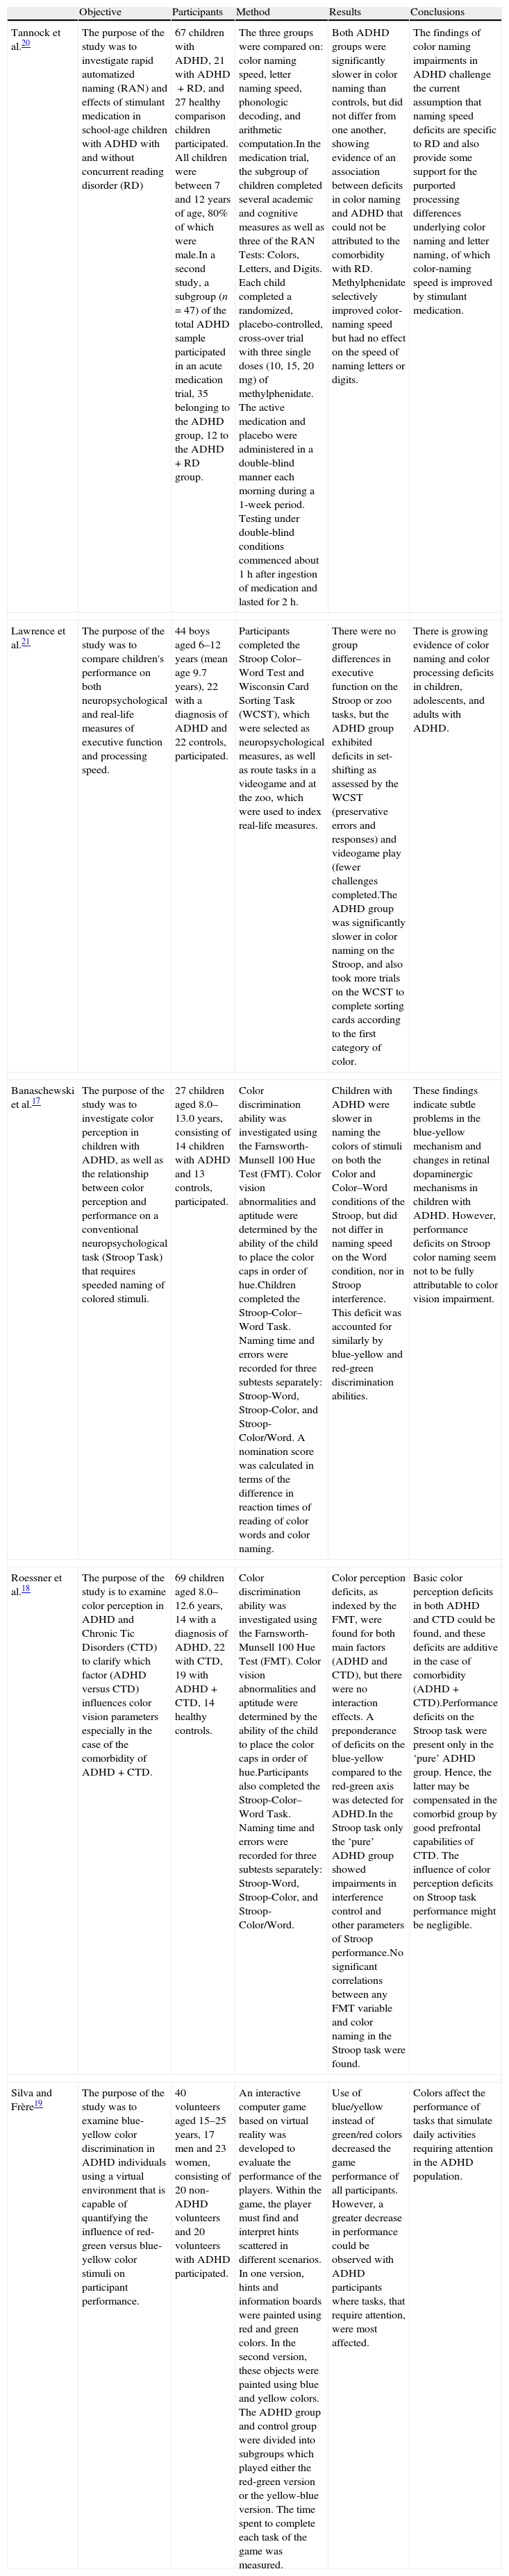
Not only have ophthalmological abnormalities been reported among individuals with ADHD, but also so have color perception deficiencies (see Table 2). Specifically, children with ADHD score poorly on clinical tests of blue color perception, but not red-green.17,18 Furthermore, children with ADHD show poorer game performance in a virtual environment when important on-screen information is displayed predominantly in blue-yellow colors compared to red-green colors.19 Several studies show decreased speed in color processing in ADHD population.20,21 Notably, the “retinal dopaminergic” hypothesis of color vision22 speculates that a deficiency in central nervous system (CNS) dopamine in ADHD may induce a hypo-dopaminergic tone in the retina, which in turn would have deleterious effects on short-wavelength (“blue”) cones. Blue cones are very sensitive to dopamine (as well as other neurochemical agents) and relatively scarce in number, so that the purported low dopaminergic tone in ADHD23 may affect blue-yellow color perception.
Literature summary on color vision in ADHD.
| Objective | Participants | Method | Results | Conclusions | |
| Tannock et al.20 | The purpose of the study was to investigate rapid automatized naming (RAN) and effects of stimulant medication in school-age children with ADHD with and without concurrent reading disorder (RD) | 67 children with ADHD, 21 with ADHD+RD, and 27 healthy comparison children participated. All children were between 7 and 12 years of age, 80% of which were male.In a second study, a subgroup (n=47) of the total ADHD sample participated in an acute medication trial, 35 belonging to the ADHD group, 12 to the ADHD+RD group. | The three groups were compared on: color naming speed, letter naming speed, phonologic decoding, and arithmetic computation.In the medication trial, the subgroup of children completed several academic and cognitive measures as well as three of the RAN Tests: Colors, Letters, and Digits. Each child completed a randomized, placebo-controlled, cross-over trial with three single doses (10, 15, 20mg) of methylphenidate. The active medication and placebo were administered in a double-blind manner each morning during a 1-week period. Testing under double-blind conditions commenced about 1h after ingestion of medication and lasted for 2h. | Both ADHD groups were significantly slower in color naming than controls, but did not differ from one another, showing evidence of an association between deficits in color naming and ADHD that could not be attributed to the comorbidity with RD. Methylphenidate selectively improved color-naming speed but had no effect on the speed of naming letters or digits. | The findings of color naming impairments in ADHD challenge the current assumption that naming speed deficits are specific to RD and also provide some support for the purported processing differences underlying color naming and letter naming, of which color-naming speed is improved by stimulant medication. |
| Lawrence et al.21 | The purpose of the study was to compare children's performance on both neuropsychological and real-life measures of executive function and processing speed. | 44 boys aged 6–12 years (mean age 9.7 years), 22 with a diagnosis of ADHD and 22 controls, participated. | Participants completed the Stroop Color–Word Test and Wisconsin Card Sorting Task (WCST), which were selected as neuropsychological measures, as well as route tasks in a videogame and at the zoo, which were used to index real-life measures. | There were no group differences in executive function on the Stroop or zoo tasks, but the ADHD group exhibited deficits in set-shifting as assessed by the WCST (preservative errors and responses) and videogame play (fewer challenges completed.The ADHD group was significantly slower in color naming on the Stroop, and also took more trials on the WCST to complete sorting cards according to the first category of color. | There is growing evidence of color naming and color processing deficits in children, adolescents, and adults with ADHD. |
| Banaschewski et al.17 | The purpose of the study was to investigate color perception in children with ADHD, as well as the relationship between color perception and performance on a conventional neuropsychological task (Stroop Task) that requires speeded naming of colored stimuli. | 27 children aged 8.0–13.0 years, consisting of 14 children with ADHD and 13 controls, participated. | Color discrimination ability was investigated using the Farnsworth-Munsell 100 Hue Test (FMT). Color vision abnormalities and aptitude were determined by the ability of the child to place the color caps in order of hue.Children completed the Stroop-Color–Word Task. Naming time and errors were recorded for three subtests separately: Stroop-Word, Stroop-Color, and Stroop-Color/Word. A nomination score was calculated in terms of the difference in reaction times of reading of color words and color naming. | Children with ADHD were slower in naming the colors of stimuli on both the Color and Color–Word conditions of the Stroop, but did not differ in naming speed on the Word condition, nor in Stroop interference. This deficit was accounted for similarly by blue-yellow and red-green discrimination abilities. | These findings indicate subtle problems in the blue-yellow mechanism and changes in retinal dopaminergic mechanisms in children with ADHD. However, performance deficits on Stroop color naming seem not to be fully attributable to color vision impairment. |
| Roessner et al.18 | The purpose of the study is to examine color perception in ADHD and Chronic Tic Disorders (CTD) to clarify which factor (ADHD versus CTD) influences color vision parameters especially in the case of the comorbidity of ADHD+CTD. | 69 children aged 8.0–12.6 years, 14 with a diagnosis of ADHD, 22 with CTD, 19 with ADHD+CTD, 14 healthy controls. | Color discrimination ability was investigated using the Farnsworth-Munsell 100 Hue Test (FMT). Color vision abnormalities and aptitude were determined by the ability of the child to place the color caps in order of hue.Participants also completed the Stroop-Color–Word Task. Naming time and errors were recorded for three subtests separately: Stroop-Word, Stroop-Color, and Stroop-Color/Word. | Color perception deficits, as indexed by the FMT, were found for both main factors (ADHD and CTD), but there were no interaction effects. A preponderance of deficits on the blue-yellow compared to the red-green axis was detected for ADHD.In the Stroop task only the ‘pure’ ADHD group showed impairments in interference control and other parameters of Stroop performance.No significant correlations between any FMT variable and color naming in the Stroop task were found. | Basic color perception deficits in both ADHD and CTD could be found, and these deficits are additive in the case of comorbidity (ADHD+CTD).Performance deficits on the Stroop task were present only in the ‘pure’ ADHD group. Hence, the latter may be compensated in the comorbid group by good prefrontal capabilities of CTD. The influence of color perception deficits on Stroop task performance might be negligible. |
| Silva and Frère19 | The purpose of the study was to examine blue-yellow color discrimination in ADHD individuals using a virtual environment that is capable of quantifying the influence of red-green versus blue-yellow color stimuli on participant performance. | 40 volunteers aged 15–25 years, 17 men and 23 women, consisting of 20 non-ADHD volunteers and 20 volunteers with ADHD participated. | An interactive computer game based on virtual reality was developed to evaluate the performance of the players. Within the game, the player must find and interpret hints scattered in different scenarios. In one version, hints and information boards were painted using red and green colors. In the second version, these objects were painted using blue and yellow colors. The ADHD group and control group were divided into subgroups which played either the red-green version or the yellow-blue version. The time spent to complete each task of the game was measured. | Use of blue/yellow instead of green/red colors decreased the game performance of all participants. However, a greater decrease in performance could be observed with ADHD participants where tasks, that require attention, were most affected. | Colors affect the performance of tasks that simulate daily activities requiring attention in the ADHD population. |
Numerous studies have reported possible visual deficiency including color perception in children with ADHD. However, it is unknown whether adults with ADHD also manifest problems in color vision or whether any visual problems have any functional impact in their everyday life. Accordingly, the aims of this preliminary study were to investigate visual function in everyday activities and color vision in adults with ADHD. Based on the retinal dopaminergic hypothesis, we hypothesized that adults with ADHD would show a specific color discrimination problem with blue colors.
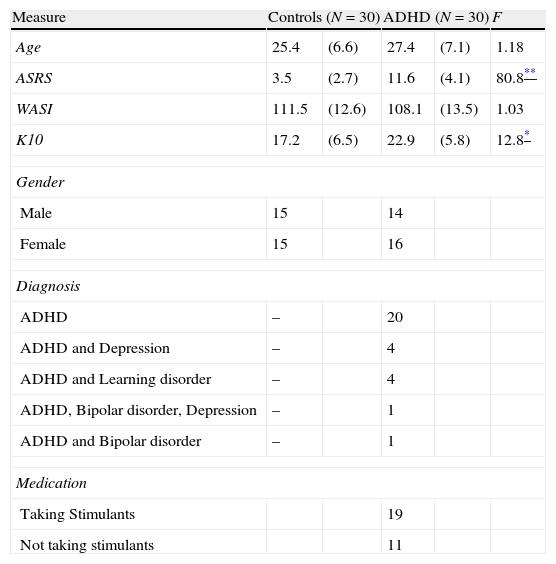
Materials and methodsParticipantsThirty young adults with a previously confirmed diagnosis of ADHD (mean age of 27 years; 47% male) and thirty healthy controls (mean age of 25 years; 50% male) participated in the study. Participants with ADHD were recruited from two sources: a student population registered with a local university's accessibilities services, which requires documented evidence of a confirmed diagnosis, and a national advocacy group for ADHD. In addition to the previously confirmed diagnosis of ADHD, current symptoms of ADHD were checked using the Adult ADHD Self-Report Scale (ASRS24). Participants were asked to report any comorbid disorders. Control participants were recruited through the same local university and community advertisements. Participants were excluded if they had below average intellectual functioning (below 80 in WASI-II), any known genetic vision problems, impaired visual acuity as measured by the Snellen eye chart (despite corrected vision), or current treatment of a severe psychiatric disorder other than ADHD. Participants with ADHD who were being treated with stimulant medication (n=19; 63%) were requested to stop any stimulant medication for at least 12h prior to the study (Table 3).
Demographic and clinical characteristics of participants with ADHD and controls.
| Measure | Controls (N=30) | ADHD (N=30) | F | ||
| Age | 25.4 | (6.6) | 27.4 | (7.1) | 1.18 |
| ASRS | 3.5 | (2.7) | 11.6 | (4.1) | 80.8** |
| WASI | 111.5 | (12.6) | 108.1 | (13.5) | 1.03 |
| K10 | 17.2 | (6.5) | 22.9 | (5.8) | 12.8* |
| Gender | |||||
| Male | 15 | 14 | |||
| Female | 15 | 16 | |||
| Diagnosis | |||||
| ADHD | – | 20 | |||
| ADHD and Depression | – | 4 | |||
| ADHD and Learning disorder | – | 4 | |||
| ADHD, Bipolar disorder, Depression | – | 1 | |||
| ADHD and Bipolar disorder | – | 1 | |||
| Medication | |||||
| Taking Stimulants | 19 | ||||
| Not taking stimulants | 11 | ||||
Note. Standard deviations appear in parentheses beside means.
The study was approved by the Institutional Research Ethics Board and all participants provided written informed consent prior to the testing.
Adult ADHD Self-Report Scale (ASRS v1.124): The ASRS was administered to assess current ADHD symptoms. The ASRS is an instrument consisting of eighteen questions based on the criteria used for diagnosing ADHD in the DSM-IV-TR. Scores for each item were added to calculate a total score. The ASRS is a reliable and valid scale for evaluating ADHD in adults.25 It has high internal consistency (Cronbach's alpha 0.88 and 0.89, for both patient and rater-administered versions, respectively) and high concurrent validity with the rater-administered ADHD Rating Scale.
Wechsler Abbreviated Scale of Intelligence II (WASI-II26): Scores from both the Vocabulary and Matrix Reasoning tasks were summed to give an estimated IQ score.
Kessler Psychological Distress Scale (K1027): The K-10 was used to examine recent emotional distress. The K10 is a 10-item questionnaire based on questions about anxiety and depressive symptoms that a person has experienced in the most recent 4-week period. Scores for each item were added to calculate a global measure of distress.
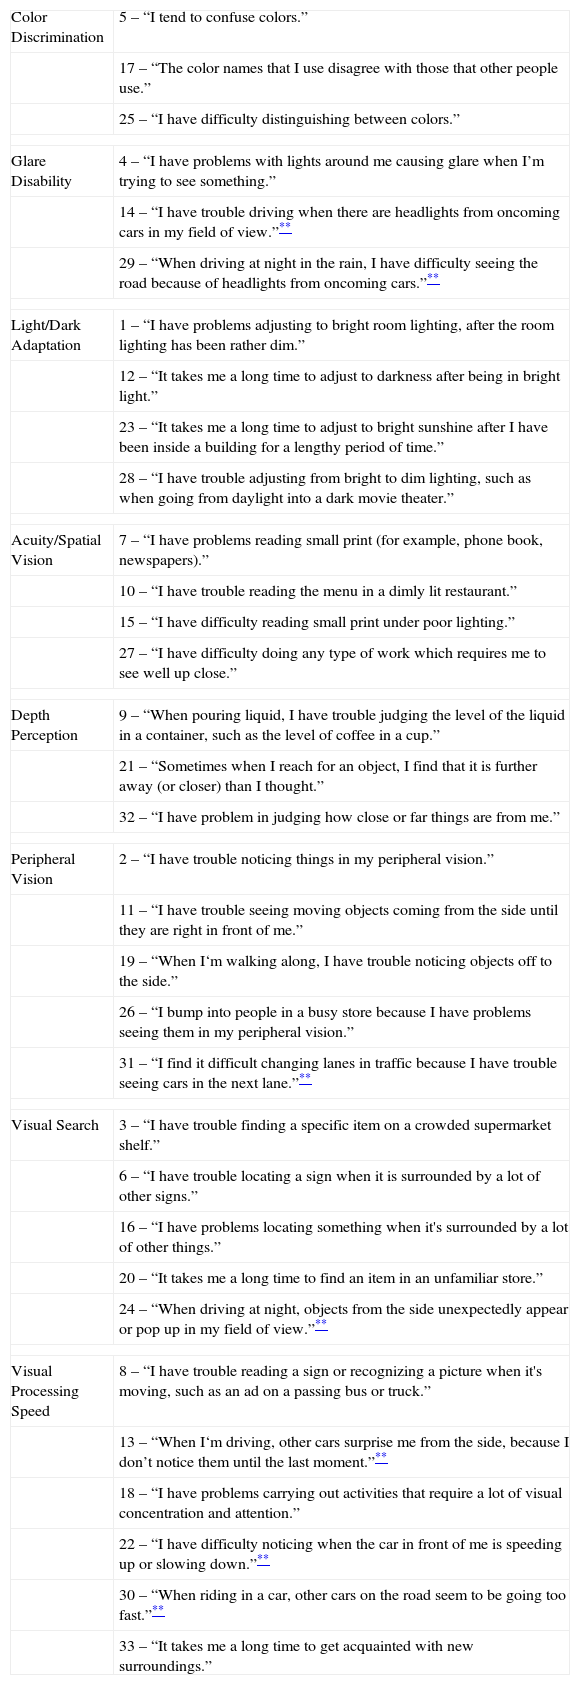
Visual Activities Questionnaire (VAQ28): The VAQ was conducted to assess perceived visual function in ordinary activities. The VAQ is a self-report questionnaire consisting of 33 items that are behaviourally based in that they refer to actual visual activities and tasks. These 33 items fall into eight areas that are known to be important in carrying out visual activities: Color discrimination, Glare disability, Light/Dark adaptation, Acuity/Spatial vision, Depth perception, Peripheral vision, Visual search, and Visual processing speed. For the purpose of this study, items pertaining to driving were extracted from the various categories to be examined separately in a post hoc analysis. The items of each category are listed in Table 4. Participants responded by selecting one of the following options: never, rarely, sometimes, often and always, which were coded from 1 to 5, respectively. The sum score for each subscale was used for analysis; the sum score of all items pertaining to driving were also computed and analyzed. The VAQ is a reliable and valid scale for evaluating visual difficulties.28 It is considered to be an efficient measure for current visual function in disorders such as glaucoma29 and cataracts, and for self-perceived visual difficulties related to adverse outcomes such as a vehicle crash or a fall.28 In addition, scores on certain subscales such as peripheral vision have been associated with greater visual field loss.30
Items of Visual Activities Questionnaire per categories.
| Color Discrimination | 5 – “I tend to confuse colors.” |
| 17 – “The color names that I use disagree with those that other people use.” | |
| 25 – “I have difficulty distinguishing between colors.” | |
| Glare Disability | 4 – “I have problems with lights around me causing glare when I’m trying to see something.” |
| 14 – “I have trouble driving when there are headlights from oncoming cars in my field of view.”** | |
| 29 – “When driving at night in the rain, I have difficulty seeing the road because of headlights from oncoming cars.”** | |
| Light/Dark Adaptation | 1 – “I have problems adjusting to bright room lighting, after the room lighting has been rather dim.” |
| 12 – “It takes me a long time to adjust to darkness after being in bright light.” | |
| 23 – “It takes me a long time to adjust to bright sunshine after I have been inside a building for a lengthy period of time.” | |
| 28 – “I have trouble adjusting from bright to dim lighting, such as when going from daylight into a dark movie theater.” | |
| Acuity/Spatial Vision | 7 – “I have problems reading small print (for example, phone book, newspapers).” |
| 10 – “I have trouble reading the menu in a dimly lit restaurant.” | |
| 15 – “I have difficulty reading small print under poor lighting.” | |
| 27 – “I have difficulty doing any type of work which requires me to see well up close.” | |
| Depth Perception | 9 – “When pouring liquid, I have trouble judging the level of the liquid in a container, such as the level of coffee in a cup.” |
| 21 – “Sometimes when I reach for an object, I find that it is further away (or closer) than I thought.” | |
| 32 – “I have problem in judging how close or far things are from me.” | |
| Peripheral Vision | 2 – “I have trouble noticing things in my peripheral vision.” |
| 11 – “I have trouble seeing moving objects coming from the side until they are right in front of me.” | |
| 19 – “When I‘m walking along, I have trouble noticing objects off to the side.” | |
| 26 – “I bump into people in a busy store because I have problems seeing them in my peripheral vision.” | |
| 31 – “I find it difficult changing lanes in traffic because I have trouble seeing cars in the next lane.”** | |
| Visual Search | 3 – “I have trouble finding a specific item on a crowded supermarket shelf.” |
| 6 – “I have trouble locating a sign when it is surrounded by a lot of other signs.” | |
| 16 – “I have problems locating something when it's surrounded by a lot of other things.” | |
| 20 – “It takes me a long time to find an item in an unfamiliar store.” | |
| 24 – “When driving at night, objects from the side unexpectedly appear or pop up in my field of view.”** | |
| Visual Processing Speed | 8 – “I have trouble reading a sign or recognizing a picture when it's moving, such as an ad on a passing bus or truck.” |
| 13 – “When I‘m driving, other cars surprise me from the side, because I don’t notice them until the last moment.”** | |
| 18 – “I have problems carrying out activities that require a lot of visual concentration and attention.” | |
| 22 – “I have difficulty noticing when the car in front of me is speeding up or slowing down.”** | |
| 30 – “When riding in a car, other cars on the road seem to be going too fast.”** | |
| 33 – “It takes me a long time to get acquainted with new surroundings.” | |
Color Vision Screening Inventory (CVSI31): A 10-item self-report behavioral inventory was used to assess perceived color vision ability. This brief screening inventory is a behaviourally validated instrument that can classify individuals based on their color vision perception. Participants responded by selecting one of the following options: never, seldom, occasionally, frequently and always, which were coded from 1 to 5, respectively. The established cut-off value is 17. Seven out of 10 questions ask if the participant have difficulty discriminating between certain colors (i.e. between red and brown), and the other items inquires color naming difficulty in general.
Farnsworth-Munsell 100 Hue Test (FMT32): The FMT was used to provide an objective assessment of color discrimination ability. The FMT is a widely used color vision test that requires participants to sequence color reference caps in order of incremental hue variation spanning the visible spectrum. The error scores reflect the number of misplacements. Error scores were computed separately for the blue, yellow, red, and green spectra. Total time to complete the FMT was also recorded to provide an index of the speed or efficiency of color discrimination. All testing was performed under standard light conditions in the same room and at the same place. The illuminance was maintained at D65 daylight, 6500K.
A Quick Test of Cognitive Speed (AQT33): The AQT, a variant of rapid automatized naming, was used to measure speeded color processing. Other than speeded naming ability, AQT is used to measure rapid cognitive shifts between visual stimuli and working memory. The AQT consists of three main tasks, each comprised of three subtests. In Task A, participants were first required to name color (color-naming: black, yellow, red, and blue), followed by form (form-naming: circle, line, triangle, and square), and lastly, a color–form combination in which participants named the color followed by the form (i.e. blue circle). In Task B, the participant has to name color, number (number-naming: numbers 1–9), and a color–number combination. In Task C, participants are required to name color, letter, and a color–letter combination. Each subtest is presented on a single page with 8 rows comprised of 5 items. Participants are instructed to name all 40 items as fast and as accurately as they can. Naming time and errors were recorded and combined across each task to give six overall variables: color-naming, form/number/letter-naming, and color and form/number/letter-naming in terms of both error and speed. AQT has shown high test-retest reliability (r=0.91 to 0.95) and discriminates individuals with ADHD from controls.33
ResultsDemographicsThe two groups did not differ in age, sex, IQ (see Table 3). The visual acuity (corrected eye sight) measured with a Snellen chart were within normal range (20/20) in both groups and did not differ significantly between the groups. As expected, ADHD participants reported significantly more symptoms on the ASRS than the comparison group [F(1, 58)=80.8, p<001], as well as higher emotional distress as measured using the K10 [F(1, 58)=12.8, p<001]. No sex differences among variables between the groups were found.
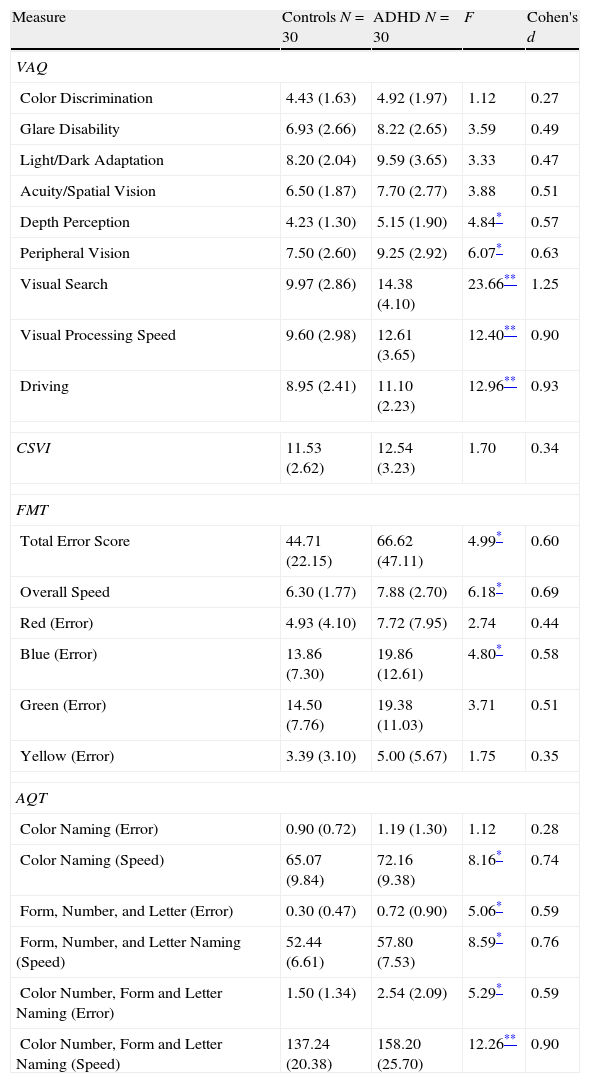
Visual functioningIndividuals with ADHD reported more visual difficulties than the comparison group on the VAQ (group means and standard deviations of scores on the various subscales are shown in Table 5). A one-way multivariate analysis of variance (MANOVA) was conducted to determine the effect of group (ADHD participants versus healthy controls) on self-reported VAQ items. Significant group differences were found on the VAQ, Wilks's Λ=0.629, F(9, 51)=3.34, p=0.0028, multivariate η2 based on Wilks's Λ=0.37. Analysis of variance (ANOVA) was conducted on the eight subcategories to follow up the significant result. Specifically, the ADHD group reported more problems in depth perception (M=5.15, 95% CI [4.57, 5.74]) than the control group (M=4.23, 95% CI [3.64, 4.83]), p=0.032. Also, the ADHD participants (M=9.25, 95% CI [8.25, 10.24]) had significantly more visual difficulty with peripheral vision than healthy controls (M=7.50, 95% CI [6.50, 8.51]), p=0.017. In addition, individuals with ADHD (M=14.38, 95% CI [13.11, 15.65]) self-reported more problems in visual search than the comparison group (M=9.97, 95% CI [8.67, 11.26]), p<001. Lastly, the ADHD group (M=12.61, 95% CI [11.41, 13.81]) endorsed significantly more difficulties with VAQ items related to visual processing speed than controls (M=9.60, 95% CI [8.38, 10.82]), p<0.001. Post hoc analysis of the VAQ items related to driving revealed a significant main effect of ‘group’, indicating that participants with ADHD (M=11.10, 95% CI [10.26, 11.93]) reported more visual problems when driving compared to controls (M=8.95, 95% CI [8.10, 9.80]), p<0.001.
Vision and color vision questionnaire and color vision tests ANOVA results.
| Measure | Controls N=30 | ADHD N=30 | F | Cohen's d |
| VAQ | ||||
| Color Discrimination | 4.43 (1.63) | 4.92 (1.97) | 1.12 | 0.27 |
| Glare Disability | 6.93 (2.66) | 8.22 (2.65) | 3.59 | 0.49 |
| Light/Dark Adaptation | 8.20 (2.04) | 9.59 (3.65) | 3.33 | 0.47 |
| Acuity/Spatial Vision | 6.50 (1.87) | 7.70 (2.77) | 3.88 | 0.51 |
| Depth Perception | 4.23 (1.30) | 5.15 (1.90) | 4.84* | 0.57 |
| Peripheral Vision | 7.50 (2.60) | 9.25 (2.92) | 6.07* | 0.63 |
| Visual Search | 9.97 (2.86) | 14.38 (4.10) | 23.66** | 1.25 |
| Visual Processing Speed | 9.60 (2.98) | 12.61 (3.65) | 12.40** | 0.90 |
| Driving | 8.95 (2.41) | 11.10 (2.23) | 12.96** | 0.93 |
| CSVI | 11.53 (2.62) | 12.54 (3.23) | 1.70 | 0.34 |
| FMT | ||||
| Total Error Score | 44.71 (22.15) | 66.62 (47.11) | 4.99* | 0.60 |
| Overall Speed | 6.30 (1.77) | 7.88 (2.70) | 6.18* | 0.69 |
| Red (Error) | 4.93 (4.10) | 7.72 (7.95) | 2.74 | 0.44 |
| Blue (Error) | 13.86 (7.30) | 19.86 (12.61) | 4.80* | 0.58 |
| Green (Error) | 14.50 (7.76) | 19.38 (11.03) | 3.71 | 0.51 |
| Yellow (Error) | 3.39 (3.10) | 5.00 (5.67) | 1.75 | 0.35 |
| AQT | ||||
| Color Naming (Error) | 0.90 (0.72) | 1.19 (1.30) | 1.12 | 0.28 |
| Color Naming (Speed) | 65.07 (9.84) | 72.16 (9.38) | 8.16* | 0.74 |
| Form, Number, and Letter (Error) | 0.30 (0.47) | 0.72 (0.90) | 5.06* | 0.59 |
| Form, Number, and Letter Naming (Speed) | 52.44 (6.61) | 57.80 (7.53) | 8.59* | 0.76 |
| Color Number, Form and Letter Naming (Error) | 1.50 (1.34) | 2.54 (2.09) | 5.29* | 0.59 |
| Color Number, Form and Letter Naming (Speed) | 137.24 (20.38) | 158.20 (25.70) | 12.26** | 0.90 |
VAQ=Visual Activities Questionnaire; CVSI=Color Vision Screening Inventory; FMT=Farnsworth-Munsell 100 Hue; MRM=Mollon-Reffin Minimalist; AQT=A Quick Test of Cognitive Speed.
Note. Standard deviations appear in parentheses beside means.
A one-way MANOVA yielded no main effect of group on the four color discrimination error scores, Wilks's Λ=0.908, F(4, 52)=1.32, p=0.27 (see Table 5). To test for a priori hypothesis of blue-color perception problems, we proceeded to perform one-way ANOVAs for each color spectrum on the FMT error scores. Individuals with ADHD (M=19.86, 95% CI [16.01, 23.72]) committed more errors only when discriminating blue spectrum colors and not in other colors such as red or green compared to normal controls (M=13.86, 95% CI [9.94, 17.78]), p=0.033. Analysis of the time to complete the FMT also revealed slower color discrimination in the ADHD group (M=7.88, 95% CI [6.76, 8.99]) relative to the comparison group (M=6.30, 95% CI [5.58, 7.01]), p=0.016.
Visual perceptual speedA one-way MANOVA yielded a main effect group on AQT naming time, Wilks's Λ=0.767, F(6, 53)=2.69, p=0.024. The multivariate η2 based on Wilks's Λ was 0.23. Results from follow-up ANOVA tests indicated that participants with ADHD were significantly slower in all three naming tasks than control group (see Table 5). In terms of accuracy scores, ADHD participants made more errors than the healthy controls in form/number/letter-naming (also see Table 5).
Interrelationship amongst visual functioning, color vision, and ADHD symptomsTo determine whether ADHD symptoms were related to visual problems, Pearson correlations were calculated between the ASRS scores and those for the five VAQ subscales impaired in ADHD. Significant correlations were found between ASRS and peripheral vision [r(58)=0.320, p=0.013], visual search [r(58)=0.492, p<0.001], and visual processing [r(58)=0.315, p=0.014]. Although there were no group differences in the CVSI, correlational analyses revealed a significant positive correlation between scores on the CVSI and those on the VAQ color discrimination scale for both groups: ADHD: r(27)=0.82, p<0.001; Control: r(28)=0.78, p<0.001. Also, in the ADHD group, CVSI scores correlated with VAQ depth perception [r(27)=0.48, p=008]. In the control group, CVSI scores correlated with glare disability [r(28)=0.47, p=0.008] and acuity/spatial vision [r(28)=0.44, p=014].
DiscussionThis study provides the first evidence of color vision problems and functional visual impairments in adults with ADHD. Specifically, young adults with ADHD exhibited significantly more visual difficulties, as indicated by self-report on four out of eight areas in everyday visual activities. Moreover, the ADHD group reported more visual difficulties when driving. Also adults with ADHD exhibited specific problems in discriminating colors along the blue spectrum, as indicated by their performance on the FMT, as well as less efficient color discrimination and overall visual processing, as indexed by the longer time taken to complete the FMT and AQT scores, respectively.
In our study, ADHD individuals reported that they perceived significantly more difficulties compared to the control group in the following areas on the VAQ: depth perception, peripheral vision, visual search, visual processing, and items related to driving. Also, in the ADHD group self-rating of ADHD symptoms on the ASRS correlated significantly with VAQ subscales such as peripheral vision, visual search and visual processing speed, suggesting that these visual difficulties may be related to behavioral symptoms of inattention. However, those VAQ items pertaining to visual difficulties associated with driving did not correlate with ASRS scores. Previous studies have reported driving problems including risky driving behavior and vehicle collisions in adults with ADHD.6,7 Our findings on the VAQ, which are based on self-reported problems in visual function in everyday life, suggest that visual problems reported in previous studies may have functional consequences in real world activities including driving. Considering that visual perception is known to be one of the most important factors in driving, our findings warrants further investigation to delineate underlying mechanisms of visual difficulties in ADHD as well as the link between vision, attention and driving.34,35
In terms of color perception, our finding of impaired FMT performance for the blue spectrum in adults with ADHD, is in line with findings from previous studies using the FMT with children with ADHD17,18 (see Table 1). Notably, no impairments were found for the red or green spectra, suggesting that the difficulty with blue cannot simply be attributable to problems with sustained attention: the latter would be expected to have an impact on FMT performance across all of the colors. But how are we to account for the finding that the hue discrimination problems were restricted to the blue spectrum and did not include problems with the yellow spectrum? According to opponent color theory,36 the blue and yellow visual system may be coupled and show similar outcome in visual functions. However, an alternate model of color vision, Dual-Process Theory37 proposed that the visual system is comprised of two stages. The first stage can be considered as the receptor stage, where the three retinal photoreceptors (S, M and L cones) traduce physical stimuli into neural signals. In the second stage, the neural signals from cones are combined to create two chromatic mechanisms: L–M and S–(L+M). The S–(L+M) mechanism combines positive inputs from S cones and negative inputs from the sum of L and M cone signals which lead to our perception of blue and yellow. Notably, deficiency in central nervous system (CNS) dopamine in ADHD may induce a hypo-dopaminergic tone in the retina, which in turn would have deleterious effects on short-wavelength cones. Therefore, we may speculate that this dopaminergic effect may have an impact on S-cones in the receptor stage, leaving yellow perception, which is a product of LM cones in the receptor level intact. Another possibility, albeit speculation, is that the observed ‘blue-color problem’ in ADHD reflects an alteration in an opsin/vitamin-A-based photopigment, called melanopsin, which is maximally sensitive to blue light and linked with regulation of circadian rhythms:38,39 circadian systems are impaired in ADHD.40
Furthermore, high correlations between CVSI score and several categories in VAQ imply possible impact of color vision in daily visual activities. Likewise, evidence of a color perception deficit is important given the extensive use of color in daily life and the use of color stimuli in many of the standard neuropsychological tests used in the assessment for ADHD (e.g. color–word Stroop test, Wisconsin Card Sorting Task). For example, one previous study reported an intriguing relationship between performance on the Wisconsin Card Sorting Task (number of trials to complete the first category, which is color) and color naming on the Stroop. Both tasks involve a high proportion of blue stimuli.21 Findings for color vision were not completely consistent in this study. For instance, self-reports such as the CVSI and the color discrimination variable on the VAQ did not indicate any group differences in perceived color vision while the FMT results showed significant group differences on the blue spectrum. This seemingly inconsistent finding with self-reported questionnaires suggests that color perception deficiency may be specific to blue colors, as suggested by the retinal dopaminergic hypothesis.
Finally, we found that the ADHD population were significantly slower in naming speed than the control group in all subscales of the AQT: color naming, form/number/letter naming and color–form/color–number/color–letter naming. Individuals with ADHD were also generally slower on the color discrimination task (FMT) than the control group. Furthermore, ADHD individuals committed more errors than controls except for the color naming subscale. This finding is somewhat inconsistent with previous studies that found differences in color naming speed.17,20 One important factor to consider when evaluating the findings from the AQT is that the AQT differs significantly from the Stroop test in that the AQT tasks measure general cognitive and perceptual processing speed41 whereas the Stroop color–word test is believed to be a classic executive function test. A study using regional cerebral blood flow has shown that during color–form naming task, brain activation in the parietal area is increased and activations in fronto-temporal regions are decreased, which indicates that the color–form test may require more perceptual processing than executive functions.42 Along with slower naming speed in FMT, this further reinforces the idea that individuals with ADHD experience difficulties in visual processing efficiency.
There are several limitations in this preliminary study. First of all, the sample size is relatively small and involves a large proportion of college students which makes it difficult to generalize the results to the entire ADHD adult population. We acknowledge that this preliminary study needs to be replicated with a larger, clinical sample for findings to be generalizable to the ADHD population. However, based on the effect sizes on the visual and color vision measures of this study that range from medium to large, the sample provided sufficient statistical power to detect group differences.43 Secondly, ADHD diagnosis in this study was determined by previous documentation of diagnosis and comorbidities were self-reported by the participants instead of a comprehensive diagnostic procedure. Another limitation is that visual function problems in daily life were mainly analyzed with a self-report measure which might entail information bias. Subsequent studies should use a more objective measure of visual function problems in everyday life. In addition, the limitation of using the FMT is that it requires the participant to arrange the caps in the best color order (i.e. from yellowish green to turquoise green). This process involves both accurate movement execution and sustained attention, which are known to be impaired in ADHD. Future studies might want to give greater consideration to the choice of color perception tests and to incorporate other approaches to disaggregate visual attention and color vision. Perhaps display based tests such as Color Assessment and Diagnosis (CADs) should be used in future studies to investigating RG and YB chromatic sensitivity more accurately.
Notwithstanding the study limitations, this study represents the first attempt to investigate the perceived difficulty in daily visual activities, and to test whether a previously reported problem in blue color perception in children with ADHD also manifests in adults with ADHD. Its interdisciplinary innovation lies in its application of a well-established measure of color vision (FMT) along with a less used measure of visual functioning to test a novel hypothesis (retinal dopaminergic hypothesis22) in a prevalent psychiatric condition (ADHD), which is not traditionally linked with visual problems. Our findings highlight the need for further research on the complex interactions between attention, color perception, and visual functioning and underlying explanatory mechanisms. Moreover, our findings indicate the need for optometrists, psychiatrists, and other clinicians to investigate visual function in the assessment of young adults with ADHD. The VAQ appears to be a psychometrically sound measure that may serve as a useful clinical tool for investigating self-reported visual function in daily life.
Conflicts of interestDr Tannock has served as a consultant for Eli Lilly and Purdue Pharmaceuticals in the past 3 years, and Pearson-Cogmed provides software licences without cost for her research on working memory training in ADHD college students; neither Ms Kim nor Ms Chen have any conflicts of interest.
Special thanks to Heidi Bernhardt, the president and national director of the Center for ADHD Awareness, Canada (CADDAC) for her help in recruiting ADHD participants. Also we appreciate our research assistants Hamed Dar and Palm Soontornsittipong for their help in data collection. This study was funded in part by the Canada Research Chairs program (RT) and Graduate Funding (SK).


