

The aim of the study was to determine the effect of optimal spectral filters on reading performance following stroke.
MethodsSeventeen stroke subjects, aged 43–85, were considered with an age-matched Control Group (n=17). Subjects undertook the Wilkins Rate of Reading Test on three occasions: (i) using an optimally selected spectral filter; (ii) subjects were randomly assigned to two groups: Group 1 used an optimal filter, whereas Group 2 used a grey filter, for two-weeks. The grey filter had similar photopic reflectance to the optimal filters, intended as a surrogate for a placebo; (iii) the groups were crossed over with Group 1 using a grey filter and Group 2 given an optimal filter, for two weeks, before undertaking the task once more. An increase in reading speed of >5% was considered clinically relevant.
ResultsInitial use of a spectral filter in the stroke cohort, increased reading speed by ∼8%, almost halving error scores, findings not replicated in controls. Prolonged use of an optimal spectral filter increased reading speed by >9% for stroke subjects; errors more than halved. When the same subjects switched to using a grey filter, reading speed reduced by ∼4%. A second group of stroke subjects used a grey filter first; reading speed decreased by ∼3% but increased by ∼4% with an optimal filter, with error scores almost halving.
ConclusionsThe present study has shown that spectral filters can immediately improve reading speed and accuracy following stroke, whereas prolonged use does not increase these benefits significantly.
El objetivo de estudio fue la determinación del efecto de filtros espectrales óptimos sobre el rendimiento lector tras ictus cerebral.
MétodosSe evaluó a diecisiete pacientes tras ictus cerebral, con edades comprendidas entre 43 y 85 años, junto con un grupo de control con edades equivalentes (n=17). Los pacientes realizaron en tres ocasiones la prueba de lectura Wilkins: (i) utilizando un filtro espectral óptimamente seleccionado; (ii) distribuyendo a los pacientes en dos grupos al azar: el Grupo 1 utilizó un filtro óptimo, mientras que el Grupo 2 utilizó un filtro gris, durante dos semanas. El filtro gris tenía una reflectancia fotópica similar a la de los filtros óptimos, con intención de actuar como placebo; (iii) se cruzaron los grupos de modo que en el Grupo 1 se utilizó un filtro gris, entregándose al Grupo 2 un filtro óptimo durante dos semanas, antes de volver a realizar la operación. Se consideró clínicamente relevante un incremento de la velocidad de lectura de >5%.
ResultadosEl uso inicial de un filtro espectral en la población de pacientes con ictus incrementó la velocidad de lectura en un ∼8%, reduciendo casi a la mitad las puntuaciones de error no replicándose los hallazgos en los controles. El uso prolongado de un filtro espectral óptimo incrementó la velocidad de lectura en un >9% en los pacientes con ictus; los errores quedaron reducidos a más de la mitad. Cuando a los mismos pacientes se les sustituyó el filtro por uno gris, la velocidad de lectura se redujo en un ∼4%. En el segundo grupo de pacientes con ictus que utilizó un filtro gris en primer lugar, la velocidad de lectura se redujo en un ∼3% aunque se incrementó en un ∼4% con el uso del filtro óptimo, reduciéndose casi a la mitad las puntuaciones de error.
ConclusionesEl presente estudio ha demostrado que los filtros espectrales pueden mejorar de inmediato la velocidad y la precisión de lectura, mientras que su uso prolongado no incrementa dichos beneficios de manera significativa.
Visual stress is a condition characterised by symptoms of eyestrain, headaches and glare, along with illusions of colours, shape and motion.1 The intensity of these effects will vary according to individual susceptibility and the precise nature of the stimulus viewed; this is most notable for images that comprise striped patterns with a spatial frequency of around 3 cycles per degree, with a pattern of even width and spacing, high contrast and viewed binocularly.2,3 Many attributes necessary to elicit visual stress symptoms in the susceptible individual are present within standard text documents.1,4–6 Viewing stimuli of this type can lead to an adverse response, termed ‘patterned glare’1 or ‘pattern glare’.7 More recently, the acronym MISViS has become the adopted term for symptoms arising from pattern glare and is derived from preceding terminology, Meares–Irlen syndrome/visual stress.8 There is credible evidence to suggest that cortical hyperexcitability is responsible for the symptoms of visual stress,3,9–12 with other theories being less convincing, most notably, a deficit of the magnocellular pathway.13–16
The symptoms of visual stress can frequently be reduced with a spectral filter, optimally selected for the individual,17,18 although their value has been disputed by others.19 Potential benefit from using spectral filters can be assessed reliably, using the Wilkins Rate of Reading Test.20 The test is used to compare an individual's reading performance under one set of conditions and then compared under another, usually following the introduction of a spectral filter which has been optimally selected.
Pattern glare has known association with a range of conditions, many of neurological basis, including migraine,11,21,22 photosensitive epilepsy,23 autism,17 dyslexia,24–26 multiple sclerosis,27 and MISViS.13,28 Recent evidence has also demonstrated susceptibility to pattern glare in stroke patients29 with this adverse response managed effectively with coloured overlays and precision tinted lenses in an isolated case.30 Others have reported susceptibility to photophobia following traumatic brain injury, alleviated by using photochromic filters,31 with even minor head injuries causing heightened sensitivity to light and sound.32,33 Sensitivity to light and motion have been demonstrated following mild traumatic brain injury, and it has been proposed that neurological disinhibition, as a result of the injury, may be responsible for these findings.34 Hyperexcitability in the visual cortex has also been shown in patients with homonymous hemianopia, following stroke.35
Stroke is expected to become an increasing burden as the population ages and already accounts for 9% of deaths around the world and is a major cause of disability.36 Given the emerging evidence of pattern glare susceptibility following stroke,29 it would seem logical to explore the potential rehabilitation of reading impairment using spectral filters for this subject group. Direct methods of assessment, rather than symptom-based investigations, have been shown to be better at isolating those individuals who are likely to benefit from spectral filters.37 Consequently, the purpose of this study is to consider the impact of optimal spectral filters on reading performance, using a direct method of assessment, the Wilkins Rate of Reading Test, in a stroke cohort.
Materials and methodsSubjectsSuitable candidates for the present study were recruited by displaying notices at the research venue, (the optometric practice of the investigator) requesting for volunteers. Several participants were also recruited following contact with the local Stroke Association group. All candidates had been discharged from the care of the hospital department involved in the treatment of their stroke. Prior to commencing the research, ethical approval was obtained from Aston University's Audiology/Optometry Research Ethics Committee with the study designed to follow the tenets of the Declaration of Helsinki. Each subject was given detailed information regarding the nature of the study, both verbally and in written form; this allowed informed consent to take place prior to their participation. As migraine has an association with visual stress,11 the data were considered with the entire cohort and also with migraine subjects excluded. For brevity, only the data with the exclusion of migraine subjects are presented, given that the principal outcomes are the same. Following exclusions, the Stroke Group consisted of 9 females and 8 males with an age range of 43–85 years (mean 68, SD 12.29 years). The control participants had an age range of 38–84 years (mean 60.29, SD 14.19 years) consisting of 8 females and 9 males. These groups were calculated as being age-matched (unpaired t-test: t=1.770, df=32, P=0.086).
ProtocolSubjects were required to attend on three occasions to undertake the Wilkins Rate of Reading Test. At the end of the first session and after a one-week break, subjects were randomly allocated to one of the two groups, nominally called Groups 1 and 2 respectively, to satisfy the cross-over design of the study in Sessions 2 and 3; the subjects were unaware which group they were allocated to, although they were not masked from the examiner. Stroke Group 1 (n=9) was age-matched to Stroke Group 2 (n=8) (unpaired t-test: t=0.007, df=15, P=0.995), with Group 1 having an age range of 52–83 years (mean 68.33, SD 9.00) and Group 2 with an age-range of 43–85 (mean 68.38, SD 15.89). Control Group 1 (n=7) had an age-range of 38–84 years (mean 59.42, SD 17.03), and was matched with Control Group 2 (n=10) (unpaired t-test: t=0.204, df=15, P=0.841), having an age-range of 40–83 years (mean 60.90, SD 12.78).
For Session 2, Group 1 were issued with their optimal spectral filter, whereas Group 2 were issued with a grey filter with a comparable photopic reflectance; this neutral filter is rarely found to be of benefit and was, therefore, intended as a surrogate for a placebo measure.18 The subjects were asked to use their allocated filter whilst undertaking visual tasks such as reading, over a two-week period before returning to undertake the Wilkins Rate of Reading Test for the second time using their allocated filter. At the end of the second session, subjects returned their allocated filter, prior to a two-week break, at which point the groups were crossed over; Group 1 were issued with a grey filter, whilst Group 2 were issued with their optimal filter to use for a two-week period, before returning to repeat the Wilkins Rate of Reading Test for the final time using their newly assigned filters.
Clinical measuresAt the first session, participants were required to complete a short questionnaire to determine if they were dyslexic, epileptic, autistic, or suffered from multiple sclerosis or migraine. All the subjects demonstrated that they were able to read N8-sized print, with their habitual spectacle correction, at a typical working distance, and were asked to declare if they had previously used spectral filters or precision tinted spectacle lenses. From the initial questionnaires, two migraine sufferers were identified within the stroke participants and three migraine sufferers within the control subjects. None of the subjects in either group reported a diagnosis of dyslexia, autism, multiple sclerosis or epilepsy. One stroke subject had reported using a coloured overlay and latterly, precision tinted lenses, on a regular basis, since having her stroke a few years prior and her data were excluded from the analyses.
Prior to undertaking the Wilkins Rate of Reading Test for the first time, all participants were asked to select an optimal spectral filter using the recognised method of successive elimination18; this process involves the systematic pairwise comparison of nine differently coloured spectral filters, placed consecutively on a high contrast test page of randomised words. The subject is asked to select the filter that gives the best perceptual comfort when viewing the text, using combinations of filters with neighbouring hue if necessary. The grey filter, also supplied with the test pack, was omitted from the available selection as it is rarely found to be of benefit.18 The spectral properties of the filters (Intuitive Overlays supplied by i.O.O. Sales Ltd.), have been described elsewhere.38 With optimal filter selection established, the subjects completed the Wilkins Rate of Reading Test during this first session. The test consists of a paragraph of text which comprised 15 simple words in a random order. These words are 2, 3 and 4-letter words used frequently in English language and are usually familiar to those with a reading age of ∼7 years. Each of the 10 lines within the paragraph has the same 15 words but in a different order. Importantly, the test allows the subject to succeed even if he is not especially competent at reading. The randomisation of the words allows an individual to make errors he is often unaware of, therefore, avoiding a sense of failure or despondency. Further, successive words within the sentence cannot be guessed by the preceding word; each word has to be individually read allowing a measure of visual and visuo-perceptual performance without syntactic or semantic constraints. Undertaking the test requires the subject to read aloud the text as quickly as possible, over the course of 1min, with the examiner noting how many words are read within this time, along with a record of any errors made, thus producing two outcome measures. In the present study, subjects were asked to complete the task in each session, firstly with an optimal spectral filter, then without a filter, without again, and finally with, using a different version of the test each time. Using this approach, by calculating the mean of each test condition, the effects of practice and fatigue are largely balanced out. For the rate of reading measure, an increase in reading speed of around 5% with the use of a spectral filter has been shown to be predictive of individuals continuing to use this intervention on a regular and prolonged basis.26
Statistical analysisAll data were tested for normality using the Kolmogorov–Smirnov test and appropriately analysed using the commercially available software, PASW, v. 18, IBM, New York, USA.39 In Session 1, a two-factor mixed ANOVA design was used, incorporating one between-subject factor: stroke or control participant, and one within-subject factor: filter present or absent. In Sessions 2 and 3, a three-factor mixed ANOVA design was used, incorporating two between-subject factors: (1) stroke or control participant; (2) optimal filter group or grey filter group; and one within-subject factor: filter present or absent. Outcome measures were the rate of reading (number of words per minute read correctly) both with and without a filter, along with the corresponding error score. A significance level of α=0.05 was used throughout the analysis.
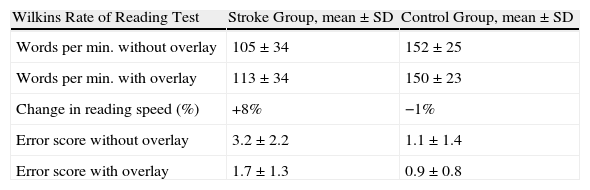
ResultsSession 1Descriptive data for the stroke cohort can be seen in Table 1. Results for the Wilkins Rate of Reading Test during the first session showed (see Table 2) a difference between the participants reading speed (F(1,32)=18.084, P=0.000), with the filter having an impact on the number of words correctly read by the subjects (F(1,32)=4.640, P=0.039); this being most noteworthy for the stroke subjects who demonstrated a significant improvement in their rate of reading whilst using an optimal spectral filter, whereas the Control Group performed better without the filter (F(1,32)=10.891, P=0.002). Stroke subjects produced more error scores than the Control Group (see Table 2) (F(1,32)=49.264, P=0.006), with the filter significantly reducing these errors (F(1,32)=15.772, P=0.000), for the stroke subjects only (F(1,32)=9.830, P=0.004).
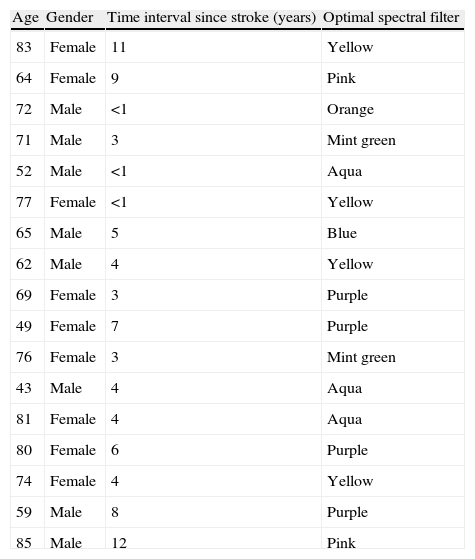
Descriptive data for stroke cohort.
| Age | Gender | Time interval since stroke (years) | Optimal spectral filter |
| 83 | Female | 11 | Yellow |
| 64 | Female | 9 | Pink |
| 72 | Male | <1 | Orange |
| 71 | Male | 3 | Mint green |
| 52 | Male | <1 | Aqua |
| 77 | Female | <1 | Yellow |
| 65 | Male | 5 | Blue |
| 62 | Male | 4 | Yellow |
| 69 | Female | 3 | Purple |
| 49 | Female | 7 | Purple |
| 76 | Female | 3 | Mint green |
| 43 | Male | 4 | Aqua |
| 81 | Female | 4 | Aqua |
| 80 | Female | 6 | Purple |
| 74 | Female | 4 | Yellow |
| 59 | Male | 8 | Purple |
| 85 | Male | 12 | Pink |
Session 1 results from the Wilkins Rate of Reading Test for Stroke and Control Groups.
| Wilkins Rate of Reading Test | Stroke Group, mean±SD | Control Group, mean±SD |
| Words per min. without overlay | 105±34 | 152±25 |
| Words per min. with overlay | 113±34 | 150±23 |
| Change in reading speed (%) | +8% | −1% |
| Error score without overlay | 3.2±2.2 | 1.1±1.4 |
| Error score with overlay | 1.7±1.3 | 0.9±0.8 |
The subjects were divided into their respective groups for this session; participants in Group 1 were permitted to use their optimal filter, whereas those in Group 2 were given a grey filter to use.
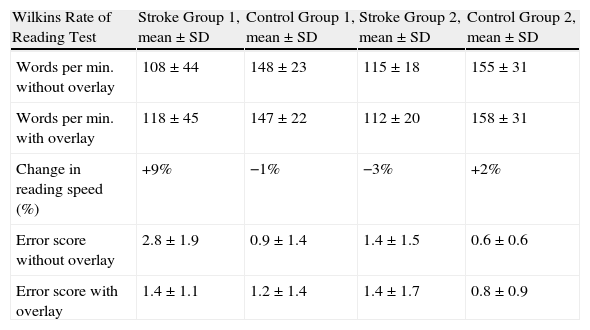
A summary of data for Stroke and Control Groups 1 and 2 can be seen in Table 3. The between-subject effects showed a difference between the main effect of participants performance with stroke subjects reading more slowly than the controls (F(1,30)=12.665, P=0.001). The within-subject analysis showed a significant interaction between the presence of the filter, the subject group, and the type of filter (F(1,30)=7.871, P=0.009), with the stroke subjects demonstrating improvements in reading speed when using their optimal filter. For error scores, the between-subject factors showed a difference for the main effect of participant type (F(1,30)=4.658, P=0.039) with stroke subjects recording more errors than the Control Group. The within-subject analysis showed an interaction between the filter presence, filter type, and participant (F(1,30)=5.163, P=0.030), with the use of an optimal spectral filter reducing errors for the stroke subjects.
Session 2 results from the Wilkins Rate of Reading Test showing comparison of Stroke Group 1 and Control Group 1 using an optimal spectral filter and Stroke Group 2 and Control Group 2 using a grey filter.
| Wilkins Rate of Reading Test | Stroke Group 1, mean±SD | Control Group 1, mean±SD | Stroke Group 2, mean±SD | Control Group 2, mean±SD |
| Words per min. without overlay | 108±44 | 148±23 | 115±18 | 155±31 |
| Words per min. with overlay | 118±45 | 147±22 | 112±20 | 158±31 |
| Change in reading speed (%) | +9% | −1% | −3% | +2% |
| Error score without overlay | 2.8±1.9 | 0.9±1.4 | 1.4±1.5 | 0.6±0.6 |
| Error score with overlay | 1.4±1.1 | 1.2±1.4 | 1.4±1.7 | 0.8±0.9 |
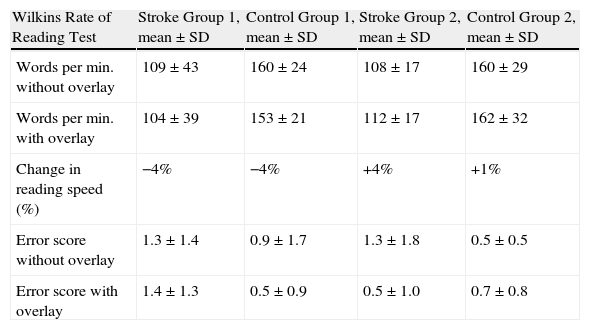
For this session, the subjects were crossed-over, with Group 1 using a grey filter and Group 2 using their optimal filter. A summary of data for Stroke and Control Groups 1 and 2 can be seen in Table 4. The within-subject analysis for the rate of reading showed an interaction for the presence of the filter and its type, with stroke and control participants reading more words per minute with their optimal spectral filter, and less with a grey filter (F(1,30)=11.808, P=0.002). The between-subject effects showed a difference for the main effect of participants performance (F(1,30)=23.911, P=0.000) with stroke subjects reading more slowly than the Control Group. For error scores, there was an interaction between the filter presence, its type, and the participant type, with the Stroke Group recording fewer errors when using an optimal filter (F(1,30)=9.266, P=0.005). The between-subject factors showed no difference for the main effect of participant type, nor for filter-type (F(1,30)=0.222, P=0.641).
Session 3 results from the Wilkins Rate of Reading Test showing comparison of Stroke Group 1 and Control Group 1 using a grey filter and Stroke Group 2 and Control Group 2 using an optimal spectral filter.
| Wilkins Rate of Reading Test | Stroke Group 1, mean±SD | Control Group 1, mean±SD | Stroke Group 2, mean±SD | Control Group 2, mean±SD |
| Words per min. without overlay | 109±43 | 160±24 | 108±17 | 160±29 |
| Words per min. with overlay | 104±39 | 153±21 | 112±17 | 162±32 |
| Change in reading speed (%) | −4% | −4% | +4% | +1% |
| Error score without overlay | 1.3±1.4 | 0.9±1.7 | 1.3±1.8 | 0.5±0.5 |
| Error score with overlay | 1.4±1.3 | 0.5±0.9 | 0.5±1.0 | 0.7±0.8 |
The present study has demonstrated that following stroke, improvements in reading speed and accuracy can be achieved with the use of optimal spectral filters. For the rate of reading measure, an increase in reading speed of around 5% with the use of a spectral filter has been shown to be predictive of individuals continuing to use this intervention on a regular and prolonged basis.26 Normative data reports show that 22% of school children read >5% faster with a spectral filter,40 and 38% within a university student sample.41 In the present study, initial use of an optimal spectral filter in the stroke cohort, compared to performance without a filter, increased reading speed by ∼8% and almost halved error scores, findings not replicated in the Control Group. During Session 2 and after using an optimal filter for a prolonged period, reading speed increased by more than 9%, compared to measures without a filter, for Stroke Group 1, with ∼78% (n=7/9) of subjects recording a >5% increase; error scores more than halved for Stroke Group 1 whilst using an optimal filter. In contrast, when these same subjects were asked to substitute the optimal filter for a novel, grey filter, during Session 3, results showed ∼4% reduction in reading speed and marginally elevated error scores; only one subject recorded a >5% increase in reading speed with the grey filter. For Control Group 1, a small decrease in reading speed of ∼1% was observed, with only one subject recording a >5% increase with their optimal filter and error scores increased with the filter in situ. When using the grey filter, reading speed decreased by ∼4%, although two subjects produced a >5% increase. Error scores were marginally lower in this group when using the filter. Despite increases of >5% in reading rates being predictive of likely continued use of spectral filters,20,40 in practice, these benefits should be assessed case-by-case, and based upon an individual's perceived benefit having used the intervention for several weeks, with some suggesting a criterion of >10% as being more appropriate.24
Stroke Group 2 conducted the study in reverse, using the grey filter for a prolonged period initially, before using an optimal filter over the same time period. Whilst using the grey filter, average reading speed reduced by ∼3%; all subjects read <5% faster with the filter; error scores were marginally elevated with the filter. With access to an optimal filter, these same subjects recorded ∼4% increase in reading speed, with 38% (n=3/8) now showing a >5% improvement. In addition, error scores virtually halved with the optimal filter. For Control Group 2, reading speed increased by ∼1% with the grey filter, with 30% (n=3/10) of subjects showing a >5% improvement, although errors were higher with the filter in place. In the third session, Control Group 2 recorded an ∼1% increase in reading speed with their optimal filter, with 20% (n=2/10) showing a >5% improvement, although error scores were again higher with the filter in situ.
Although both groups of stroke subjects showed benefit from optimal spectral filters, the effects were greater for those using the optimal filter prior to the grey filter, rather than vice versa. It could be that the use of the grey filter had a detrimental effect on reading performance, or simply generated despondency towards the potential benefit of spectral filters given their initial experience with the intended placebo intervention. Nevertheless, when subjects were asked at the end of the study to reflect on the value of the filters, ∼78% (n=7/9) of stroke subjects in the first group and 62% (n=5/8) in the second group showed preference for the optimal filter, findings that share similarity with migraine sufferers who report improved comfort with spectral filters but not necessarily marked improvement in reading performance.11 Overall, only one subject felt the grey filter was the most beneficial. Typically in the literature, the change in rate of reading is the most widely reported outcome measure. Perhaps given the outcome in the present study, attention should also be given to error scores since this also gives insight into task fluency.
Further work should be considered with a larger sample as well as avoiding the potential bias of predisposed visual symptoms in subjects recruited from an optometric practice. It should be noted that despite subjects being offered the grey filter as a novel alternative, rather than an outward placebo, they might have shown prejudice towards it given their previous experience with an optimal filter. Further, given that the grey filter impaired reading speed in the present study, an alternative placebo intervention should be considered for future work; this could be achieved by adopting recognised techniques using precision tinted ophthalmic lenses, which would also allow for double masking.42
Cortical hyperexcitability is the most plausible explanation for the symptoms generated by visual stress,9 and can occur secondary to stroke35 as well as following short transient ischaemic attacks.43 Considering the recognised susceptibility to pattern glare in this cohort,30 it is perhaps unsurprising that spectral filters can reduce visual perceptual deficits in stroke individuals. It would be worthwhile in the future, considering the effects of time interval since stroke, site of stroke event, as well as any association with co-existing visual deficits in these patients such as visual field defects, and binocular vision anomalies.
The present study has shown for the first time that optimal spectral filters can immediately improve reading speed and accuracy for some stroke subjects, whereas prolonged use, maintains, but does not increase these benefits significantly; these effects are unlikely to be due to contrast reduction or the benefit of practice, whilst the use of grey filters may be detrimental to reading ability.
Conflict of interestThe authors declare that they have no conflict of interest.
We are grateful for the time freely given by the participants in this study. The authors would also like to thank Dr. Richard Armstrong for his help with the statistical analyses employed in the manuscript.


