

The aim of this study was to evaluate the diagnostic capability of intraeye retinal nerve fiber layer (RNFL) thickness and macular thickness (MT) asymmetry measurements for the discrimination of normal tension glaucoma (NTG) and primary open-angle glaucoma (POAG) using spectral domain optical coherence tomography (SD-OCT).
MethodsA total of 90 subjects were enrolled including 30 consecutive healthy subjects, 30 consecutive subjects with POAG, and 30 consecutive subjects with NTG. RNFL thicknesses around the optic disc as well as MT measurements were taken with circular and radial SD-OCT scans. Intraeye retinal and MT asymmetry were calculated as the absolute difference between superior and inferior hemispheres of the eye using posterior pole asymmetry analysis protocol. Analysis of variance was used for comparison and areas under the receiver operating characteristic (AROC) were obtained for different parameters among the three diagnostic groups.
ResultsThere was a significant difference in MT asymmetry for all comparison groups (normal-NTG, p<0.05; normal-POAG, p<0.001; and NTG-POAG, p<0.001). Intraeye retinal nerve fiber thickness asymmetry measurements were not different between the groups (normal-NTG, p<0.187; normal-POAG, p<0.056; and NTG-POAG, p<0.837). The area under ROC curves exceeded 0.800 for all the studied parameters, including the MT asymmetry except for intraeye RNFL thickness asymmetry which had the lowest AROC as well as the least sensitivity for identifying subjects with NTG from normal (AROC=0.626, sensitivity=30%); POAG from normal (AROC=0.644, sensitivity=37%) and NTG from POAG (AROC=0.533, sensitivity=13%).
ConclusionThe intraeye MT asymmetry holds significant potential as a distinguishing parameter for NTG and POAG.
El objetivo de este estudio fue el de evaluar la capacidad diagnóstica de las mediciones intraoculares de la asimetría del grosor de las capas de fibras nerviosas de la retina (RNFL) y del grosor macular (MT) para la discriminación del glaucoma normotensional (NTG) y el glaucoma primario de ángulo abierto (POAG), mediante tomografía de coherencia óptica de dominio espectral (TCO-DE).
MétodosSe incluyó a un total de 90 sujetos, de los cuales treinta eran sujetos sanos consecutivos, treinta sujetos consecutivos con POAG, y treinta sujetos consecutivos con NTG. Los grosores de RNFL alrededor del disco óptico, así como las mediciones de MT, se obtuvieron mediante TCO-DE circular y radial. La asimetría intraocular retiniana y de MT se calcularon como diferencia absoluta entre los hemisferios oculares superior e inferior, utilizando el protocolo de análisis de asimetrías del polo posterior. Se utilizó para la comparación el análisis de la varianza, obteniéndose las áreas bajo la curva de características operativas del receptor (AUROC) para los diferentes parámetros en los tres grupos diagnósticos.
ResultadosSe produjo una diferencia significativa en relación a la asimetría de MT para todos los grupos comparativos (normal-NTG, p<0,05; normal-POAG, p<,001y NTG-POAG, p<0,001), mientras que las mediciones intraoculares de la asimetría del grosor de las fibras nerviosas de la retina no reflejaron una diferencia entre los distintos grupos (normal-NTG p<0,187, normal-POAG, p<0,056y NTG-POAG, p<0,837). El área bajo la curva superó el valor de 0,800 para todos los parámetros en estudio, incluyendo la asimetría de MT, exceptuando la asimetría intraocular del grosor RNFL, que reflejó el menor valor de AUROC, al igual que una menor sensibilidad para la identificación de los sujetos con NTG respecto a los normales (AUROC=0,626, sensibilidad=30%), POAG respecto a los normales (AUROC=0,644, sensibilidad=37%) y NTG respecto a POAG (AUROC=0,662, sensibilidad=13%).
ConclusiónLa asimetría intraocular de MT tiene un potencial significativo como parámetro distintivo de NTG y POAG.
Glaucoma is an optic neuropathy characterized by the progressive degeneration of retinal ganglion cells (RGCs) and their axons leading to a concurrent visual field loss. Intraocular pressure (IOP) has been recognized as the only treatable risk factor for primary open-angle glaucoma (POAG) and is considered a determining feature of POAG. However, an emerging perspective relates IOP in glaucoma description rather than in defining the disease process.1 The general practice among eye care professionals has been to classify POAG into two distinct entities based on IOP. Glaucomatous optic neuropathy (GON) in the presence of IOP higher than 21mm Hg being described as high-tension glaucoma and is commonly referred to as POAG2 and all other cases are referred to as either low-tension glaucoma or normal-tension glaucoma (NTG).3 Studies have previously established a positive effect of IOP reduction on disease progression in both NTG and POAG.4–6 Nonetheless, various additional risk factors, such as ocular and systemic circulation abnormalities, have been linked to the cause and progression of both POAG7–9 and NTG.10,11 NTG has long been considered a class of POAG on account of a multitude of similar attributes. However, studies have demonstrated thinner neuroretinal rims, deeper and steeper-sided visual field defects, and greater prevalence of disc hemorrhages in NTG patients compared with POAG patients.12–14
In both structure and function, asymmetry has been a well known characteristic of POAG. Previous research has demonstrated intraeye asymmetry between superior and inferior measures of visual field sensitivity,15,16 retinal nerve fiber layer (RNFL) thickness,17,18 neuroretinal rim width,19,20 and macular thickness21,22 to be in association with POAG. In addition, the glaucoma hemifield test, which demonstrates the visual sensitivity asymmetry between corresponding superior and inferior visual field zones has been a sensitive indicator of visual field loss.23 The use of intraeye asymmetry parameters bypasses the possible patient-specific and eye-specific effects as the measurements from the fellow hemispheres of the same eye are used as a basis of comparison. As such, asymmetry measurements may have superior diagnostic capability compared to raw measurements.
The recent introduction of Spectral Domain Optical Coherence Tomography (SD-OCT) technology provides real time, rapid, high resolution in vivo scans of ocular tissues and thus facilitates the assessment of retinal nerve fiber layer as well as macular thickness. Studies have previously established normative OCT measurements in healthy population24,25 as well as consistently shown that both peripapillary retinal nerve fiber layer (pRNFL) thickness and MT are lower in glaucomatous eyes.26–29
The posterior pole symmetry analysis scanning protocol available commercially by Heidelberg Engineering for use within their SD-OCT instrument facilitates the evaluation of macular thickness asymmetry in glaucoma There is a paucity of data in the literature regarding the diagnostic capability of macular thickness asymmetry between NTG and POAG. This study was designed to evaluate the diagnostic performance of RNFL and macular thickness asymmetry parameters in POAG and NTG. We also aimed to determine whether these asymmetry parameters could discriminate NTG from POAG.
Material and methodsStudy populationThis was a prospective, cross-sectional, hospital based study including 90 eyes of 90 subjects: 30 normal, 30 with NTG and 30 with POAG. Participants were recruited from the Glaucoma clinic (glaucoma patients) of the B. P. Koirala Lions Center for Ophthalmic Studies, Institute of Medicine, Tribhuvan University Teaching Hospital as a part of the institutional glaucoma research project. For each subject, one eye was randomly selected for study. The study was conducted in accordance with the ethical standards stated in the Declaration of Helsinki, and approved by the Institutional Review Board of Institute of Medicine. Written informed consent was obtained from all recruited individuals prior to the first intervention of the study.
All participants underwent a complete ophthalmic examination, including visual acuity, refraction, intraocular pressure measurement with Goldmann tonometry, and dilated fundus examination with stereoscopic biomicroscopy of optic nerve head under slit-lamp and indirect ophthalmoscopy, ultrasonic pachymetry (Axis II PR, Quantel Medical), SAP (Octopus 301 Haag-Streit, Interzeag International-AG, Schlieren, Switzerland) and SD-OCT scanning (SD-OCT Spectralis HRA+OCT, Heidelberg Engineering, Germany). The inclusion criteria included age older than 35 years; patients diagnosed as NTG and POAG; open angles; good-quality scans obtained in peripapillary RNFL thickness evaluation by OCT defined as a signal-to-noise ratio of >35; reliable SAP performed at ±1 month from OCT imaging; and refractive error within a ±5 spherical diopter range, with less than ±3 cylinder diopters. Criteria for exclusion of a patient from the study were best corrected visual acuity on the Snellen chart worse than 20/60, any ocular conditions including corneal and vitro-retinal diseases which could interfere with obtaining reliable visual fields (VFs) or good quality retinal scans, or significant parapapillary atrophy that caused blind spot enlargement on the visual field tests, interfered with VF readings, or causing false nerve fiber layer thickness data by OCT evaluation. Patients who could not undergo complete reliable VF test with three attempts and those with any other ophthalmic or neurologic conditions that could result in SAP defects were excluded as well.
Glaucomatous eyes were defined as those with a glaucomatous visual field defect confirmed by 2 reliable visual field examinations and by the appearance of a glaucomatous optic disc with typical loss of neuroretinal rim as judged by slit-lamp biomicroscopy (cup-to-disc ratio, >0.7; intereye cup asymmetry, >0.2; or neuroretinal rim notching, focal thinning, disc hemorrhage, or vertical elongation of the optic cup). These were categorized into 2 subgroups according to the IOP level. The NTG group was defined as those with untreated peak IOP lower than 21mm Hg on repeated 3 measurements taken at different times on separate visits during clinical follow-up. The POAG group included those with IOP before treatment exceeding 21mm Hg based on 3 measurements on different days. The control group comprised of age- and sex matched normal subjects from patients referred for routine ophthalmic examination and hospital staffs who had no ocular disease and no history of intraocular or laser surgery other than uncomplicated cataract surgery. The subjects in the control group had a normal anterior segment, open angles, and normal posterior segment findings, as well as a normal optic nerve head appearance in their ophthalmic examinations. IOP measurements were lower than 21mmHg without any medication, and normal visual field result with SAP.
Standard automated perimetrySAP was performed with Normal strategy on OCTOPUS 301 after dark adapting the participant for 3–5min prior to the test. A reliable VF test was defined as one with less than 33% fixation loss and less than 20% positive and negative catch trials. Glaucomatous VF defect was defined, in accordance with criteria set by Hodapp et al., as MD >+2.0dB or LV >6.0dB2 (equivalent to being triggered at the 5% level on the Humphrey Field Analyzer)30 or both; at least 25% of points depressed below the 5% level and 15% of points depressed below the 1% level and with or without points within central 5° and one or both hemifields with sensitivity 15dB or less.31 The global indices obtained in the second examination were included in the study to minimize the impact of learning particularly in the group with healthy eyes who were naive to visual field testing. SAP was performed by the same operator in all cases.
Spectral domain optical coherence tomographyAll patients were scanned using the commercially available SD-OCT Spectralis HRA+OCT (Heidelberg Engineering). This instrument uses a wavelength of 820nm in the near infrared spectrum in the SLO mode. The light source of the SD-OCT is a super luminescent diode with a wavelength of 870nm. Infrared images and OCT scans (40,000 A-Scans/s) of the dual laser scanning systems are acquired simultaneously. The macular thickness measurements were obtained using the posterior pole asymmetry scan protocol. This scan protocol, which acquires 61 raster scans per eye, uses an image segmentation algorithm that automatically identifies Bruch's membrane and the internal limiting membrane and derives thickness data by calculating distances between these structures. For peripapillary RNFL thickness, sixteen consecutive circular B-scans (3.4-mm diameter, 768 A-scans) centered at the optic disc were automatically averaged to reduce speckle noise. Peripapillary RNFL thickness was assessed between the anterior and posterior margins of RNFL delineated by the computer algorithm. Peripapillary RNFL thickness parameters evaluated in this study were the average thickness and the thickness at two clock hour positions, with the 6-o’clock position inferior and the 12-o’clock position superior. Internal fixation was used for all scans. Intraeye retinal and macular thickness asymmetry were calculated as the absolute difference between superior and inferior hemispheres of the eye. All images were obtained with image quality scores of at least 60 as recommended by the manufacturer. A single user performed at least two retinal scans in all the cases and the scans with best image quality were considered. The retinal scans were performed within one month of clinical examination.
Statistical analysisAll the variables studied followed a normal distribution as verified by the Shapiro–Wilk test and graphical Q–Q plots. To compare quantitative variables among the different groups, Analysis of Variance (ANOVA) was used with Games Howell correction for unequal variances and Tukey Honestly Significant Difference for equal variances. The area under receiver operating characteristic (AROC) curve was calculated to assess the ability of each testing parameters to differentiate normal and each of the two other study groups. An AROC of 1.0 represented perfect discrimination, whereas an AROC of 0.5 represented chance discrimination. Sensitivity and specificity of each test parameter was determined by obtaining the highest sensitivities, with target specificity set at ≥90%. In all statistical analyses, p <0.05 was considered statistically significant. Statistical analyses were done using SPSS v. 17 software for Windows and Med Calc, v. 12.3.0 was used to compare the AROC's.
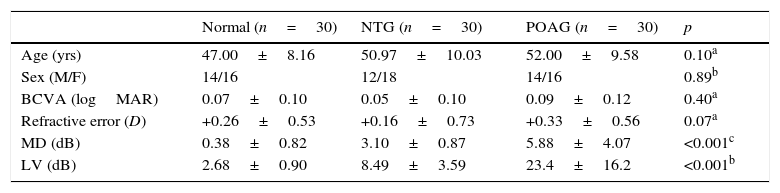
ResultsA total of 90 subjects comprising of 30 subjects with POAG, 30 subjects with NTG and 30 normal subjects who met the inclusion criteria were enrolled for this investigation. Only one eye of the subjects was considered for inclusion in the study. There were no intergroup differences for age, sex, best corrected visual acuity (BCVA) and refractive error as shown in Table 1. As expected glaucomatous groups had worse visual fields indices than the healthy subjects. The visual field indices, MD and LV, were significantly different among the three diagnostic groups, [F(2,87)=49.233, p<0.001] and [F(2,87)=37.217, p<0.001] respectively. The post hoc analysis using Games Howell adjustment for multiple comparisons demonstrated a significant difference in MD and LV between normal-POAG, normal-NTG and NTG-POAG comparison groups (p<0.001).
Descriptive statistics for retinal nerve fiber layer and macular thickness asymmetry study.
| Normal (n=30) | NTG (n=30) | POAG (n=30) | p | |
|---|---|---|---|---|
| Age (yrs) | 47.00±8.16 | 50.97±10.03 | 52.00±9.58 | 0.10a |
| Sex (M/F) | 14/16 | 12/18 | 14/16 | 0.89b |
| BCVA (logMAR) | 0.07±0.10 | 0.05±0.10 | 0.09±0.12 | 0.40a |
| Refractive error (D) | +0.26±0.53 | +0.16±0.73 | +0.33±0.56 | 0.07a |
| MD (dB) | 0.38±0.82 | 3.10±0.87 | 5.88±4.07 | <0.001c |
| LV (dB) | 2.68±0.90 | 8.49±3.59 | 23.4±16.2 | <0.001b |
NTG – normal tension glaucoma; POAG – primary open-angle glaucoma; BCVA – best corrected visual acuity; MD – mean deviation; LV – loss variance.
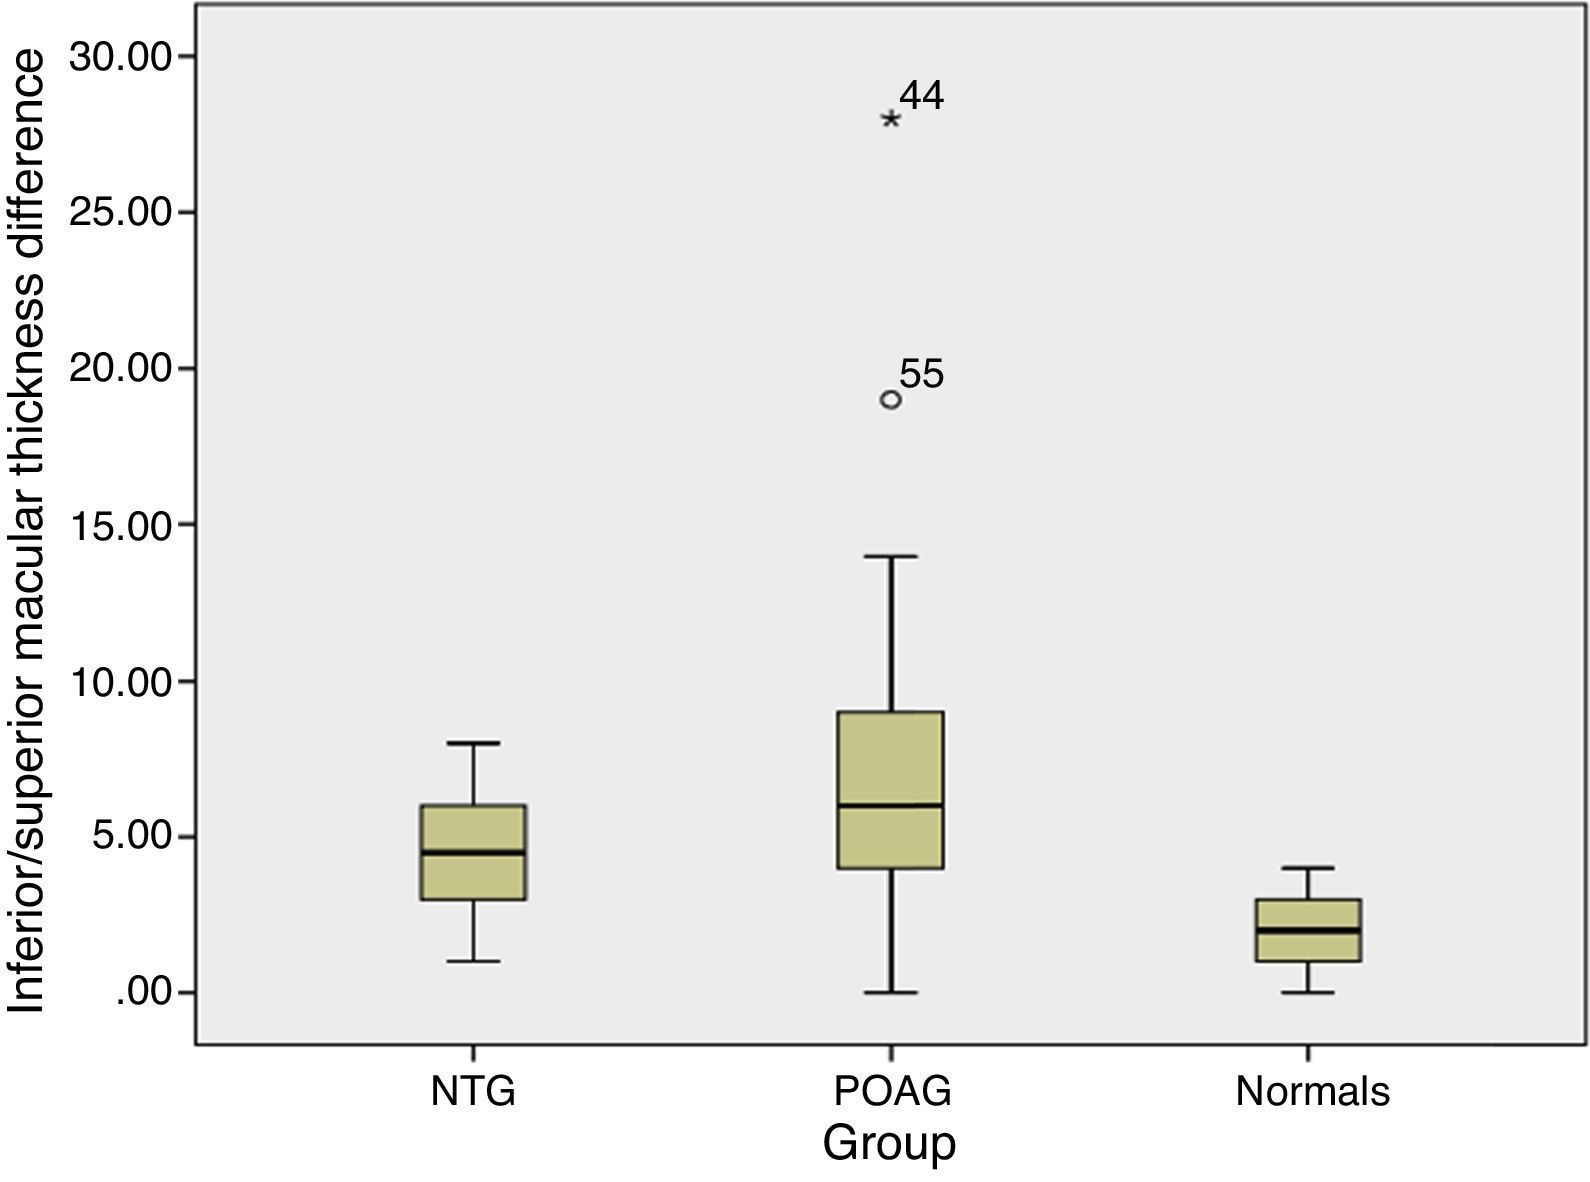
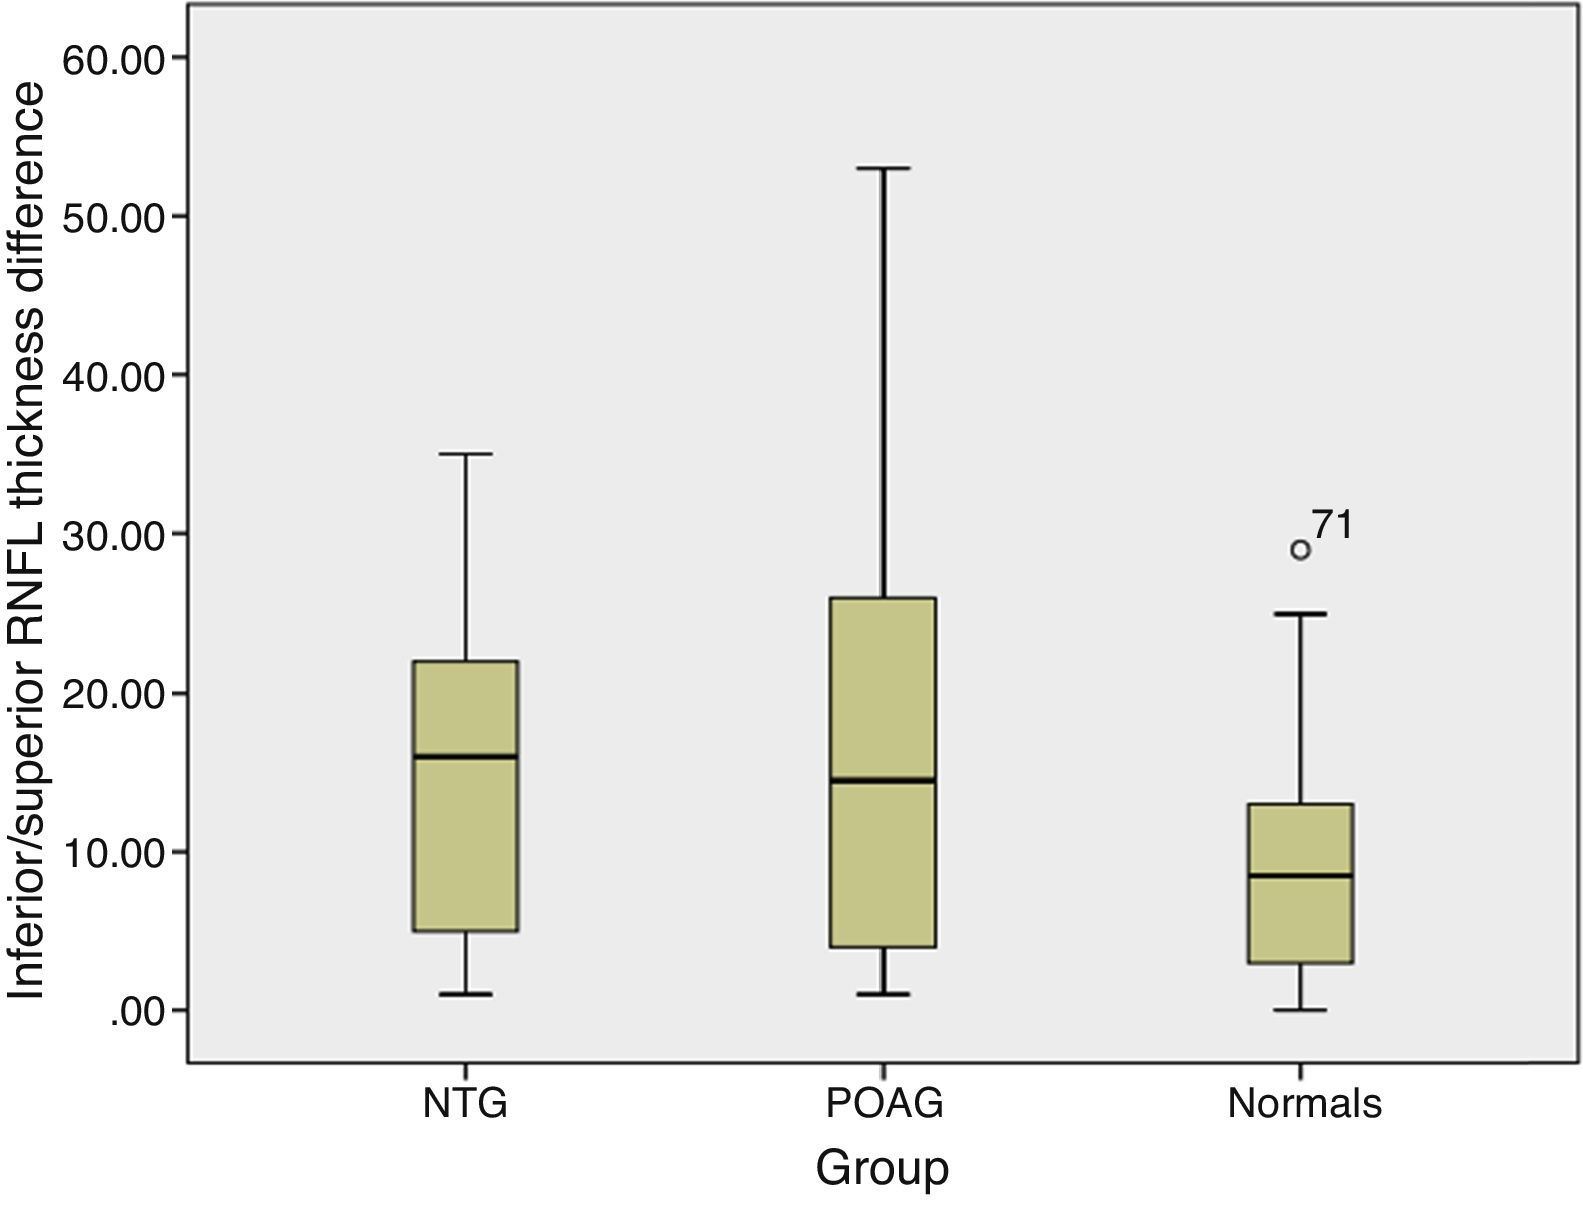
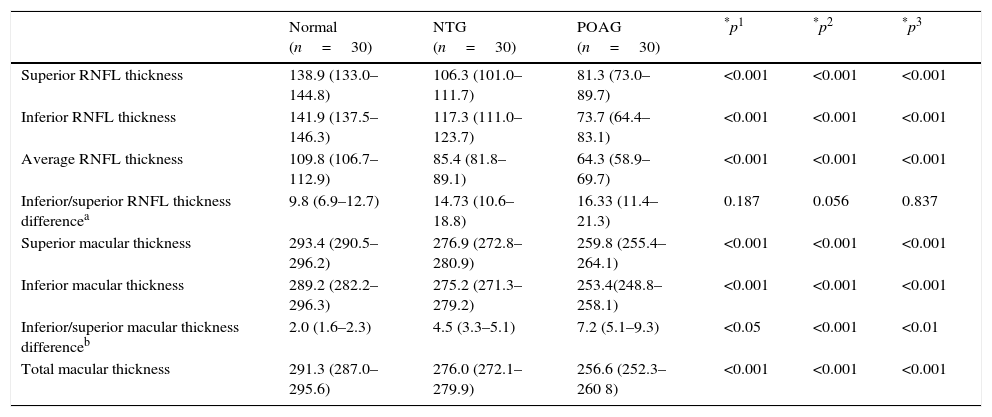
The RNFL thickness and macular thickness parameters were thicker in healthy subjects followed by subjects with NTG and then POAG. Post hoc tests using Tukey l adjustments revealed significant differences in RNFL thickness and macular thickness parameters across all comparison groups (p<0.001). The mean (95% CI) macular thickness asymmetry was 2.0μm (1.6–2.3) in normal subjects, 4.5μm (3.3–5.1) in NTG and 7.2μm (5.1–9.3) in POAG (Fig. 1). Similarly, the mean (95% CI) RNFL thickness asymmetry increased from normal subjects, 9.8μm (6.9–12.7) to NTG, 14.73μm (10.6–18.8) and POAG, 16.33μm (11.4–21.3) (Fig. 2). One way ANOVA using Tukey HSD for multiple comparisons showed a significant difference in macular thickness asymmetry for all comparison groups (normal-NTG, p<0.05; normal-POAG, p<0.001; and NTG-POAG, p<0.001). Furthermore intraeye retinal nerve fiber thickness measurements were not different between the groups (normal-NTG, p<0.187; normal-POAG, p<0.056; and NTG-POAG, p<0.837) (Table 2).

 than normal. The box plot represents 95% confidence intervals. POAG – primary open angle glaucoma; NTG – normal tension glaucoma.")
Average retinal nerve fiber layer thickness asymmetry in different study groups. The inferior/superior retinal nerve fiber layer thickness difference was greater in glaucomatous groups (NTG and POAG) than normal. The box plot represents 95% confidence intervals. POAG – primary open angle glaucoma; NTG – normal tension glaucoma.
Retinal nerve fiber layer thickness and macular thickness parameters categorized by study groups.
| Normal (n=30) | NTG (n=30) | POAG (n=30) | *p1 | *p2 | *p3 | |
|---|---|---|---|---|---|---|
| Superior RNFL thickness | 138.9 (133.0–144.8) | 106.3 (101.0–111.7) | 81.3 (73.0–89.7) | <0.001 | <0.001 | <0.001 |
| Inferior RNFL thickness | 141.9 (137.5–146.3) | 117.3 (111.0–123.7) | 73.7 (64.4–83.1) | <0.001 | <0.001 | <0.001 |
| Average RNFL thickness | 109.8 (106.7–112.9) | 85.4 (81.8–89.1) | 64.3 (58.9–69.7) | <0.001 | <0.001 | <0.001 |
| Inferior/superior RNFL thickness differencea | 9.8 (6.9–12.7) | 14.73 (10.6–18.8) | 16.33 (11.4–21.3) | 0.187 | 0.056 | 0.837 |
| Superior macular thickness | 293.4 (290.5–296.2) | 276.9 (272.8–280.9) | 259.8 (255.4–264.1) | <0.001 | <0.001 | <0.001 |
| Inferior macular thickness | 289.2 (282.2–296.3) | 275.2 (271.3–279.2) | 253.4(248.8–258.1) | <0.001 | <0.001 | <0.001 |
| Inferior/superior macular thickness differenceb | 2.0 (1.6–2.3) | 4.5 (3.3–5.1) | 7.2 (5.1–9.3) | <0.05 | <0.001 | <0.01 |
| Total macular thickness | 291.3 (287.0–295.6) | 276.0 (272.1–279.9) | 256.6 (252.3–260 8) | <0.001 | <0.001 | <0.001 |
Values are expressed in micrometers as mean (95% CI of the mean).
NTG – normal tension glaucoma, POAG – primary open-angle glaucoma, n – number.
p1, Normal vs NTG; p2, Normal vs POAG; p3, POAG vs NTG.
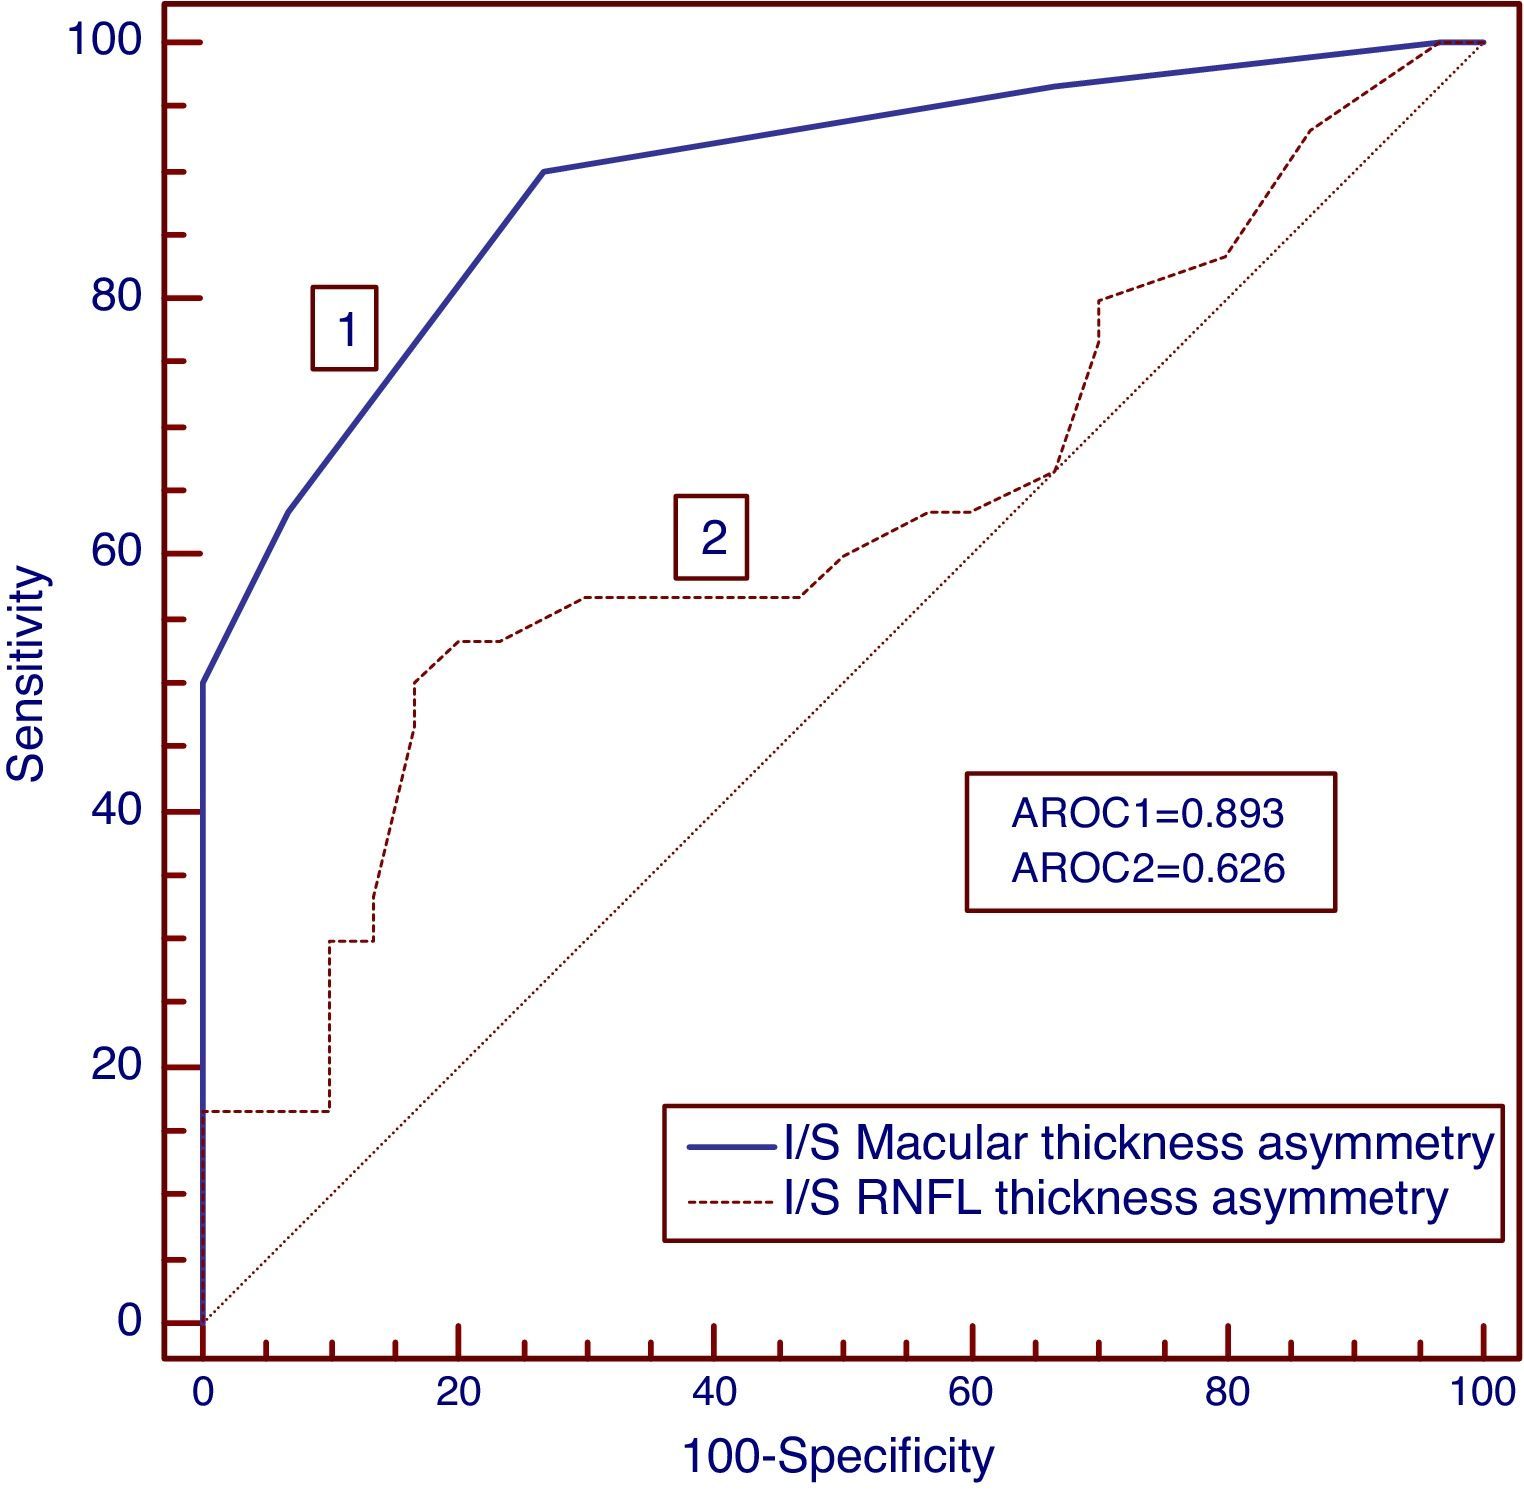
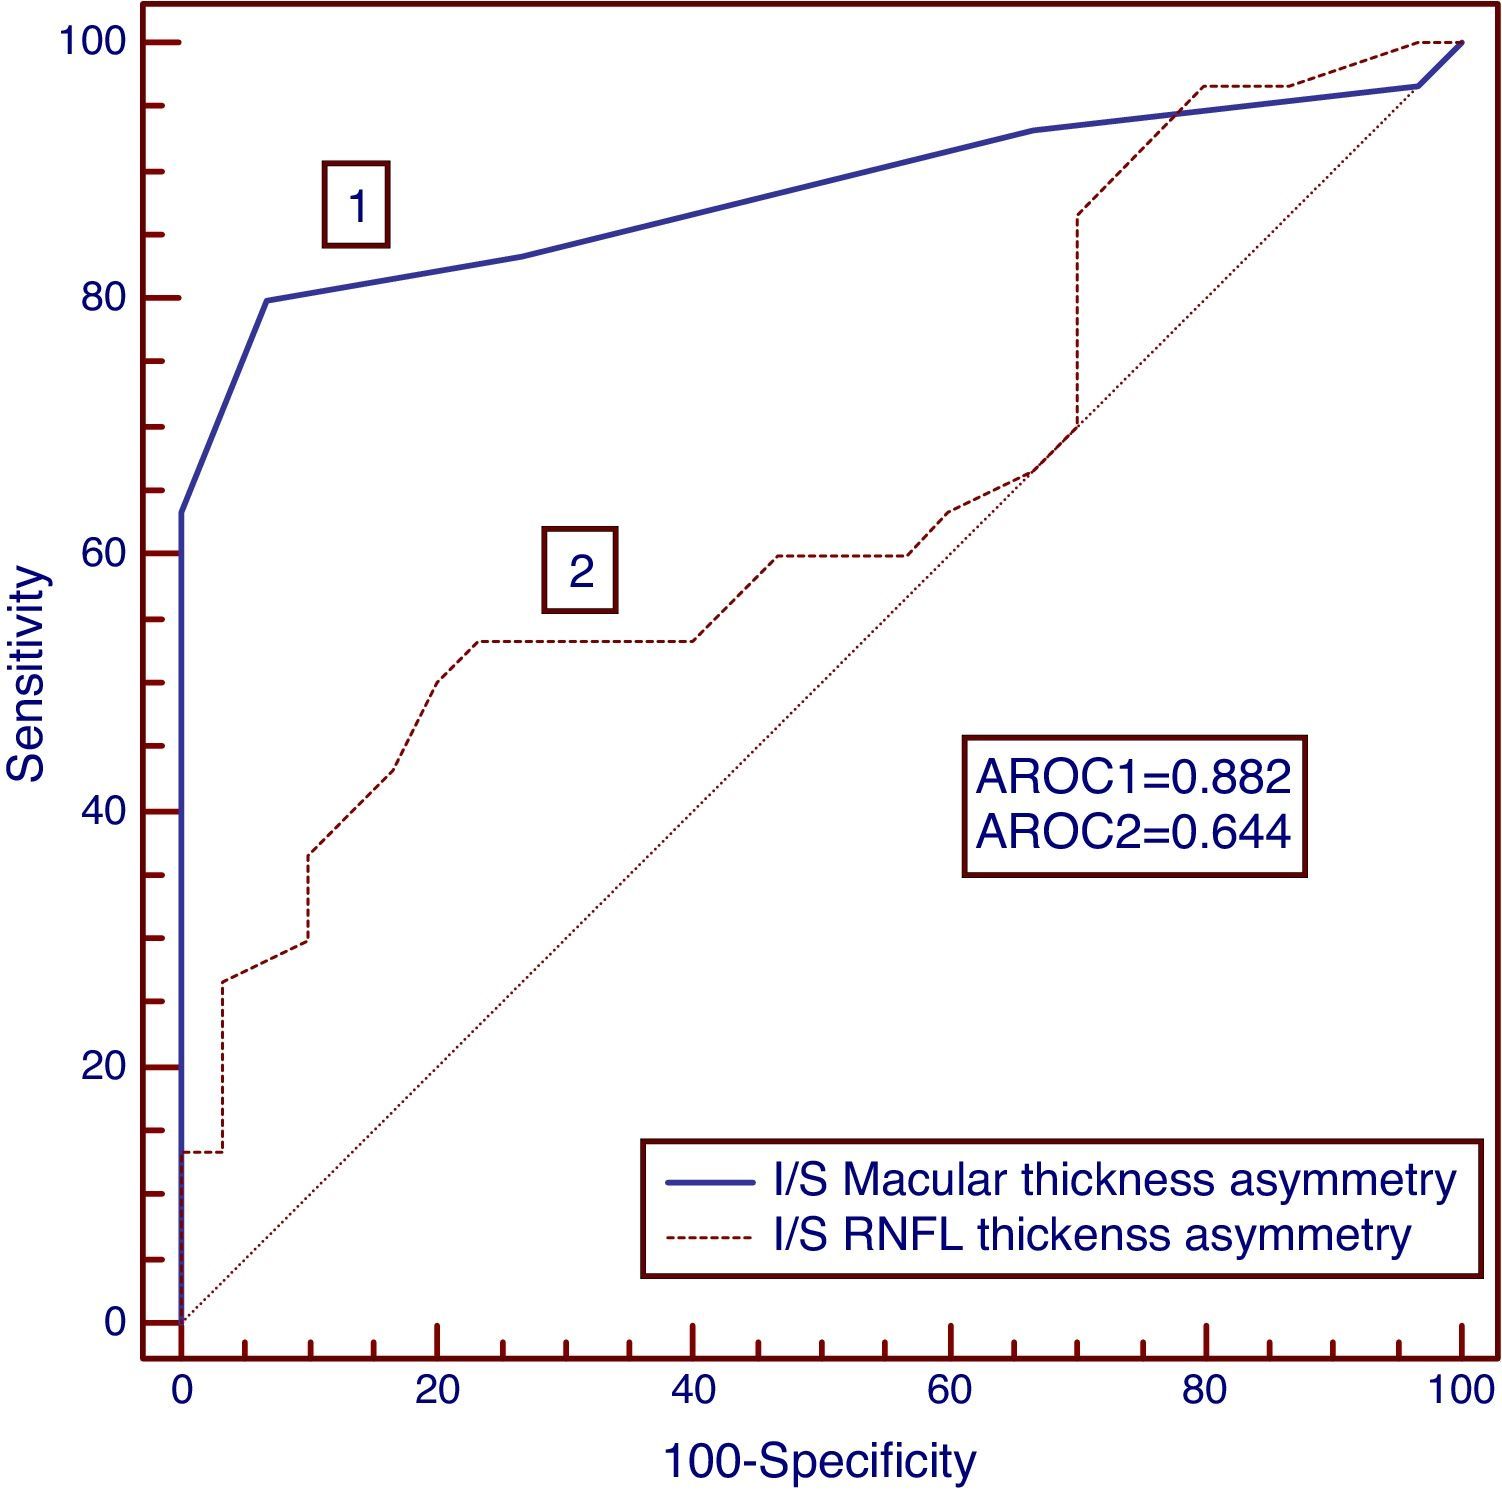
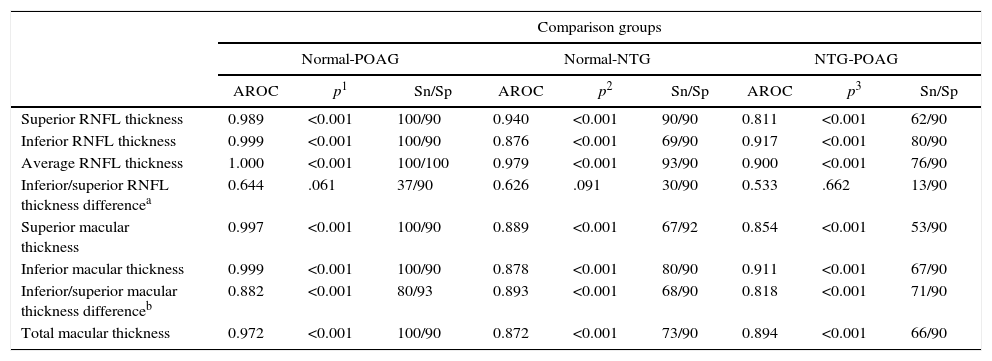
To identify the diagnostic ability for NTG and POAG, the area under receiver operating characteristic curves (AROC) were calculated for RNFL and macular thickness as well as asymmetry parameters and the sensitivities at a high specificity of >90% was determined which are listed in Table 3. The AROCs for macular thickness asymmetry were significantly larger for discriminating normal-NTG (AROC=0.893); normal-POAG (AROC=0.882) and NTG-POAG (AROC=0.818) when compared to RNFL thickness asymmetry (AROC for normal-NTG, 0626; normal-POAG, 0.644; NTG-POAG, 0.533). Intraeye macular thickness asymmetry also demonstrated higher sensitivities than the intraeye retinal thickness asymmetry for both NTG (Fig. 3) and POAG study groups (Fig. 4). The AROC's for the macular thickness and asymmetry parameters were not significantly different from RNFL thickness parameters. The inferior–superior RNFL thickness asymmetry had significantly smaller AROCs as well as sensitivities at a specificity of >90% when compared to the rest of the diagnostic parameters (normal-NTG, AROC, 0.626, sensitivity 30%; normal-POAG, AROC, 0.644, sensitivity 37%; NTG-POAG, AROC, 0.533, sensitivity 13%).
AROC and specificity at >90% sensitivity for RNFL parameters for comparing normal and glaucoma groups.
| Comparison groups | |||||||||
|---|---|---|---|---|---|---|---|---|---|
| Normal-POAG | Normal-NTG | NTG-POAG | |||||||
| AROC | p1 | Sn/Sp | AROC | p2 | Sn/Sp | AROC | p3 | Sn/Sp | |
| Superior RNFL thickness | 0.989 | <0.001 | 100/90 | 0.940 | <0.001 | 90/90 | 0.811 | <0.001 | 62/90 |
| Inferior RNFL thickness | 0.999 | <0.001 | 100/90 | 0.876 | <0.001 | 69/90 | 0.917 | <0.001 | 80/90 |
| Average RNFL thickness | 1.000 | <0.001 | 100/100 | 0.979 | <0.001 | 93/90 | 0.900 | <0.001 | 76/90 |
| Inferior/superior RNFL thickness differencea | 0.644 | .061 | 37/90 | 0.626 | .091 | 30/90 | 0.533 | .662 | 13/90 |
| Superior macular thickness | 0.997 | <0.001 | 100/90 | 0.889 | <0.001 | 67/92 | 0.854 | <0.001 | 53/90 |
| Inferior macular thickness | 0.999 | <0.001 | 100/90 | 0.878 | <0.001 | 80/90 | 0.911 | <0.001 | 67/90 |
| Inferior/superior macular thickness differenceb | 0.882 | <0.001 | 80/93 | 0.893 | <0.001 | 68/90 | 0.818 | <0.001 | 71/90 |
| Total macular thickness | 0.972 | <0.001 | 100/90 | 0.872 | <0.001 | 73/90 | 0.894 | <0.001 | 66/90 |
p1, p value for normal-POAG comparison group; p2, p value for normal-NTG comparison group; p3, p value for NTG-POAG comparison group
POAG – primary open-angle glaucoma; NTG – normal tension glaucoma.
 curves for NTG group. The area under ROC curve was greater for macular thickness asymmetry than retinal nerve fiber layer thickness asymmetry.")
 curves for POAG group. The area under ROC curve was greater for macular thickness asymmetry than retinal nerve fiber layer thickness asymmetry.")
There is a paucity of data regarding the diagnostic precision of macular and RNFL asymmetry parameters for the diagnosis of glaucoma. Sullivan-Mee et al., in their study, evaluated the diagnostic capabilities of intereye and intraeye differences in RNFL thickness and macular thickness for identifying early POAG.23 They concluded that although structural asymmetry parameters performed well, further study were necessary to validate the results. This study was designed with a purpose of establishing and comparing the diagnostic ability of intraeye RNFL thickness and intraeye macular thickness asymmetry in glaucomatous eyes. In addition, we aimed at determining if these intraeye asymmetry measurements facilitated the discrimination of NTG and POAG.
Glaucoma has been characterized by structural loss in the form of optic disc changes and thinning of RNFL as well as functional loss indicated by decrease in visual field sensitivity. The structure–function relationship in glaucoma has been widely studied in the literature with reports suggesting that more often, the structural changes precede the functional loss.32,33 Given the importance of assessing structural changes for early indication of glaucomatous damage, RFNL thickness evaluation has gained popularity with the introduction of high resolution imaging technologies. Peripapillary RNFL thickness evaluation using OCT has been the cornerstone of assessing structural damage in glaucoma in the recent years owing to the fact that RNFL is thicker in peripapillary regions. With advances in technology, the measurement of retinal thickness in the macular area has also become feasible. Reports have suggested that MT assessment could be a valuable surrogate measure for evaluating glaucomatous structural changes, because such damage occurs in RGCs, which are multilayered and more dense in the macular region.27,28 However, some studies have indicated that macular thickness parameters have inferior performance for early indication of glaucoma than the pRNFL thickness parameters.34,35 This might be due to the fact that considering overall macular thickness is sure to lead in inferior sensitivity as the macula contains regions not sensitive to glaucomatous structural changes. This has prompted a more detailed evaluation of macular inner retinal layer thickness. Seong et al. have reported that inner retinal thickness showed glaucoma discrimination ability comparable to that of pRNFL thickness in glaucoma patients with early VF defects.36
In this study, the macular thickness asymmetry measured as the absolute difference of inferior and superior hemispheres demonstrated a diagnostic capability comparable to RNFL thickness and macular thickness parameters while discriminating subjects with NTG from POAG as well as normal subjects. Whereas, the RNFL thickness asymmetry had the lowest AROC as well as the least sensitivity for identifying subjects with NTG from normal (AROC=0.626, sensitivity=30%); POAG from normal (AROC=0.644, sensitivity=37%) and NTG from POAG (AROC=0.533, sensitivity=13%). The area under ROC curves exceeded 0.800 for all the studied parameters except for intraeye RNFL thickness asymmetry. The RNFL thickness asymmetry could not statistically discriminate NTG from POAG as demonstrated by the asymmetries not being statistically different between the two diagnostic groups (p=0.837). In contrary, the macular thickness asymmetry adequately revealed a distinction between NTG and POAG as the asymmetry measurement was higher in POAG compared to NTG and the difference was statistically significant between these two groups (p<0.001). These findings show the significant potential of macular thickness asymmetry parameter for the diagnosis of glaucoma given that the average and sectoral RNFL thicknesses are considered as the more significant parameters in glaucoma diagnosis. These also imply that macular thickness asymmetry could provide global indices of structural damage much in the way that the glaucoma hemifield test provides for assessing the functional damage using visual fields in glaucoma.
Sullivan-Mee et al.23 in their study, observed that RNFL thickness asymmetry demonstrated the worst diagnostic capability of any study parameter. They also established intraeye macular thickness asymmetry as one of the best parameters for identifying early glaucoma. Our study is in agreement with the findings of Sullivan-Mee et al. as the intraeye RNFL thickness asymmetry parameter has the lowest area under ROC and the least sensitivity of all the parameters in this study.
In our study, we observed that the RNFL and macular thickness was progressively thinner from normal to NTG and then to POAG. This is consistent with the previous studies that have reported similar findings.35–37 We also noted that macular parameters had similar area under ROC curves and comparable sensitivities to RNFL thickness parameters in strong agreement with the study by Nakatani et al.35 The study by Sullivan-Mee et al.23 concluded that the diagnostic performances of RNFL thickness and intraeye macular thickness asymmetry were superior and identified these two parameters being adequately related to the early diagnosis of glaucoma which is in strong agreement with the findings of our study. Um et al., in their study,38 inferred that asymmetry in hemifield macular thickness may serve as an assessment tool in the early diagnosis of glaucoma by showing a similar level of diagnostic performance compared to sectoral RNFL thickness. Although, our study differs from this report in that Um and associates evaluated the diagnostic performance of asymmetry in macular hemifield thickness including glaucoma suspects, early and advanced glaucoma groups, we have established similar findings in strong agreement with NTG and POAG as our diagnostic study groups. This further strengthens the role of macular thickness asymmetry in being a pivotal potential clinical marker for glaucoma diagnosis.
Many studies have shown the importance of RNFL thickness and macular thickness parameters in the diagnosis of glaucoma and these have been well-established in the literature. However, there have been fewer accounts of the role of intraeye asymmetry parameters and their diagnostic performance in the literature. Given the fact that the intereye macular thickness asymmetry performed comparably to other previously established retinal and macular thickness parameters, it holds a substantial potential to aid as one of the structural parameters contributing in the early diagnosis of glaucoma and disease progression.
Our study is limited by its relatively small sample size and by the fact that it only evaluated the diagnostic performance of the intraeye macular thickness and RNFL thickness asymmetry measurements in two diagnostic groups, NTG and POAG without consideration of glaucoma suspects or preperimetric glaucoma. This may warrant the need for further studies including a larger sample covering more diverse glaucoma groups. Furthermore, the intrinsic limitations of the posterior pole asymmetry analysis must be considered as it only evaluates the central macular ganglion cells and is greatly affected by co-existing retinal pathologies, scan quality and segmentations errors.
In conclusion, this study provides evidence of the usefulness of macular thickness asymmetry measurements in glaucoma diagnosis by demonstrating comparable performance of intraeye macular thickness asymmetry to other RNFL and macular thickness parameters in the discrimination of NTG and POAG as well as glaucoma groups from normal subjects. We found very good sensitivity for macular thickness asymmetry measurements while RNFL thickness asymmetry showed poor diagnostic precision. Further studies incorporating a more diverse and larger sample should be conducted to confirm the findings of this study.
Funding sourcesThis work was supported in part by an unrestricted grant from Research to Prevent Blindness (Indianapolis, IN, USA).
Conflicts of interestPGD Consultant/Research Topcon, Research support-Heidelberg Engineering.


