

To investigate the change in visual acuity (VA) produced by different types of astigmatism (on the basis of the refractive power and position of the principal meridians) on normal accommodating eyes.
MethodsThe lens induced method was employed to simulate a set of 28 astigmatic blur conditions on different healthy emmetropic eyes. Additionally, 24 values of spherical defocus were also simulated on the same eyes for comparison. VA was measured in each case and the results, expressed in logMAR units, were represented against of the modulus of the dioptric power vector (blur strength).
ResultsLogMAR VA varies in a linear fashion with increasing astigmatic blur, being the slope of the line dependent on the accommodative demand in each type of astigmatism. However, in each case, we found no statistically significant differences between the three axes investigated (0°, 45°, 90°). Non-statistically significant differences were found either for the VA achieved with spherical myopic defocus (MD) and mixed astigmatism (MA). VA with simple hyperopic astigmatism (SHA) was higher than with simple myopic astigmatism (SMA), however, in this case non conclusive results were obtained in terms of statistical significance. The VA achieved with imposed compound hyperopic astigmatism (CHA) was highly influenced by the eye's accommodative response.
ConclusionsVA is correlated with the blur strength in a different way for each type of astigmatism, depending on the accommodative demand. VA is better when one of the focal lines lie on the retina irrespective of the axis orientation; accommodation favors this situation.
Investigar el cambio en la agudeza visual (AV) producido por los diferentes tipos de astigmatismo (sobre la base del poder refractivo y la posición de los principales meridianos) en ojos con acomodación normal.
MétodosSe utilizó el método de desenfoque inducido con lentes para simular un conjunto de veintiocho situaciones de desenfoque astigmático en diferentes ojos emetrópicos sanos. Además, se simularon veinticuatro valores de defecto esférico en los mismos ojos, a fines comparativos. Se midió la AV en cada caso, representándose los resultados, expresados en unidades logMAR, frente a los módulos del vector de potencia dióptrica (desenfoque).
ResultadosLa escala LogMAR para AV varía de manera lineal, incrementando la distorsión astigmática, dependiendo la inclinación de la línea de la demanda acomodativa en cada tipo de astigmatismo. Sin embargo, en cada caso, no hallamos diferencias significativas entre los tres ejes analizados (0°, 45°, 90°). No se hallaron diferencias estadísticamente significativas en cuanto a la AV lograda con el defecto miópico esférico (MD) y astigmatismo mixto (MA). La AV con astigmatismo hipermetrópico simple (SHA) fue más elevada que con astigmatismo miópico simple (SMA). Sin embargo, en este caso se obtuvieron resultados no concluyentes en términos de significancia estadística. La AV lograda con astigmatismo hipermetrópico compuesto (CHA) se vio altamente influenciada por la respuesta acomodativa del ojo.
ConclusionesLa AV guarda relación con el desenfoque de modo diferente para cada tipo de astigmatismo, dependiendo de la demanda de acomodación. La AV es mejor cuando una de las líneas focales está en la retina con independencia de la orientación del eje; la acomodación favorece esta situación.
Visual acuity (VA) is one of the standard parameters by which the outcome of most clinical trials is judged. Particularly important is the relationship between VA and the refractive state of the eye.1–4 However, VA is affected by different extrinsic parameters, such as the design of the optotype chart, its luminance and contrast, since these factors can affect the chart readability.5,6 Moreover, under the same experimental conditions, intrinsic parameters such as the subject's higher-order aberrations,7,8 pupil size,9 accomodation,10 the level of neural adaptation11–13 and the subjective perception of blur14 have been demonstrated to influence the results. More specifically, several studies have investigated the effects of the astigmatism on near and distance VA and/or subject's reading performance. Raasch15 proposed that the single parameter that better correlates refractive errors with VA is the strength (norm) of the vector that represents the refractive error.16,17 According to this theory the cylinder axis of the astigmatism should have no influence on the expected VA. This hypothesis was supported by Oechsner and Kusel using numerical simulations18 and later experimentally in different studies.19–23 On the contrary, Miller et al.10 and Wolffsohn et al.24 suggested that with-the-rule astigmatism (WTR) has a less negative influence on VA compared with against-the-rule (ATR) or oblique astigmatism. Trindade et al.,25 found that, after cataract and intraocular lens (IOL) implantation surgery, patients with ATR astigmatism had better uncorrected near VA than those with WTR astigmatism. On the contrary, in the description of a surgical method for optimizing the outcomes of refractive surgery, Alpins26 also assumed that WTR astigmatism has a greater optical tolerance than ATR or oblique astigmatism. Kobashi et al.27 reported that oblique astigmatism had lower VA and reading performance than those with uncorrected 0° and 90° axis of astigmatism. Atchinson et al.8 found that subjective blur-limits for cylinder at 0° axis, were greater (about 20%) than those for oblique axes. However, in a recent study28 the same main authors found that VA was affected significantly by the axis of the cylinder, with better VA for 90° than for any other orientation (45°, 135°, and 180°). Therefore, one issue that is still a matter of controversy is the impact of the astigmatic axis orientation on the near and distance acuities.
Moreover, the role that the accommodation plays in this context, has not been investigated in detail in anyone of the above mentioned studies. Recently, by measuring the accommodative response objectively, Stark et al.,29 found that astigmatism led to increased accommodative variability in certain individuals. Bradley et al.6 found that, contrary to what happens with spheres, both positive and negative cylindrical lenses at 90° and 180° located in front of an accommodating eye results in a similar VA; indicating that this effect is due to the fact that the human eye cannot selectively accommodate to one meridian. Singh et al.30 explored the relation between uncorrected simple myopic and simple hyperopic astigmatism and VA in pseudophakic eyes. They found that VA is deteriorated significantly with increasing magnitudes of induced astigmatism for all axes tested 0°, 45°, 90° and 180° but no significant differences were found between axes. However, they also found that loss in distance VA was greater for induced myopic astigmatism than for induced hyperopic astigmatism. However, to the best of our knowledge, the influence of compound hyperopic astigmatism on the VA of subjects has not been investigated.
By using the lens induced refractive error method,22 in this study our aim was to investigate for the first time the rate of change in VA produced by different types of astigmatism (on the basis of the refractive power and position of the principal meridians) on normal accommodating eyes. The effects of positive and negative spherical defocus on VA, under the same experimental conditions were also investigated for completitude.
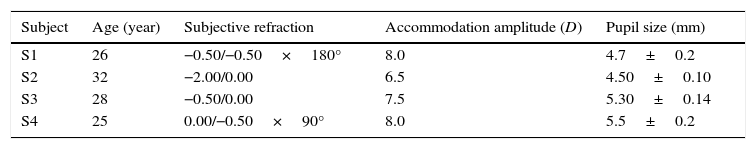
MethodsAs in previous studies,6,19,20 refractions were induced with trial lenses in a trial frame in a reduced number of eyes. In this case four different young subjects, with no ocular history of any visual disturbance, participated in this study. Following the precepts of the Declaration of Helsinki, an informed consent was obtained from the subjects and permission was obtained from the Ethics Commission of the University of Valencia. Only the right eyes were tested, being the left eye occluded to prevent convergence effects. For all subjects compensated VA was 20/20 or better. The accommodation amplitude was measured monocularly with the push-up method. Objective refraction and pupil sizes were measured with the Grand Seiko WAM-5500 open-field autorefractor under the same experimental lighting conditions. These results are summarized in Table 1. During the experiment, pupil sizes and accommodation were not controlled artificially because this study attempted to gain understanding of the nature of VA in eyes in their natural states.
In all measurements, trial case lenses were placed in front of the eye as the (vector) sum of the distance refraction plus the induced refractive error. In this way, for each induced refraction, the corresponding conventional script notation in terms of sphere S, cylinder power C and axis α (S;Cxα) was converted to power vector coordinates (M, J0, J45) and the norm of the power vector, or blur strenght B, was computed using the following equations16:

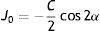
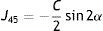
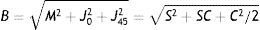
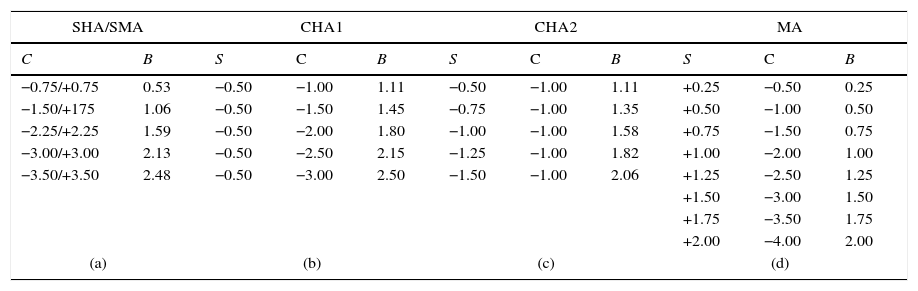
The different types of astigmatism induced on each subject and the associated blur strengths powers of the employed lenses are shown in Table 2, where SMA is simple myopic astigmatism, SHA is simple hyperopic astigmatism and MA is mixed astigmatism. As can be seen, we have considered two different types of compound hyperopic astigmatism (CHA). In the first one, CHA1, the less hyperopic focal line was kept at the same distance from the retina (constant sphere). In the second one, CHA2, the power of the cylinder was kept constant, and the location of the interval of Sturm was varied with the power of the sphere. For each combination of powers three axes were considered: 0°, 45° and 90°. Aditionally, for completitude, 24 values of spherical defocus were also simulated: 8 myopic defocus (MD) with positive spheres [from +0.25 D to +2.00 D in steps 0.25 D] and 16 hyperopic defocus with negative spheres [from −1.50 D to −9.00 D in steps 0.50 D].
Values of sphere (S) and cylinder (C) used to simulate the different types the astigmatism defocus. B is the modulus of the corresponding power vector or blur strength, associated to each combination of lenses. (a) Simple hyperopic astigmatism (SHA) and simple myopic astigmatism (SMA) differ in the sign of the cylinder. (b) and (c) CHA1 and CHA2 are two different typs of compound hyperopic stigmatism (see the main text for details). (d) Jackson Cross-cylinders of different powers are used represent mixed astigmatism (MA).
| SHA/SMA | CHA1 | CHA2 | MA | |||||||
|---|---|---|---|---|---|---|---|---|---|---|
| C | B | S | C | B | S | C | B | S | C | B |
| −0.75/+0.75 | 0.53 | −0.50 | −1.00 | 1.11 | −0.50 | −1.00 | 1.11 | +0.25 | −0.50 | 0.25 |
| −1.50/+175 | 1.06 | −0.50 | −1.50 | 1.45 | −0.75 | −1.00 | 1.35 | +0.50 | −1.00 | 0.50 |
| −2.25/+2.25 | 1.59 | −0.50 | −2.00 | 1.80 | −1.00 | −1.00 | 1.58 | +0.75 | −1.50 | 0.75 |
| −3.00/+3.00 | 2.13 | −0.50 | −2.50 | 2.15 | −1.25 | −1.00 | 1.82 | +1.00 | −2.00 | 1.00 |
| −3.50/+3.50 | 2.48 | −0.50 | −3.00 | 2.50 | −1.50 | −1.00 | 2.06 | +1.25 | −2.50 | 1.25 |
| +1.50 | −3.00 | 1.50 | ||||||||
| +1.75 | −3.50 | 1.75 | ||||||||
| +2.00 | −4.00 | 2.00 | ||||||||
| (a) | (b) | (c) | (d) | |||||||
Back vertex distance was set to 12mm, and for defocus values higher than 4.0 D, the effective power of the lens was calculated.
Due to the large number of measurements performed with each eye, VA was measured using the IVAC test,31 since it gives repeatable and reliable results, avoiding learning effects.20 The Snellen letters option of this test was taken to perform the measurements, i.e., letters with a variable spacing between them and a variable progression of letter size with 100% constrast.32 The test was presented on a calibrated CRT monitor of luminance 125cd/m2 at a distance of 5meters. The measurements were performed in a quiet environment exclusively used for research activities with constant ambient lighting 650±10lux. For each value of the induced astigmatism, subjects were asked to identify optotypes on each line from left to right, and the VA was recorded when more than 50% of the smallest optotypes were correctly identified. In each session of measurements the values of power and axis were randomized. Sessions were limited to 45min in order to minimize the effects of fatigue, leaving a short interval of time between measurements. Several days elapsed between sessions. Measurements were done three times for each blur condition, and the mean of the measurements was used in the analysis.
Statistical analysis was performed using Statistical Product and Service Solutions (SPSS 19.0) for Windows software. The data were tested for normality of distribution Shapiro–Wilk (p>0.05 in all cases) and equivalence of variance (F-test). For each evaluated astigmatism, a linear regression between B and VA was obtained, and both the correlation coefficient, R2, and the slope, b, were computed.
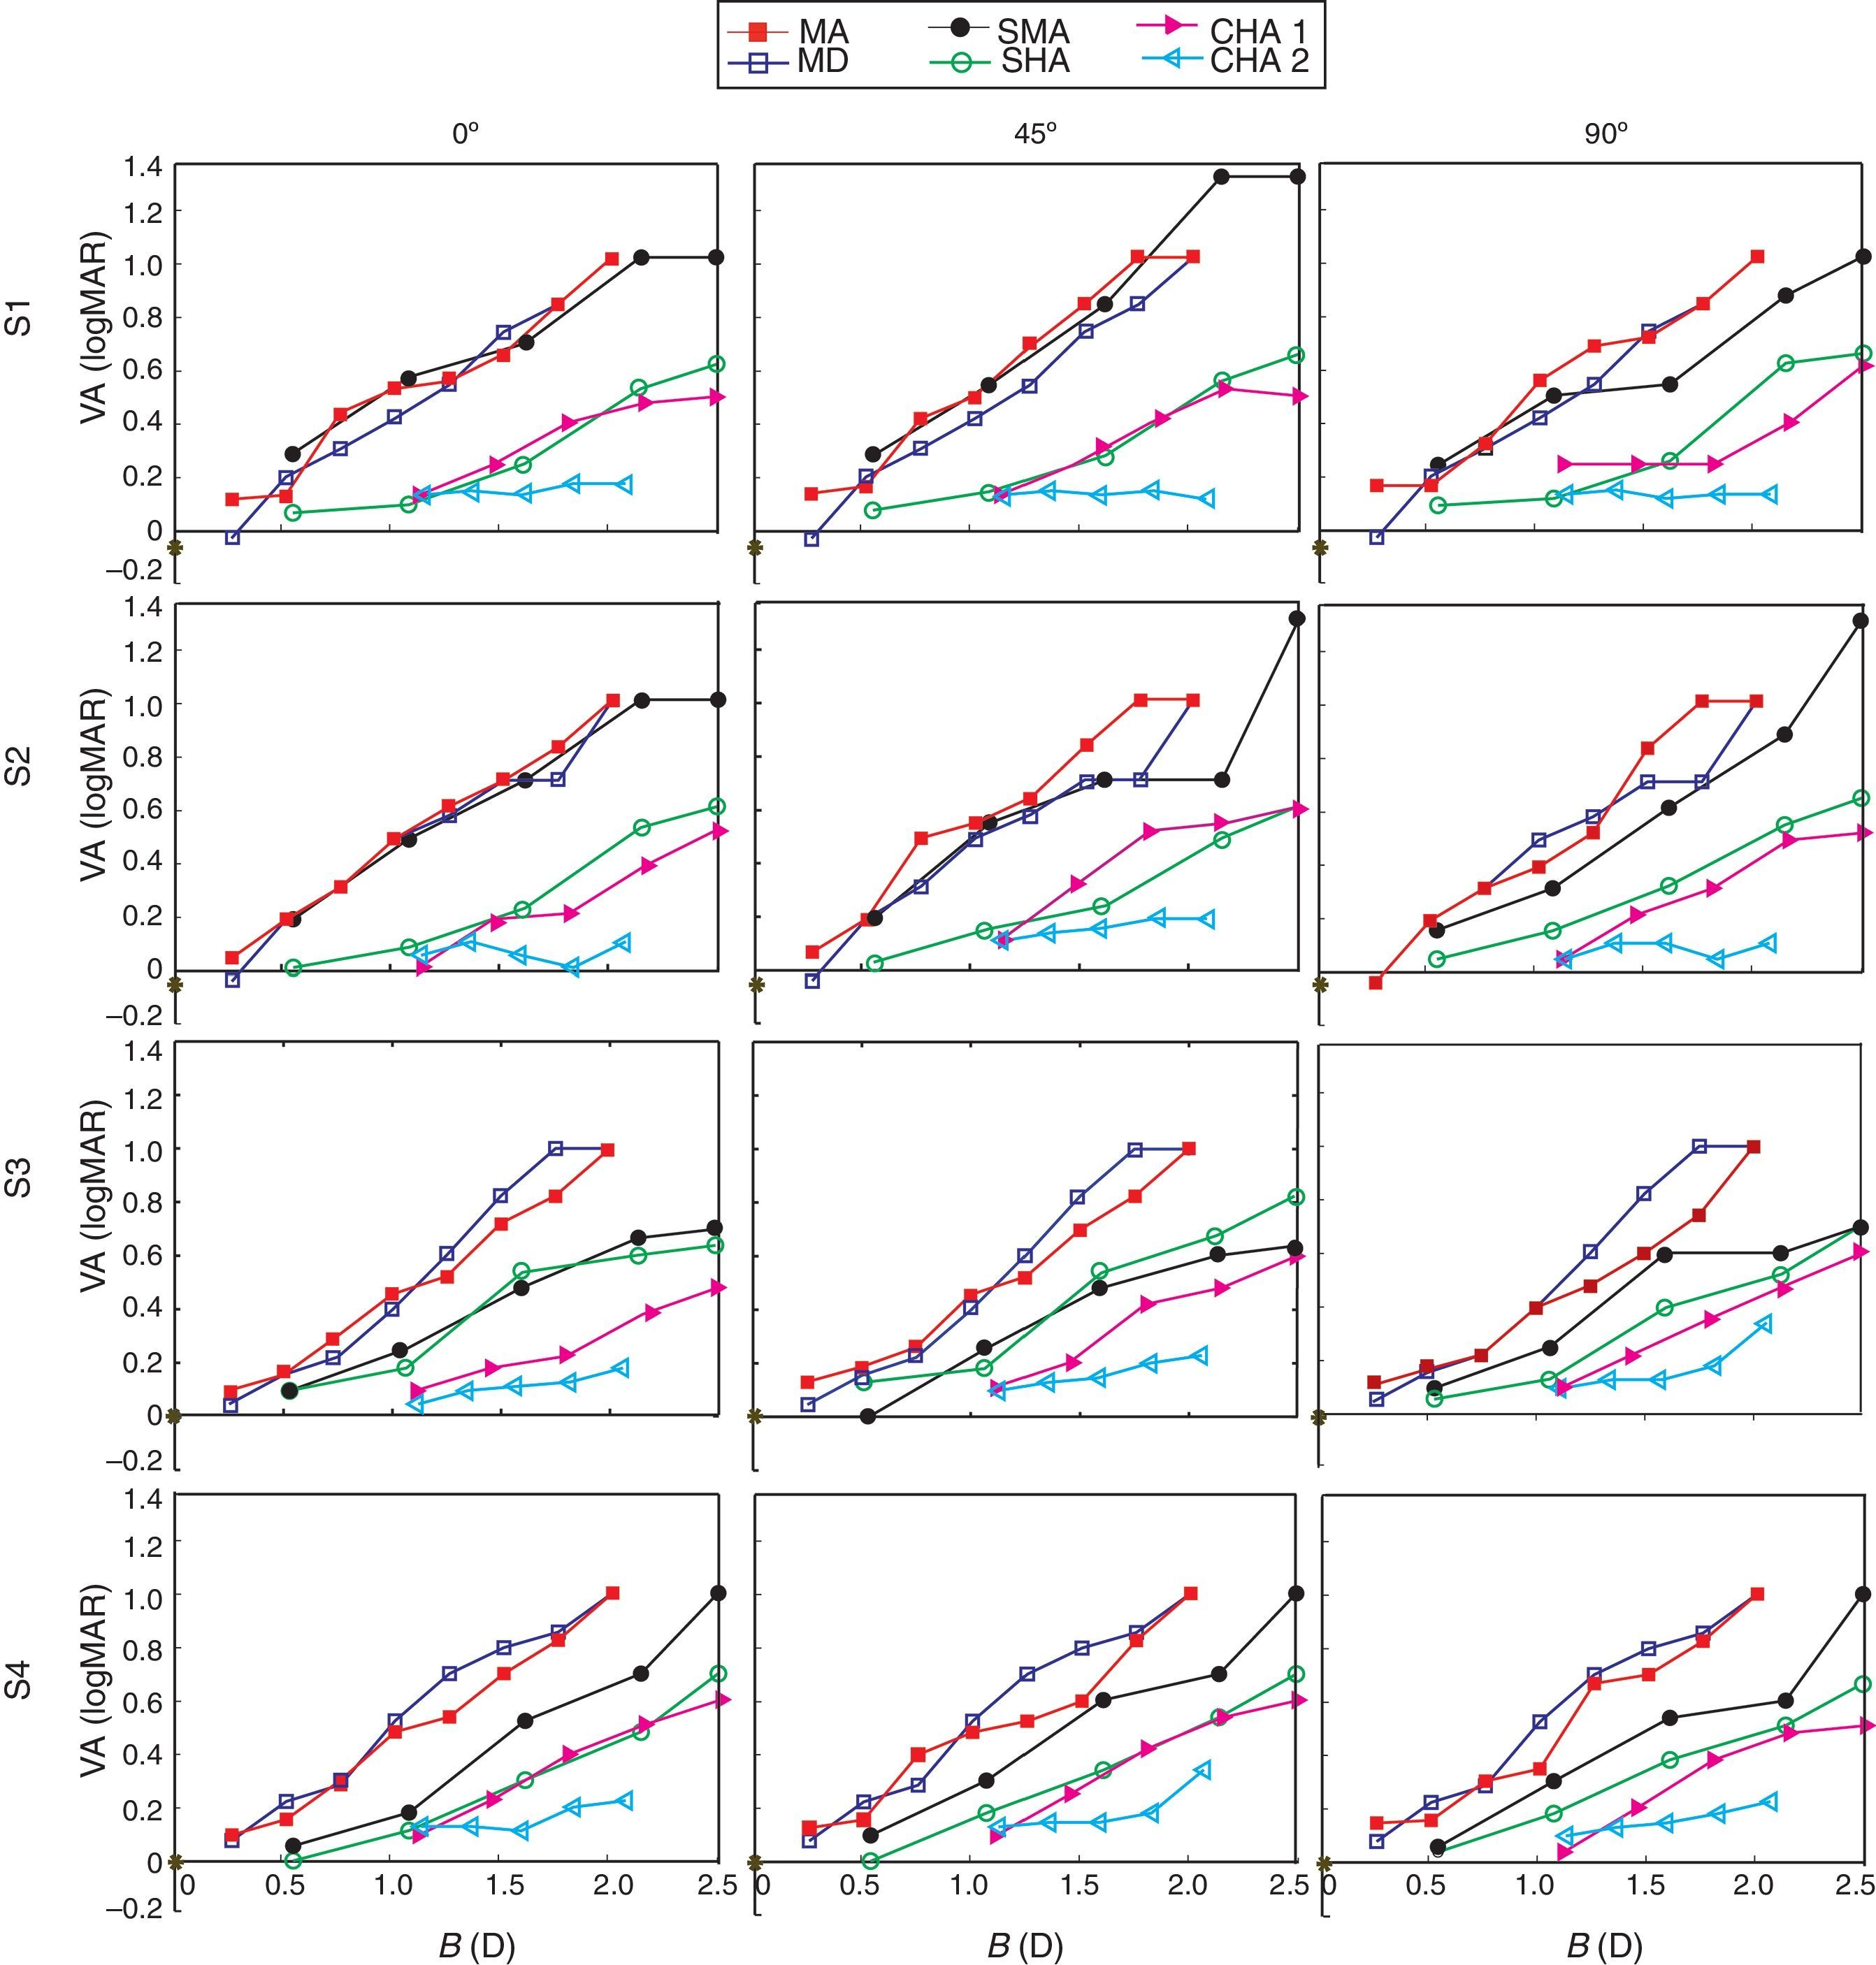
ResultsFig. 1 shows the logMAR VA for achieved by the different subjects with the induced refractions shown in Table 2 at different axes. Values of VA obtained with myopic defocus are also shown in the same figure. As can be seen, the logMAR VA suffers a nearly linear reduction with increasing astigmatic blur, but the slope is different for each type of astigmatism. However, in general, the rate of change is nearly independent of the axis. One-way analysis of variance (ANOVA) showed that there was no significant difference between the VA obtained for 0°, 45°, and 90° axes for all ametropias for each subject (p>0.05 in all cases). Table 3 shows the correlation coefficient, R2, and the slope, b, for each subject. For the slopes; values in parentheses correspond to the axes were b attained the higher and lower values was found. As can be seen, there exists a strong correlation between the astigmatic blur strength B and the logMAR VA, for each type of astigmatism. The influence of the accommodative response is evidenced by the corresponding slope, b. Moreover, similar results were found for the VA achieved with spherical myopic defocus (MD) and MA. In fact non statistically significant difference was obtained between MD and MA (ANOVA F71,7=0.04; p=0.99). Another interesting comparison can be done between the VA achieved with SHA and SMA,30 since in both types of astigmatism one of the focal lines is on the retina. Results in Fig. 1, and in Table 3, show that except for one subject (S3) the VA with SHA was higher than with SMA. Mean values of b were 0.33 and 0.44 for SHA and SMA respectively. However, non conclusive results were obtained in terms of statistical significance, because we found statistically significant differences between subjects S1 for SHA and SMA (ANOVA F35,1=7.68; p=0.009) and S2 (ANOVA F35,1=6.38; p=0.016) but no statistically significant differences was obtained for subjects S3 for SHA and SMA (ANOVA F35,1=0.02; p=0.90) and S4 (F35,1=1.77; p=0.19).

This figure shows the logMAR VA for achieved by the different subjects with the induced refractions shown in Table 2 at different axes.
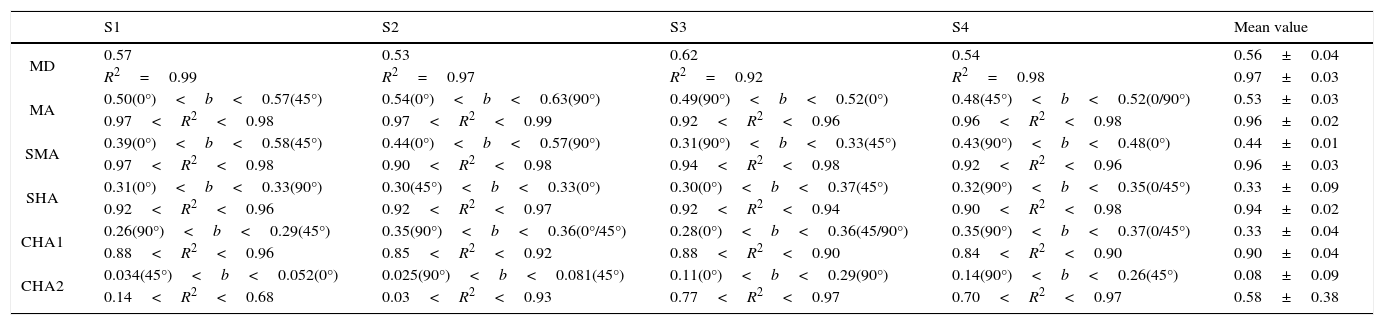
Correlation coefficient (R2) between logMAR VA and blur strength (B) and ratio of change of logMAR VA (b) per unit of B for each subject, for different types of astigmatism and myopic defocus. The axes at which the upper and lower values of b were obtained in each case are shown in parentheses.
| S1 | S2 | S3 | S4 | Mean value | |
|---|---|---|---|---|---|
| MD | 0.57 | 0.53 | 0.62 | 0.54 | 0.56±0.04 |
| R2=0.99 | R2=0.97 | R2=0.92 | R2=0.98 | 0.97±0.03 | |
| MA | 0.50(0°)<b<0.57(45°) | 0.54(0°)<b<0.63(90°) | 0.49(90°)<b<0.52(0°) | 0.48(45°)<b<0.52(0/90°) | 0.53±0.03 |
| 0.97<R2<0.98 | 0.97<R2<0.99 | 0.92<R2<0.96 | 0.96<R2<0.98 | 0.96±0.02 | |
| SMA | 0.39(0°)<b<0.58(45°) | 0.44(0°)<b<0.57(90°) | 0.31(90°)<b<0.33(45°) | 0.43(90°)<b<0.48(0°) | 0.44±0.01 |
| 0.97<R2<0.98 | 0.90<R2<0.98 | 0.94<R2<0.98 | 0.92<R2<0.96 | 0.96±0.03 | |
| SHA | 0.31(0°)<b<0.33(90°) | 0.30(45°)<b<0.33(0°) | 0.30(0°)<b<0.37(45°) | 0.32(90°)<b<0.35(0/45°) | 0.33±0.09 |
| 0.92<R2<0.96 | 0.92<R2<0.97 | 0.92<R2<0.94 | 0.90<R2<0.98 | 0.94±0.02 | |
| CHA1 | 0.26(90°)<b<0.29(45°) | 0.35(90°)<b<0.36(0°/45°) | 0.28(0°)<b<0.36(45/90°) | 0.35(90°)<b<0.37(0/45°) | 0.33±0.04 |
| 0.88<R2<0.96 | 0.85<R2<0.92 | 0.88<R2<0.90 | 0.84<R2<0.90 | 0.90±0.04 | |
| CHA2 | 0.034(45°)<b<0.052(0°) | 0.025(90°)<b<0.081(45°) | 0.11(0°)<b<0.29(90°) | 0.14(90°)<b<0.26(45°) | 0.08±0.09 |
| 0.14<R2<0.68 | 0.03<R2<0.93 | 0.77<R2<0.97 | 0.70<R2<0.97 | 0.58±0.38 |
In the comparison between both types of compound astigmatism we found that for CHA1, the VA decreased with a ratio of change that was higher than CHA2 (see Table 3). Actually, as can be noted in Fig. 1, with induced CHA2 the VA achived is nearly constant for different values of B in almost all cases (note that the low values of the correlation coefficient in this particular case are wheigthned by the null values of the B variance, resulting in an indetermination of the correlation coefficient). It is worth to mention that with this type of astigmatism, the time of stimulus presentation needed for a subject response was larger than the time needed with the other type of induced defocus, and the subjects refer tiredness at the end of each session, which indicates a high accommodative effort during each trial.33
On the other hand, the results for CHA1 were very similar to those obtained for SHA. This result was not unexpected, since the CHA1 turns into SHA, when the eye accommodates 0.5 D.
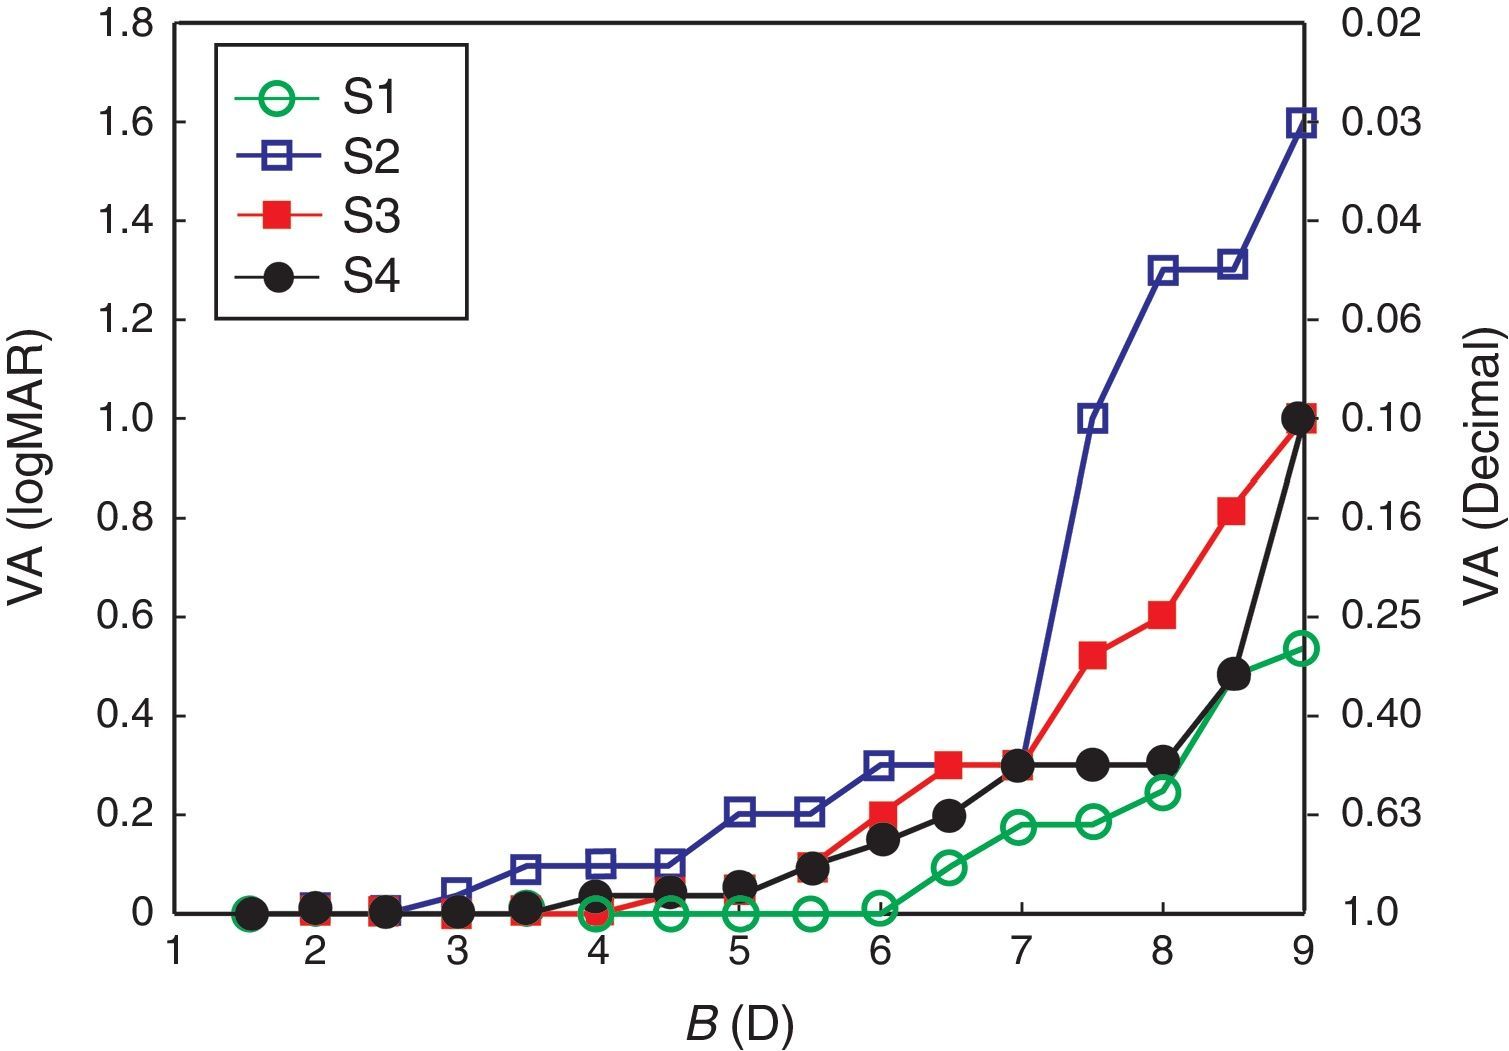
Finally, in order to gain insight about the influence of the accommodation in VA we considered spherical hyperopic defocus. The results are shown in Fig. 2. In this case as the range of B values was expanded to increase the accommodative demand of subjects, we found a significant difference between the results obtained for different subjects (ANOVA F64,3=5.227; p=0.029).
Discussion.")
In this work, we have investigated the effects of different types of astigmatism on the VA attained by eyes with active accommodation. The influence of the axis orientation and the location of the focal lines with respect to the retina have been analyzed.
We found no statistically significant differences between the results obtained for astigmatism with different axes but the same type and magnitude of astigmatism. This result is consistent with previous results for SMA,20–22,30 MA19,21 and SHA.21,22,30. This finding supports the hypothsis that the blur strength B, which is independent of the axis,16 should be a good predictor of VA for astigmatic eyes, as it is for myopia.1,6,15,21 In this sense, a number of studies have not found a strong effect of induced cylinder axis on the changes in VA with astigmatism.19–23,30 However, other studies have reported that ATR induced a greater reduction in VA compared to with WTR astigmatism6,8,24–28 and vice versa.25 Methodological differences in terms of how astigmatism was simulated (with a cross-cylinder, pure positive cylindres, etc.) as well as the way in which VA was measured (the utilized optotype chart,5,6 control of pupil size and accommodation, etc.) may explain these differences in results. In this study, we employed the same chart that in a previous study had less influenced on VA records for different axes of astigmatism.20
Additionally, a number of studies have reported approximately linear variation in logMAR VA with increasing cylinder power but with a different rate of change (slope), depending on the specific methodology adopted, including: the type of acuity chart, age of subjects, presence of active accommodation, correction of higher-order aberrations and the type of astigmatism.5,6,8,19–30 According to the present study, there was a linear reduction in monocular logMAR VA with increasing astigmatic blur in all types of astigmatism considered, but with a different rate of change (see Table 3). Interestingly, we found that under the same experimental conditions, accommodation mainly governs the rate of change of VA with the induced dioptric blur. In fact, it could be hypothesized that the accommodative state of the eye, which can modify the location of the focal lines with respect to the retina, is the responsible of such differences. This result is consistent with those reported by Rosenfield in Ref.34 the sense that accommodative response depends on the grade of the retinal image defocus. Specifically, for CHA2 we obtained a nearly constant VA for different values of B. However, for CHA1 the VA changes with B at nearly the same rate than with SHA. The difference between the response of the visual system to different types of compound astigmatism suggests that the accommodative system chooses a fixed position of focus (locating one focal line at the retina) that maximizes VA. This fact was noted also by Kee et al.35 and they concluded that in the presence of significant amounts of astigmatism, emmetropization is directed toward one of the two focal planes associated with the astigmatic principal meridians and not the circle of least confusion. Moreover, it is likely that the sympthoms of asthenopia experienced by the subjects in our study with induced CHA2 were a consequence of cycles in accommodation across the astigmatic interval that allowed clear successive view of alternate target details and hence better visual performance.29,36 In this sense, we also obtained that the VA achieved with SMA and SHA was better than with MA. From the comparison between the results for SMA and SHA we obtained ambiguous statistically outcomes, for two subjects there were statistically significant differences but for the other two there were not. However, for all subjects, the values of logMAR VA for SMA were in general lower than those for SHA and the mean value of the slope was higher for SMA than for SHA. In this regard, Bradley et al.6 obtained that, in non-cyclopeged subjects, the VA was better when the astigmatic blur was induced with negative cylinders than when it was induced with positive cylinders. Recently, Singh et al.30 found similar results, i.e.; the loss in VA was greater for induced SMA than for SHA, with the rate of change in VA being 0.31 logMAR/D and 0.23 logMAR/D respectively. Besides, they found no statistically significant differences with different axes. In our case, it is likely that the accommodation favor the higher inter subject variability for SHA than for SMA (see Fig. 1 and Table 3). Thus, in this cases the uncertainty in the accommodative behavior prevents drawing categorical conclusions about the influence of astigmatic axis.
Aditionally, we found that spherical positive lenses (myopic defocus) produce losses in VA that are similar than those produced by MA having the same value of B (see Table 3). Similar results were found by Atchison et al.37 and Applegate et al.38 However, for small levels of crossed cylinder blur (≤0.75 DC), it was previously found8 that astigmatism affects visual acuity more than defocus. Thus the difference between our results and the obtained in that study can be attributed to the different range of blur considered in both cases. In fact in that paper, authors explained that the results would be influenced by higher order aberrations. Finally and not unexpectedly, we found that for spherical hyperopic defocus the VA remains constant with increasing blur up to a certain level in which, depending on the subject, the accommodation can not compensates for the induced hyperopia (see Fig. 2).
As mentioned in the introduction, it is known that the influence of astigmatism upon VA depends on several factors. Some of these factors were controled and minimized in this study. One of them is the individual's subjective perception of blur and the level of neural adaptation to astigmatism.14 It has been demonstrated12,13 that, after a brief period of adaptation to astigmatic blur, the VA is improved, and that this effect was dependent upon both the magnitude and axis of the astigmatism. These short term adaptations to astigmatic blur also appear to be influenced by the subject's natural degree of astigmatism.14 As subjects in this work were clinically non-astigmats this effect has been minimized by the randomness of the lens induced astigmatism. Moreover, each measured VA in our experiment was performed immediately after defocus to prevent the trial lenses from inducing neural adaptation.
Notwithstanding, there are some limitations to this study. We did not evaluate several factors that could influence visual performance in astigmatic eyes, such as high order aberrations, pupil size, and level of retinal illuminance. On the one hand, we measured VA with no artificial pupils but under the same photopic conditions, in all trials to minimize inter-subject variability. On the other hand, since the level of high order aberrations with a 4.0mm pupil in young people is low37,38 we believe that they did not significantly influence the outcomes in this study.
In our experiments the individual ocular aberrations could have interacted with the optically generated defocus and could be a cause of the inter-subject variability. Different studies7,8 demonstrated that combining different levels of astigmatism and higher-order aberrations (i.e. coma) can improve the VA in some patients. This effect could partially explain the results found by Ohlendorf et al.21 and Remon et al.22 who compared VA records obtained with computer simulated and lens-induced astigmatism. In both studies the VA obtained with the first method was lower than with second one.
Summarizing VA is correlated with the blur strength in a different way for each type of astigmatism, depending on the accommodative demand. VA is better when one of the focal lines lie on the retina irrespective of the axis orientation; accommodation favors this situation. As a concluding remark, in our opinion, the fact that VA for an ametropic eye can be associated with a single refractive parameter could be very useful, even in studies involving visual performance when the accommodation is active. However, additional research is needed to quantify the influence on VA of the other factors already mentioned.
Conflict of interestThe authors have no conflicts of interest to declare.
This study was supported by the Ministerio de Economía y Competitividad and FEDER (Grant DPI 2015-71256-R), and by the Generalitat Valenciana (Grant PROMETEOII-2014-072), Spain.


