

To investigate changes in higher order ocular aberrations (HOA) induced by the administration of 0.15% sodium hyaluronate tear enhancer (TE) and meibomian gland expression (ME) on the tear film of normal subjects.
MethodsHOA values were obtained from the corneal surface (CS) and whole eye (WE), using a corneal topographer and Shack–Hartmann aberrometer, from both eyes of 50 subjects (25 females, mean age±sd 32.5±11.0 years, and 25 males, 33.88±11.2 years) for two pupil sizes (3 and 6mm) in a dark environment. One drop of Blink Contacts™ (Abbott Medical Optics) was instilled into the right eye and HOA measurements repeated after 30s. After 1h, the meibomian glands of the left lower eyelid were gently squeezed and HOA measurements repeated after 30s.
ResultsThere was no significant difference for CS and WE root mean square (RMS) HOAs between right and left eyes before (both pupil sizes) and after TE use or ME (3mm pupil). For 6mm pupil, TE use significantly reduced the WE RMS HOA (p<0.05, mean±sd) for Z40 (0.297±0.136 to 0.053±0.069), and Z55 (0.221±0.372 to 0.098±0.121) while ME significantly increased CS RMS HOA (p<0.05, mean±sd) for Z3−3 (0.799±1.178 to 1.302±1.991) and Z44 (0.594±1.184 to 0.988±1.463). In general, the change in HOA was significantly correlated with the initial value before TE use or ME (p<0.05).
ConclusionThere were no detectable differences between right and left eyes. For the 6mm pupil, the tear enhancer tended to improve optical performance of the WE and meibomian gland expression tended to reduce the optical performance at the CS.
Estudiar los cambios de las aberraciones oculares de alto orden (HOA) inducidas por la aplicación de las lágrimas artificiales con 0,15% de hialuronato sódico y la expresión de las glándulas de Meibomio (ME) en la película lagrimal en sujetos normales.
MétodosSe obtuvieron los valores de HOA de la superficie corneal (SC) y de la totalidad del ojo, utilizando un topógrafo corneal y un aberrómetro Shack-Hartmann, de ambos ojos de 50 sujetos (25 mujeres, edad media ± DE 32,5 ± 11 años, y 25 varones, 33,88 ± 11,2 años) para dos tamaños de pupila (3 y 6 mm) en un entorno oscuro. Se instiló una gota de Blink Contacts™ (Abbott Medical Optics) en el ojo derecho, repitiéndose las mediciones de HOA transcurridos 30 segundos. Al cabo de 1 hora, se presionaron suavemente las glándulas de Meibomio del párpado inferior del ojo izquierdo y se repitieron las mediciones de HOA al cabo de 30 segundos.
ResultadosNo se produjo diferencia significativa en el error cuadrático médio (RMS) de HOA de la superficie corneal y la totalidad del ojo entre los ojos derecho e izquierdo (ambos tamaños de pupila) antes o después del uso de las lágrimas artificiales o ME (pupila de 3 mm). Para pupilas de 6mm, el uso de lágrimas artificiales redujo significativamente el RMS de HOA de la totalidad del ojo (p< 0,05, media ± DE) para Z04 (de 0,297 ± 0,136 a 0,053 ± 0,069), y Z55 (de 0,221 ± 0,372 a 0,098 ± 0,121) mientras que ME incrementó significativamente el RMS de HOA (p < 0,05, media ± DE) para Z−33 (de 0,799 ± 1,178 a 1,302 ± 1,991) y Z44 (de 0,594 ± 1,184 a 0,988 ± 1,463). En general, el cambio de HOA guardó una correlación significativa con el valor inicial antes del uso de lágrimas artificiales o ME (p < 0,05).
ConclusiónNo se observaron diferencias detectables entre los ojos derecho e izquierdo. Para la pupila de 6 mm, la lágrima artificial tendió a mejorar el rendimiento óptico de la totalidad del ojo, y la expresión de las glándulas de Meibomio tendió a reducir el rendimiento óptico de la superficie corneal.
The quality and dimensions of the overlying tear film before, during, and after a blink influence the overall optical properties of the eye described by the higher order aberrations.1–6 Perturbations in the tear film leading to alterations in the propagation of light are expected to impact on the overall refractive properties of the tear film and, in turn, affect the overall quality of the retinal image. The effect of these perturbations is enhanced by the non-uniform distribution of lipid and aqueous layers, and by the difference in refractive index between them; lipid layer: 1.482, with a range of 1.460–1.5307 at a typical corneal surface temperature, and aqueous layer: 1.337.8,9
Abnormal tear film quality and structure due to dry eye disease leads to a reduced visual performance.10–12 Tear enhancers are intended to provide both relief from symptoms of dry eye and improve the stability of the tear film with a better quality of vision. These effects can also be produced by expressing meibomian oil from the lower eyelid by digital manipulation of the tarsal glands.13,14 Many patients report fluctuating and blurred vision immediately after tear enhancer instillation, or after meibomian oil expression. The visual disturbance can persist for many seconds before the quality of vision settles. Though such remarks are anecdotal, the patients are describing a persistent inconvenient symptom.
Considering the interruption in the optical quality of the eye, it would be useful to ascertain if any particular aberrations are more affected by deliberate shifts in the content and quality of the tear film. Using higher order aberration (HOA) analysis, it is possible to investigate whether specific numerical indices associated with the optical quality of the eye are more sensitive to changes related to the tear film.
The aim of this study was to determine if certain higher order aberrations observed from the corneal surface are related to: irregularities within and over the tear film, and whole eye; the quality of the retinal image quality; and are more susceptible to change shortly after instilling a tear enhancer or meibomian expression in normal subjects.
Methods and materialsSubjectsTo avoid artefacts induced by a baseline of poor tear film stability attributable to dry eye, 50 subjects (mean age±sd: 33.2±11.0 years), 25 females (range 19–60 years) and 25 males (range 18–56 years), with a normal tear film, participated in this investigation. No subject presented with significant distance refraction (best corrected sphere and/or cylinder less than ±0.50D). All subjects had visual acuity of 20/20 or better. None of the subjects presented with dry eye symptoms (Ocular Surface Disease Index (OSDI) score≤10), or low tear film stability (NIBUT>12s), or any clear signs of dry eye or ocular surface disease. All subjects had patent meibomian glands, normal clear corneas, free of any irregularities, with no history of general or ocular conditions known to affect either the tear film or cornea. All measurements were taken in a controlled, draft-free environment, with a mean±sd temperature 22±2°C and a mean±sd relative humidity 50±3%. This study was approved by the institutional review board of University of Salento and the tenets of the Helsinki Declaration were followed throughout this investigation. Informed consent was obtained from all subjects after the full nature and possible consequences of the study were fully explained.
Estimating the optical properties and total optical performanceThe corneal surface aberrations were measured using a corneal topographer based on a Placido disk (CA-100 Fluo, Topcon, Capelle, The Netherlands), and whole eye aberrations were measured using an aberrometer based on Shack-Hartmann principles (COAS™, WaveFront Sciences Inc, Albuquerque, USA). The Shack–Hartmann aberrometer is a single-pass, wavefront device, and this type of aberrometer has been proven to be useful in this type of study.11,15,16 In simple description, a very narrow (<1mm) laser beam is passed into the eye forming a spot at the retina. This spot is not affected by the HOAs of the eye. The light emerging from the spot passes back through the eye towards an array of identical lenslets and sensors to form a multiple series of images of the diffuse spot at the retina. The shape, size, position and intensity of each single image are associated with the local characteristics of the wavefront passing out of the eye. The characteristics of each spot are analysed and details from all of the spots are integrated, resulting in a computed reproduction of the wavefront aberration.
The wavefront aberration is depicted by a series of Zernike polynomials which best fit the captured data using a ‘least squares’ method. The corneal surface HOA are analysed in a similar way by sampling only the reflections from the corneal surface. Full descriptions of the Zernike polynomials and the applications in relation to ocular wavefront aberrations are noted elsewhere.17,18 In brief, the Zernike polynomials describing coma and trefoil are Z3−3, Z3−1, Z31, Z33, spherical aberration secondary astigmatism and tetrafoil are Z4−4, Z4−2, Z40, Z42, Z44, and the 5th order pentafoil aberrations are Z5−5, Z5−3, Z5−1, Z51, Z53, Z55. Oshika19 advocated that a particular aberration (e.g. coma) can be quantified by the sum of the individual values of each Zernike polynomial. This leads to some positive and negative values cancelling each other out, resulting in a spurious misrepresentation of the true inherent optical defect. Consequently, the sum total of the RMS values of the Zernike polynomials is a more realistic and meaningful depiction of the true wavefront aberration.
Since it would be useful to determine if a particular Zernike polynomial is more susceptible to changes in response to provocative changes in the tear film, the values of the Zernike polynomials describing each HOA (that is, each of the 3rd, 4th and 5th order aberrations) were considered.
A further matter to note is that instruments designed to evaluate the total aberrations of the eye measure along the line of sight, while corneal topographers, such as that used here, are usually designed to centre about the pupil or optical axis of the cornea. Thus, the two instruments are not measuring the same identical parameters, and, consequently, the results obtained from the two instruments will be different and cannot be compared directly with each other. However, to isolate each set of aberrations, the two instruments must be used as neither can perform both measurements.
Experimental procedureAt all times, the corneal topographer was used before the aberrometer, and the average of three measurements from each instrument was recorded. The time interval between the two instruments was about 15s and the subject was allowed to blink normally during the short change over period.
The corneal surface and total aberrations of the whole eye were measured for the right eye and then the left, following a rest period of 60min. The proprietary software built into each instrument produce aberration data for 3.0mm and 6.0mm pupil sizes. Measurements were taken in a dark room to dilate the pupil and to avoid the need for further contamination of the tear film by use of a topical mydriatic or cycloplegic. The subject was asked to blink 4 or 5 times, stare at the distant target of the aberrometer, and the images using the aberrometer were captured 5s after the last blink. The captured images were analysed using the built-in software of the instrument yielding data describing each of the 3rd, 4th and 5th order aberrations from the corneal surface and whole eye, for the two pupil sizes.
One drop of 0.15% sodium hyaluronate tear enhancer (Blink Contacts™, Abbott Medical Optics Inc., Santa Ana, CA, USA) was introduced into the lower fornix of the right eye by asking the subject to look up and gently pulling down the lower lid away from the lid margin to avoid inadvertent expression of meibomian oil. The corneal surface and total ocular aberrations were measured at the right eye 30s later. After a rest period of 60min, the lower lid of the left eye was gently pinched, midway between the canthi, always by the same investigator, using the thumb and forefinger to express some visible oil from the local meibomian glands. The corneal surface and total ocular aberrations were measured at the left eye 30s later.
Statistical analysisData were stored on a spread-sheet and analysed to determine if:
- (i)
the results for each of the 3rd, 4th and 5th order HOA were normally distributed (Shapiro–Wilks normality test);
- (ii)
there was a significant difference between right and left eyes, before either instillation of tear enhancer or expression of meibomian oil, apropos the corneal surface and total whole eye HOA (Mann Whitney or t-test);
- (iii)
a significant correlation occurred between each of the corneal surface and total whole eye HOA before and after instillation of a tear enhancer, and before and after expression of meibomian oil (Pearson correlation coefficient, r);
- (iv)
a significant change in the corneal surface and total whole eye HOA occurred after instillation of the tear enhancer or expression of meibomian oil (Wilcoxon signed rank or t-test);
- (v)
a significant correlation occurred between the change (Δ) in each corneal surface and total whole eye HOA, and the pre-treatment value, after instillation of the tear enhancer or expression of meibomian oil (Pearson correlation coefficient, r).
The significance level was set at a p-value of <0.05. The analyses were performed for all the results obtained using the instruments over the two pupil sizes: 3mm and 6mm.
ResultsAssessment for data normality found that most of the corneal surface and whole eye HOAs were not distributed normally, and therefore non-parametric tests where applied to the data. The main significant results are listed in Tables 1–5 and Figs. 1–4.
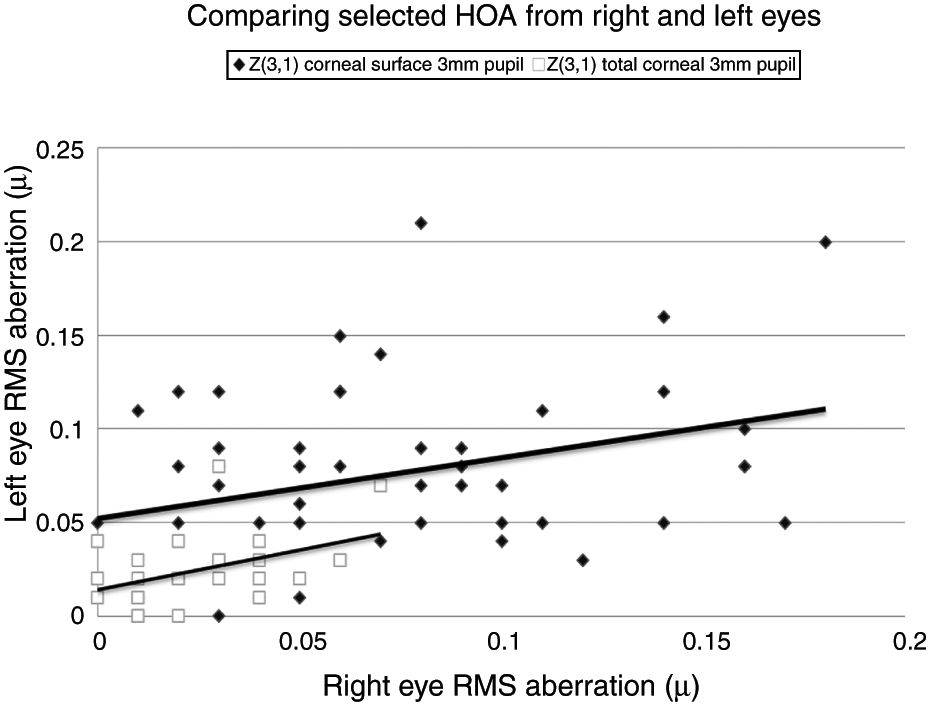
. The equations for the least squares regression lines are: corneal surface 3mm pupil (upper line), y=0.342x+0.052 (r=0.334, n=50, p=<0.05) and total ocular 3mm pupil (lower line), y=0.309x+0.020 (r=0.335, n=50, p=<0.05).")
Selected data comparing RMS HOA data from right and left eyes. The two sets of data with the highest correlations are shown. All values are in microns (μ). The equations for the least squares regression lines are: corneal surface 3mm pupil (upper line), y=0.342x+0.052 (r=0.334, n=50, p=<0.05) and total ocular 3mm pupil (lower line), y=0.309x+0.020 (r=0.335, n=50, p=<0.05).
There was no significant difference (p>0.05) in the total corneal surface and total whole eye HOAs for both pupil sizes between both eyes (Table 1).
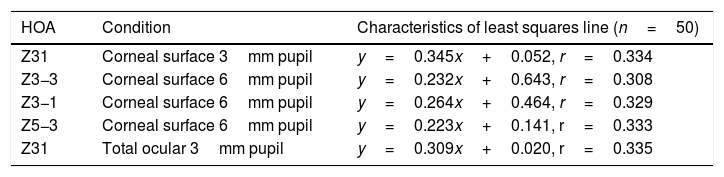
The characteristics of the 5 significant correlations (p<0.05) between RMS HOA data obtained from right (x) and left (y) eyes before changes in the tear film.
| HOA | Condition | Characteristics of least squares line (n=50) |
|---|---|---|
| Z31 | Corneal surface 3mm pupil | y=0.345x+0.052, r=0.334 |
| Z3−3 | Corneal surface 6mm pupil | y=0.232x+0.643, r=0.308 |
| Z3−1 | Corneal surface 6mm pupil | y=0.264x+0.464, r=0.329 |
| Z5−3 | Corneal surface 6mm pupil | y=0.223x+0.141, r=0.333 |
| Z31 | Total ocular 3mm pupil | y=0.309x+0.020, r=0.335 |
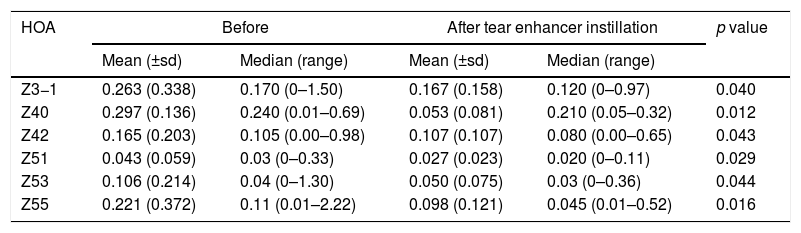
There was no significant change (p>0.05) in each of the corneal surface HOAs, for both pupil sizes, and for the total whole eye HOAs for the 3mm pupil. For the 6mm pupil there was a significant fall (p<0.05) in the value of corneal surface Z3−1, Z40, Z42, Z51, Z53 and Z55 total whole eye HOAs (Table 2). The remaining HOAs did not change significantly.
Reporting the indices that changed significantly (p<0.05) following instillation of the tear enhancer. These were revealed for the whole eye 6mm pupil data only.
| HOA | Before | After tear enhancer instillation | p value | ||
|---|---|---|---|---|---|
| Mean (±sd) | Median (range) | Mean (±sd) | Median (range) | ||
| Z3−1 | 0.263 (0.338) | 0.170 (0–1.50) | 0.167 (0.158) | 0.120 (0–0.97) | 0.040 |
| Z40 | 0.297 (0.136) | 0.240 (0.01–0.69) | 0.053 (0.081) | 0.210 (0.05–0.32) | 0.012 |
| Z42 | 0.165 (0.203) | 0.105 (0.00–0.98) | 0.107 (0.107) | 0.080 (0.00–0.65) | 0.043 |
| Z51 | 0.043 (0.059) | 0.03 (0–0.33) | 0.027 (0.023) | 0.020 (0–0.11) | 0.029 |
| Z53 | 0.106 (0.214) | 0.04 (0–1.30) | 0.050 (0.075) | 0.03 (0–0.36) | 0.044 |
| Z55 | 0.221 (0.372) | 0.11 (0.01–2.22) | 0.098 (0.121) | 0.045 (0.01–0.52) | 0.016 |
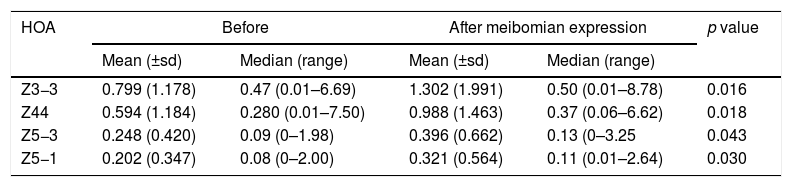
There was no significant change (p>0.05) in each corneal surface and total whole eye HOA for the 3mm pupil. There was a significant rise (p<0.05) in the value of corneal surface Z3−3, Z44, Z5−3, Z5−1 HOA for the 6mm pupil only (Table 3).
Reporting the indices that changed significantly (p<0.05) following meibomian expression. These were revealed for the corneal surface 6mm pupil data only.
| HOA | Before | After meibomian expression | p value | ||
|---|---|---|---|---|---|
| Mean (±sd) | Median (range) | Mean (±sd) | Median (range) | ||
| Z3−3 | 0.799 (1.178) | 0.47 (0.01–6.69) | 1.302 (1.991) | 0.50 (0.01–8.78) | 0.016 |
| Z44 | 0.594 (1.184) | 0.280 (0.01–7.50) | 0.988 (1.463) | 0.37 (0.06–6.62) | 0.018 |
| Z5−3 | 0.248 (0.420) | 0.09 (0–1.98) | 0.396 (0.662) | 0.13 (0–3.25 | 0.043 |
| Z5−1 | 0.202 (0.347) | 0.08 (0–2.00) | 0.321 (0.564) | 0.11 (0.01–2.64) | 0.030 |
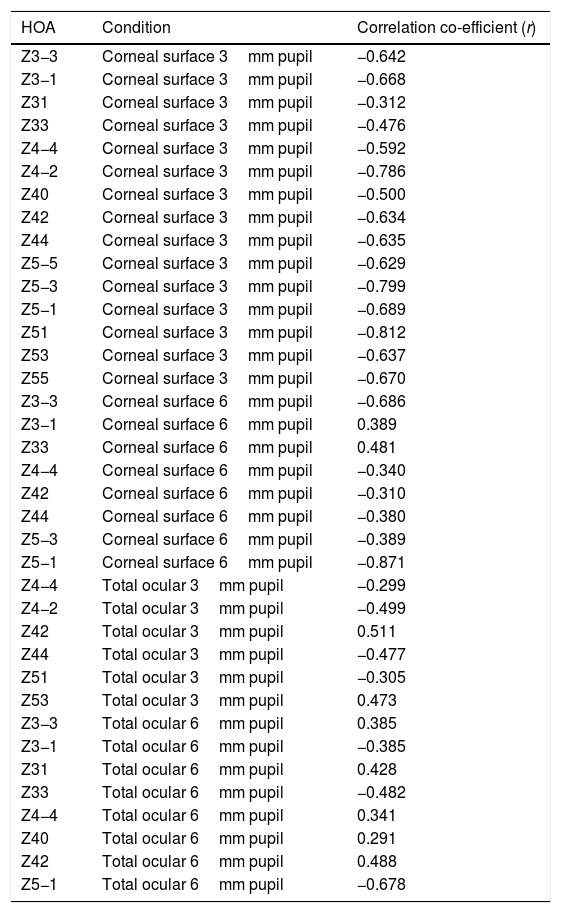
For the corneal surface HOAs, there was a significant correlation (p<0.05) between the individual change (Δ) in the value of each HOA and the initial value of the HOA before instillation, in all 15 HOA for the 3mm pupil (Table 4). There was a significant correlation between Δ and the initial value of each HOA before instillation in the following eight of the 15 HOAs: Z3−3, Z3−1, Z33, Z44, Z42, Z44, Z5−3, Z5−1 for the 6mm pupil.
Reporting the significant (p<0.05) correlation coefficient values (r) for linear regression applied to pairs of data consisting of pre-application of tear enhancer RMS value of a HOA (x) and the change (Δ) in the RMS HOA value (y). Δ=post-application RMS HOA minus pre-application RMS HOA.
| HOA | Condition | Correlation co-efficient (r) |
|---|---|---|
| Z3−3 | Corneal surface 3mm pupil | −0.642 |
| Z3−1 | Corneal surface 3mm pupil | −0.668 |
| Z31 | Corneal surface 3mm pupil | −0.312 |
| Z33 | Corneal surface 3mm pupil | −0.476 |
| Z4−4 | Corneal surface 3mm pupil | −0.592 |
| Z4−2 | Corneal surface 3mm pupil | −0.786 |
| Z40 | Corneal surface 3mm pupil | −0.500 |
| Z42 | Corneal surface 3mm pupil | −0.634 |
| Z44 | Corneal surface 3mm pupil | −0.635 |
| Z5−5 | Corneal surface 3mm pupil | −0.629 |
| Z5−3 | Corneal surface 3mm pupil | −0.799 |
| Z5−1 | Corneal surface 3mm pupil | −0.689 |
| Z51 | Corneal surface 3mm pupil | −0.812 |
| Z53 | Corneal surface 3mm pupil | −0.637 |
| Z55 | Corneal surface 3mm pupil | −0.670 |
| Z3−3 | Corneal surface 6mm pupil | −0.686 |
| Z3−1 | Corneal surface 6mm pupil | 0.389 |
| Z33 | Corneal surface 6mm pupil | 0.481 |
| Z4−4 | Corneal surface 6mm pupil | −0.340 |
| Z42 | Corneal surface 6mm pupil | −0.310 |
| Z44 | Corneal surface 6mm pupil | −0.380 |
| Z5−3 | Corneal surface 6mm pupil | −0.389 |
| Z5−1 | Corneal surface 6mm pupil | −0.871 |
| Z4−4 | Total ocular 3mm pupil | −0.299 |
| Z4−2 | Total ocular 3mm pupil | −0.499 |
| Z42 | Total ocular 3mm pupil | 0.511 |
| Z44 | Total ocular 3mm pupil | −0.477 |
| Z51 | Total ocular 3mm pupil | −0.305 |
| Z53 | Total ocular 3mm pupil | 0.473 |
| Z3−3 | Total ocular 6mm pupil | 0.385 |
| Z3−1 | Total ocular 6mm pupil | −0.385 |
| Z31 | Total ocular 6mm pupil | 0.428 |
| Z33 | Total ocular 6mm pupil | −0.482 |
| Z4−4 | Total ocular 6mm pupil | 0.341 |
| Z40 | Total ocular 6mm pupil | 0.291 |
| Z42 | Total ocular 6mm pupil | 0.488 |
| Z5−1 | Total ocular 6mm pupil | −0.678 |
For the total whole eye aberrations and 3mm pupil, there was a significant correlation between Δ and the initial value of the HOA before instillation for six of the 15 HOA: Z4−4, Z4−2, Z42, Z44, Z51, Z53. For the 6mm pupil, there was a significant correlation between Δ and the initial value of the HOA before instillation for eight of the 15 HOAs: Z3−3, Z3−1, Z31, Z33, Z4−4, Z40, Z42, Z5−1.
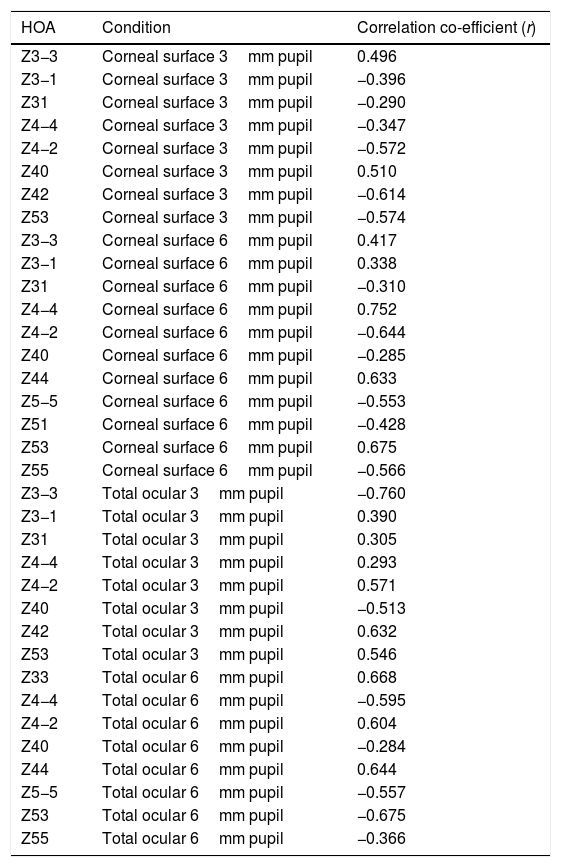
Individual changes in each RMS HOA after meibomian gland expressionFor the corneal surface HOAs, there was a significant correlation between the individual change (Δ) and the initial value of each HOA before meibomian gland expression for eight of the 15 HOAs: Z3−3, Z3−1, Z31, Z4−4, Z4−2, Z40, Z42, Z53, for the 3mm pupil. There was a significant correlation between Δ and the initial value of each HOA before meibomian gland expression for eleven of the 15 HOAs: Z3−3, Z3−1, Z31, Z4−4, Z4−2, Z40, Z44, Z5−5, Z51, Z53, Z55, for the 6mm pupil (Table 5).
Reporting the significant (p<0.05) correlation coefficient values (r) for linear regression applied to pairs of data consisting of pre-meibomian expression RMS value of a HOA (x) and the change (Δ) in the RMS HOA value (y). Δ=post-expression RMS HOA minus pre-expression RMS HOA.
| HOA | Condition | Correlation co-efficient (r) |
|---|---|---|
| Z3−3 | Corneal surface 3mm pupil | 0.496 |
| Z3−1 | Corneal surface 3mm pupil | −0.396 |
| Z31 | Corneal surface 3mm pupil | −0.290 |
| Z4−4 | Corneal surface 3mm pupil | −0.347 |
| Z4−2 | Corneal surface 3mm pupil | −0.572 |
| Z40 | Corneal surface 3mm pupil | 0.510 |
| Z42 | Corneal surface 3mm pupil | −0.614 |
| Z53 | Corneal surface 3mm pupil | −0.574 |
| Z3−3 | Corneal surface 6mm pupil | 0.417 |
| Z3−1 | Corneal surface 6mm pupil | 0.338 |
| Z31 | Corneal surface 6mm pupil | −0.310 |
| Z4−4 | Corneal surface 6mm pupil | 0.752 |
| Z4−2 | Corneal surface 6mm pupil | −0.644 |
| Z40 | Corneal surface 6mm pupil | −0.285 |
| Z44 | Corneal surface 6mm pupil | 0.633 |
| Z5−5 | Corneal surface 6mm pupil | −0.553 |
| Z51 | Corneal surface 6mm pupil | −0.428 |
| Z53 | Corneal surface 6mm pupil | 0.675 |
| Z55 | Corneal surface 6mm pupil | −0.566 |
| Z3−3 | Total ocular 3mm pupil | −0.760 |
| Z3−1 | Total ocular 3mm pupil | 0.390 |
| Z31 | Total ocular 3mm pupil | 0.305 |
| Z4−4 | Total ocular 3mm pupil | 0.293 |
| Z4−2 | Total ocular 3mm pupil | 0.571 |
| Z40 | Total ocular 3mm pupil | −0.513 |
| Z42 | Total ocular 3mm pupil | 0.632 |
| Z53 | Total ocular 3mm pupil | 0.546 |
| Z33 | Total ocular 6mm pupil | 0.668 |
| Z4−4 | Total ocular 6mm pupil | −0.595 |
| Z4−2 | Total ocular 6mm pupil | 0.604 |
| Z40 | Total ocular 6mm pupil | −0.284 |
| Z44 | Total ocular 6mm pupil | 0.644 |
| Z5−5 | Total ocular 6mm pupil | −0.557 |
| Z53 | Total ocular 6mm pupil | −0.675 |
| Z55 | Total ocular 6mm pupil | −0.366 |
For the total whole eye aberrations, there was a significant correlation between Δ and the initial value of each HOA before meibomian gland expression in eight of the 15 HOAs: Z3−3, Z3−1, Z31, Z4−4, Z4−2, Z40, Z42, Z53, for the 3mm pupil. There was a significant correlation between Δ and the initial value of each HOA before meibomian gland expression for eight of the 15 HOAs: Z33, Z4−4, Z4−2, Z40, Z44, Z5−5, Z53, Z55, for the 6mm pupil (Table 5).
DiscussionAlthough tear enhancers and meibomian expression are used in the treatment of dry eye disorders, the aim of this study was to identify the coefficients of higher order aberrations (HOAs) of the corneal surface and the whole eye that were most susceptible to change from the addition of these substances to the tear film of normal subjects.
While tear enhancer use in normal eyes has been previously investigated,20–24 there are only anecdotal comment reports relating to the effect of meibomian gland expression on the alteration of vision quality. The higher order aberrations, observed from both the corneal surface and whole eye, are useful in understanding the subjective effects of these treatment methods on vision by assessing the objective effects on optical quality.
The study found that instillation of a tear enhancer or the expression of meibomian oil had no effect on the mean and median value of each HOA for the smaller 3mm pupil. For the larger 6mm pupil, the tear enhancer reduced the magnitude of the total ocular aberrations (Z3−1, Z42, Z40, Z51, Z53 and Z55), indicating an overall improvement in optical performance across the subjects over the duration of the investigation. However, for the 6mm pupil, meibomian gland expression produced a significant increase in mean HOA values for the corneal surface aberrations (Z3−3, Z44, Z5−3, Z5−1), indicating that meibomian gland expression changes the regular distribution of tear film. In summary, manipulating the content of the tear film had a detectable impact on the short term optical performance at the larger 6mm pupil, but not for the smaller 3mm pupil.
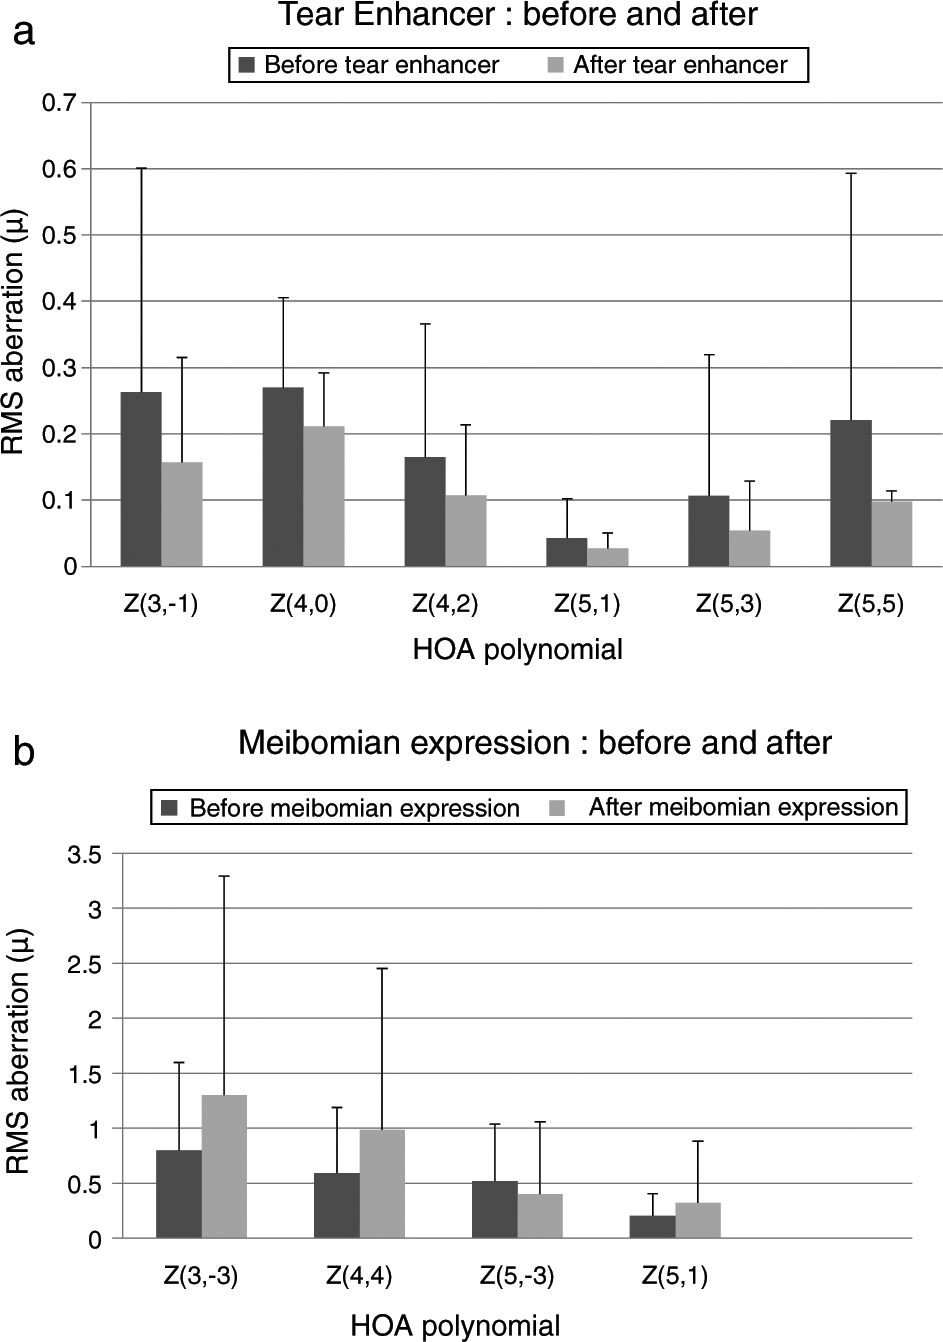
These effects are evident in Fig. 2 and Tables 2 and 3, which show that the HOAs significantly changed after introduction of the tear enhancer and meibomian gland expression. It appears that, for the total whole eye, HOAs reduced after instillation of the tear enhancer, and, for the corneal surface, HOAs increased after meibomian gland expression.
 Bar chart showing the RMS HOA where significant changes were detected after instillation of the tear enhancer. The appropriate standard deviations are shown as ‘T’ lines. All values are in microns (μ). Significant changes were uncovered for total ocular aberrations for the 6mm pupil only. There were no significant changes in any of the corneal surface aberrations. (b) Bar chart showing the RMS HOA where significant changes were detected following meibomian expression. The appropriate standard deviations are shown as ‘T’ lines. All values are in microns (μ). Significant changes were uncovered for the corneal surface aberrations Z3−3, Z44, Z5−3, Z5−1 and total ocular Z5−5 HOA for the 6mm pupil only. There were no significant changes in any of the total ocular aberrations.")
(a) Bar chart showing the RMS HOA where significant changes were detected after instillation of the tear enhancer. The appropriate standard deviations are shown as ‘T’ lines. All values are in microns (μ). Significant changes were uncovered for total ocular aberrations for the 6mm pupil only. There were no significant changes in any of the corneal surface aberrations. (b) Bar chart showing the RMS HOA where significant changes were detected following meibomian expression. The appropriate standard deviations are shown as ‘T’ lines. All values are in microns (μ). Significant changes were uncovered for the corneal surface aberrations Z3−3, Z44, Z5−3, Z5−1 and total ocular Z5−5 HOA for the 6mm pupil only. There were no significant changes in any of the total ocular aberrations.
From a clinical treatment perspective, tear enhancers are expected to raise the stability of the pre-corneal tear film, thereby reducing the rate of tear evaporation, without a negative impact on tear film optics. The fall in magnitude of the six specific HOAs after instillation of the tear enhancer observed in this study shows that this treatment method fulfils the third requirement. However, the expression of meibomian oil only fulfils the first two requirements,13,14 but not the third. This suggests that the expressed meibomian oil does not interact with the pre-corneal tear film in the 30s after the forced expression in a manner that promotes good optical performance. Local perturbations in the tear film caused by inadequate distribution of the expressed meibomian oils are the likely cause of an increase in mean values of particular corneal surface HOAs.
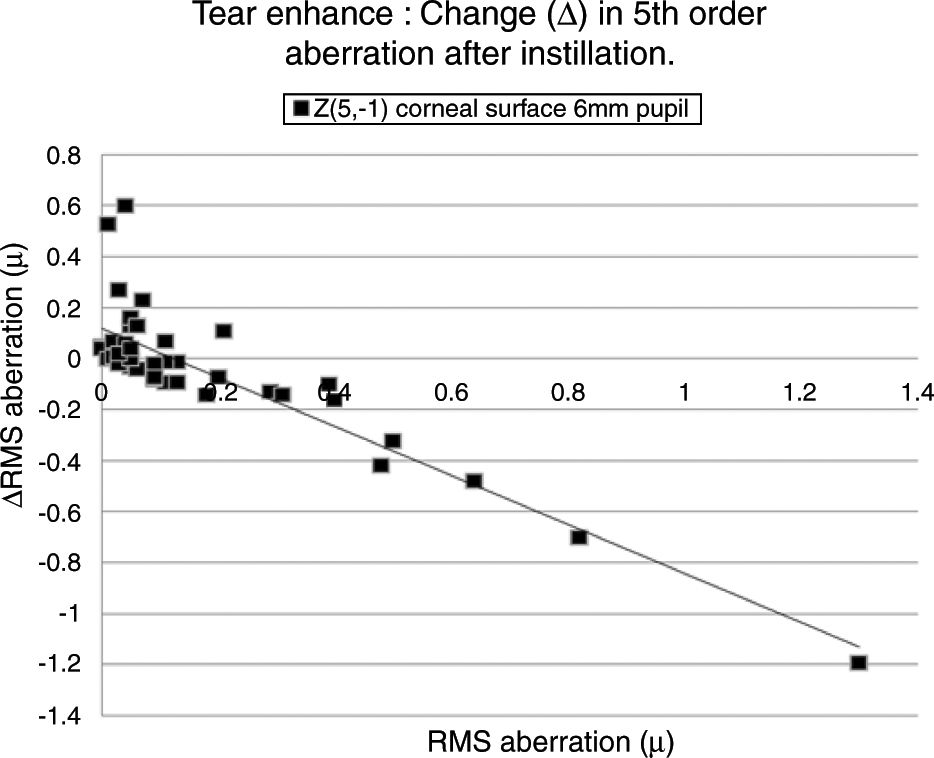
Table 4 lists the HOAs where the change in the value of the HOA was significantly associated with the initial RMS value for the HOA before instillation of the tear enhancer. Fig. 3 shows the data for the HOA with the highest correlation coefficient (Z5−1, corneal surface, 6mm pupil). The nature of the least squares line in Fig. 3 suggests that instillation of the tear enhancer will either reduce the HOA when the initial RMS value is high, or increase when the initial RMS value is low. Other HOA coefficients noted in Table 4 have similar effects to Z5−1, such as Z4−2 and Z5−3 (corneal surface, 3mm pupil). This implies that in some cases where the optical performance is relatively poor, the instillation of the tear enhancer is likely to improve overall optical performance. Conversely, in those cases where the optical performance is relatively good, the instillation of the tear enhancer is likely to reduce overall optical performance. Similar tendencies were found for other HOA correlations, such as Z51 (corneal surface, 3mm pupil) and Z5−1 (corneal surface, 6mm pupil). This has a practical application when measuring corneal topography in cases where the corneal surface HOAs are too high. In these cases, the tear enhancing drop is expected to improve the overall quality of the air-tear interface by reducing the HOAs, thus resulting in a more useful surface topographical analysis. This supports anecdotal reports of better quality corneal topography maps obtained in dry eyes or on irregular corneas after instilling tear enhancing drops.
 with initial RMS value before instillation of the tear enhancer. The equation for the least squares regression lines is, y=0.107−0.942x (r=−0.871, n=50, p=<0.01. Excluding outlier, r=−0.774).")
The HOA, Z5−1, where the highest correlation was found when comparing the change in the RMS value (Δ) with initial RMS value before instillation of the tear enhancer. The equation for the least squares regression lines is, y=0.107−0.942x (r=−0.871, n=50, p=<0.01. Excluding outlier, r=−0.774).
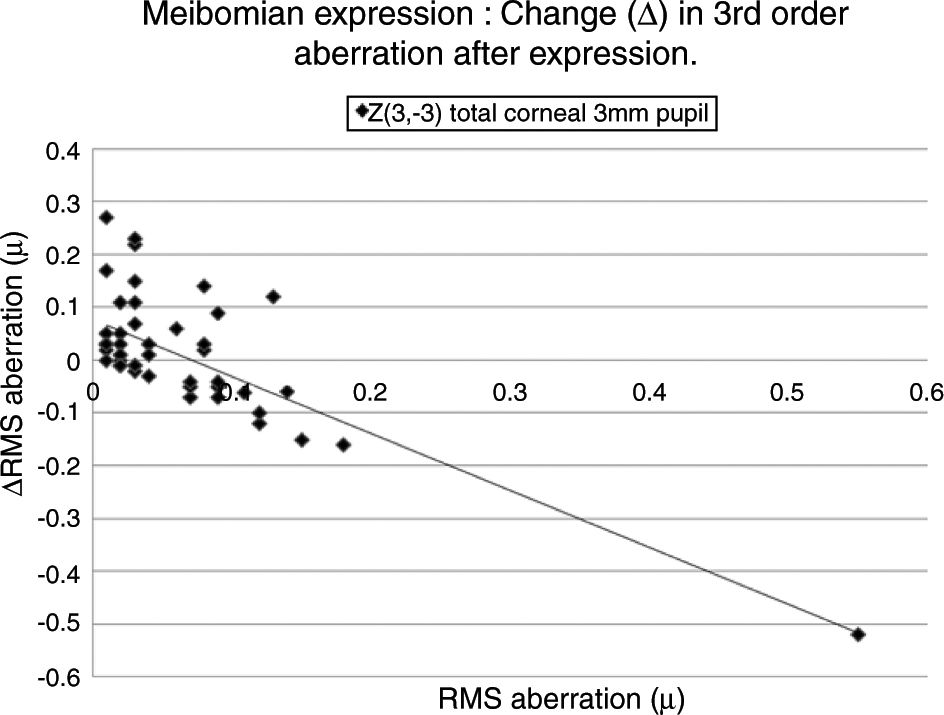
Table 5 lists the HOAs where the change in the value of the HOA was significantly associated with the initial RMS value for the HOA before meibomian gland expression. Fig. 4 shows the data for the HOA with the highest correlation coefficient, namely Z3−3 (total ocular aberration, 3mm pupil). A negative correlation was encountered in 19 of the 35 cases, where changes in the RMS value of specific HOAs were significantly associated with the RMS value before expression. In those cases where the initial value of the HOA was high, meibomian gland expression tended to reduce the HOA value, implying an improvement in optical performance. Conversely, in those cases where the initial value of the HOA was low, meibomian gland expression tended to increase the HOA value, implying a reduction in optical performance. In summary, poor optical performers tended to gain, good optical performers tended to lose out in the short term after meibomian gland expression.
 with initial RMS value before meibomian expression. The equation for the least squares regression lines is, y=0.077−1.080x (r=−0.760, n=50, p=<0.01. Excluding outlier, r=−0.523).")
No single coefficient stood out as the leading marker of change in the optical quality of the tear film after intervention. The RMS values of Z55 and Z40 indices describing the total ocular aberrations for a 6mm pupil are more susceptible to significant change when an improvement in optical performance after tear film intervention is envisaged. The Z3−3 and Z44 indices describing the corneal surface aberrations for a 6mm pupil are more susceptible to change when depreciation in optical performance after tear film intervention is anticipated.
Previous research has shown that the optical properties of right and left eyes are similar when these properties are quantified by the higher order aberrations.25,26 This is because the optical characteristics exhibited by the two eyes have a tendency towards symmetry.26 However, the inter-ocular differences in corneal surface curvature and refractive error suggest that there may yet be inter-ocular differences in the HOAs associated with the corneal surface and, possibly, the whole eye. A side-benefit of this study was the opportunity to further investigate these possible differences.
Our study found no measurable significant difference between the right and left eyes, implying that the optical profiles obtained from right and left eyes are the same in terms of basic statistics and drawn from the same population. This lack of any discernible inter-ocular difference supports previous findings.25,26 Using a binocular Shack-Hartmann aberrometer, Hampson and Mallen27 found inter-ocular correlations for coma, but for no other HOA. Our study also uncovered a similar trend in total ocular coma (Z31) for the 3mm pupil size, but not for the 6mm. In addition, we also encountered significant inter-ocular correlations for Z31 (corneal surface, 3mm pupil), Z3−3 (corneal surface, 6mm pupil), Z3−1 (corneal surface, 6mm pupil), and Z5−3 (corneal surface, 6mm pupil). Coma for the smaller 3mm pupil size, represented by Z31, was the corneal surface and total ocular HOA with the highest inter-ocular correlations, as shown in Fig. 1.
There are limitations in our investigation. We did not include any cycloplegia to control the effects of any micro-fluctuations of accommodation. This could limit the value placed on the effects on the whole eye HOAs results. However, micro-fluctuations of accommodation are more associated with their effects on lower order aberrations and have a lesser effect on HOAs.28,29 The subjects enrolled in this study were normal and not expected to demonstrate overtly poor corneal surface or whole eye performance. It could be that meibomian oil tended to reduce corneal surface optical performance because the subjects were normal. In those cases with relatively high values for specific HOAs, the HOA value tended to reduce after meibomian gland expression. Ridder et al.30 reported contrast sensitivity at high frequency (14cpd) to reduce after instillation of particular tear enhancers in normal eyes. Contrasting with this, a study on 5 cases of mild to moderate dry eye revealed an improvement in contrast sensitivity with a particular tear enhancer.20 The difference between studies on relatively dry and normal eyes may be associated with several factors, such as the compatibility and miscibility of the constituents of the tear enhancement regimen, or the tears themselves, and the unique optical properties of the individual eyes under investigation.
It has also been suggested that the dynamic behaviour of the tear film may impact on any correlation between the two eyes.31 Attempts were made to reduce the effects of tear film dynamics by restricting data acquisition to 5s after the final blink on all occasions. Nevertheless, even with this restriction, significant inter-ocular correlations were found in just 5 of the 60 sets of comparisons. Others have found that the optical performance of the eye tends to peak at approximately 6–7s after the blink before deteriorating.30,32 The difference in optical performance between 5 and 6s after the blink were almost imperceptible on closer examination of the reported data. Thus, harvesting data at 5s after the blink was not expected to impact on any inter-ocular correlations.
Lastly, the mean HOA values do not change significantly after adjusting the content of the tear film when the pupils are small. Significant shifts in the mean values can occur when the pupils are large. In practical terms, a patient with tear-related problems may report visual problems when the pupil is large, e.g. driving at night or near work under poor light. In the standard clinical setting, visual problems may not be picked up using standard low contrast charts, because the ambient lighting limits the effect the pupil has reducing the HOA values. However, objective assessment of HOA values under larger pupil conditions may lead to a better understanding and association with reported symptoms.
In conclusion, this study found no detectable differences between right and left eyes when using a Shack–Hartmann aberrometer. When comparing the HOAs values obtained before intervention and 30s afterwards, no change in optical quality was noted for the 3mm pupil, but for the 6mm pupil the tear enhancer tended to improve optical performance of the whole eye, and meibomian gland expression tended to reduce the optical performance at the corneal surface. Further studies are needed to investigate the effect of these two treatment methods on subjects with abnormal tear film characteristics due to dry eye.
Conflicts of interestThe authors have no conflicts of interest to declare.


