

We intended to assess consequences of reduced visual acuity for performance in a natural simple motor task (tracing) using objective kinematic performance measures. Specifically, we intended to elucidate the kind of relationship between the task performance and best corrected binocular visual acuity and to determine the threshold of visual acuity when task performance starts to deteriorate.
MethodsNinety-five individuals with different best corrected visual acuity participated in the study (age 49±12 years, mean±SD, 27 men and 68 women). The participants manually traced maze-like visual patterns of different spatial complexity presented on the screen of a portable notebook computer using Clinical Kinematic Assessment Tool software. Tracing error was computed as performance measure in each trial with a spatial pattern matching technique – rigid point set registration method.
ResultsThe segmented linear regression analysis showed that the relation between visual acuity and tracing errors was best described with a regression function having a break point between two data segments. Tracing performance was unaffected by values of visual acuity below 0.2 on logMAR scale, but when logMAR values increased above this critical limit (i.e. when visual acuity is further reduced), tracing errors linearly increased. The rate of the increase of the tracing error correlated with the complexity of visual stimulus shape.
ConclusionTesting of fine motor functions with objective kinematic measures during visuomotor tasks may help differentiating between actual effects of reduced visual acuity on eye–hand coordination in individuals with similar levels of impairment of visual acuity.
Tratamos de evaluar las consecuencias de la reducción de la agudeza visual sobre el desempeño de una tarea motora simple y natural (trazado) utilizando mediciones cinemáticas y objetivas del desempeño. De manera específica, tratamos de esclarecer el tipo de relación entre el desempeño de la tarea y la agudeza visual binocular mejor corregida, así como determinar el umbral de la agudeza visual a partir del cual el desempeño de la tarea comienza a deteriorarse.
MétodosParticiparon en el estudio noventa y cinco personas con diferente agudeza visual mejor corregida (edad 49±12 años, media±DE, 27 hombres y 68 mujeres). Los participantes trazaron manualmente patrones visuales de tipo laberíntico de diferente complejidad espacial, presentados en la pantalla de un ordenador portátil utilizando el software Clinical Kinematic Assessment Tool. El error de trazado se computó como medición del desempeño en cada ensayo, con una técnica de correspondencia del patrón espacial: el método de registro del conjunto de puntos rígidos.
ResultadosEl análisis de la regresión lineal segmentada reflejó que la relación entre la agudeza visual y los errores de trazado se describía mejor con una función de regresión con un punto de ruptura entre los dos segmentos de datos. El desempeño del trazado no se vio afectado por valores de agudeza visual inferiores a 0,2 en una escala logMAR (superior a 0,63 en una escala decimal), pero cuando los valores de logMAR superaban este límite crítico (es decir, cuando la agudeza visual empeoraba aún más), los errores de trazado se incrementaban de modo lineal. La tasa de incremento del error de trazado se correlacionó con la complejidad de la forma del estímulo visual.
ConclusiónLas técnicas de medición objetiva del desempeño motor durante las tareas visomotoras en personas con diferente agudeza visual pueden aportar un punto de corte ecológicamente válido y preciso para la definición de la discapacidad debida a la disfunción visual.
A substantial number of people (about 4% of the world population1,2) suffer from visual impairment conditions. With the increasing number of elderly individuals in the population, the number of people with visual impairment due to age related ophthalmic conditions can be expected to increase even more despite the progress in ophthalmic health care.3 This is because most aspects of visual function exhibit a linear decline with increasing age.4 Visual impairments have enormous social and economic implications in terms of economic loss and loss of productivity.5 Impaired vision has adverse effects on daily functioning.6 Impaired vision significantly affects performance of fine visuomotor tasks, such as handwriting,7,8 a task that puts high demands on sensory and motor integration to achieve proper eye–hand coordination.33,34
Adverse effects of visual impairment on daily functioning so far typically have been investigated with the use of persons’ self-ratings in terms of subjective assessment of daily functioning, self-efficacy, quality of life6,9,10 or with observer assessed functional tests.11,12 Although manual motor tasks are used for evaluation or training of eye–hand coordination, for example tracing tasks during rehabilitation of people with low vision to increase writing skills,13 performance in such tasks is typically assessed using scoring procedures by observers, without application of objective kinematic measurements. Objective quantification of motor task parameters provides a more exact basis for an understanding of functional decrements due to impaired vision. Thus, in laboratory settings, objective kinematic measures have been used to assess performance during grasping in individuals with glaucoma and amblyopia.14,15 Objective measurement of movement parameters during writing-like visuomotor tasks may be achieved with the help of recently developed software, Clinical Kinematic Assessment Tool (C-KAT).16 It could be used to quantify the effects of visual impairment on eye–hand coordination using kinematic measures of performance in simple visuomotor tasks executed on the screen of a portable computer.
Thresholds of visual acuity for definitions of visual impairment conditions, such as low vision, have been in use for several decades.17 The World Health Organization currently defines low vision as best corrected visual acuity <0.33 on the decimal scale (>0.48 logMAR scale).18 However, the criteria for visual impairment conditions, like low vision, may vary widely, with criteria being defined functionally (disability-based definitions) or being linked to certain thresholds of visual acuity (impairment-based definitions), or combinations of that.19 Although disability-based definitions are linked to detriments in motor abilities, no objective continuous measure of motor performance is typically provided. In turn, impairment-based definitions (i.e. based on visual acuity thresholds) do not provide a clear anchoring of the suggested visual acuity limits to objectively measured detriments of motor function. In practice, visual acuity less than 0.8 (>0.1 logMAR) indicates a visual impairment. However, currently the knowledge is lacking about exactly at which threshold of reduced visual acuity measurable consequences occur for fine motor skills and about the kind of relationship between motor performance and visual acuity. Leat et al. suggested a visual acuity limit of less than 0.5 (>0.3 logMAR) as first leading to disability.19 This threshold is derived from data aggregated from different studies and based on either subjective assessments of gross motor functions or optometric parameters, without objective measurements of motor performance.
The general purpose of the study was accordingly to assess consequences of reduced visual acuity for performance in a natural simple motor task (tracing of visual shapes) using objective kinematic performance measures. Specifically, we intended to elucidate the kind of relationship between the task performance and best corrected binocular visual acuity and to determine the threshold of visual acuity when task performance starts to deteriorate.
MethodsParticipantsNinety-five individuals participated in the study (age 49±12 years, mean±SD, 27 men and 68 women). The participants were recruited among individuals registered at the local Low Vision Centre and their relatives. Participants were not included in the study if they had an impairment of motor function, a neurological disorder, tremor or oculomotor problems on pursuit. No limitations were imposed on inclusion of individuals with normal or corrected to normal vision and individuals with different ophthalmic diagnoses or causes and degrees of vision impairment. Twenty-six of the participants had normal vision and had no ophthalmic diagnoses. Sixty-nine participants had 1 to 4 different ophthalmic diagnoses (median=3). Most prevalent diagnoses were presbyopia (N=22), field of vision defects (20), myopia (12), pseudophakia (8) and keratoconus (8). Some of the participants with ophthalmic diagnoses had normal or corrected to normal visual acuity. All the participants were subjected to a routine clinical visual testing by an optometrist at the Low Vision Centre, where their best corrected binocular visual acuity was measured using a logMAR ETDRS chart, or the Low Vision Bailey and Lovie four letter chart for visual acuity ≥1.3 on logMAR scale. The ETDRS chart distance was 3m. Visual acuity measurements obtained with it were very close to those obtained at 0.4m distance (Pearson correlation coefficient between visual acuities measured at these distances was 0.94; p<0.01). Best corrected binocular visual acuity on the logMAR scale ranged among participants from 2.0 (poor vision) to −0.3 (good vision) (0.26±0.46 mean±SD). Forty-seven participants had a reduced corrected binocular visual acuity (>0 logMAR) and 48 participants had normal visual acuity (≤0 logMAR).
For statistical analyses, all participants were classified into four vision groups depending on the presence of reduced best corrected visual acuity, defects of visual fields, and/or central or eccentric retinal fixation: group 1 (N=48) with normal best corrected vision, normal vision fields and central fixation; group 2 (N=27) with reduced visual acuity due to optical causes, normal visual fields and central fixation; group 3 (N=11) with reduced visual acuity due to retinal causes, vision field defects and central fixation; group 4 (N=9) with reduced visual acuity due to retinal causes, vision field defects, and eccentric fixation.
The Regional Ethics Review Board approved the study. All participants provided written informed consent before participation.
Testing setupVisual tracing tasks were designed and displayed on the screen of a tablet notebook PC (Fujitsu Siemens) using Clinical Kinematic Assessment Tool software.16 The screen of the tablet was rotated and folded to provide a horizontal writing surface. The screen contained integrated sensors that measured the planar position of the tip of the pen-shaped input stylus with a precision of 0.5mm at a sampling rate of 125Hz. The size of the active tablet screen area used for the tests was 286mm×179mm. The presented visual stimuli for the tracing task occupied the central screen area with dimensions 226mm×30mm. Participants sat comfortably at a desk, the tablet was positioned on the desk in front of them in a landscape orientation. The participants could alter the height of the chair to adjust for the height of the tablet on the desk. The eye-screen distance was about 40cm. Before the testing, participants were invited to hold the stylus and write with it on the tablet for a few minutes to become familiar with it. During testing, the participants used vision correction means that they normally used for daily tasks of similar nature.
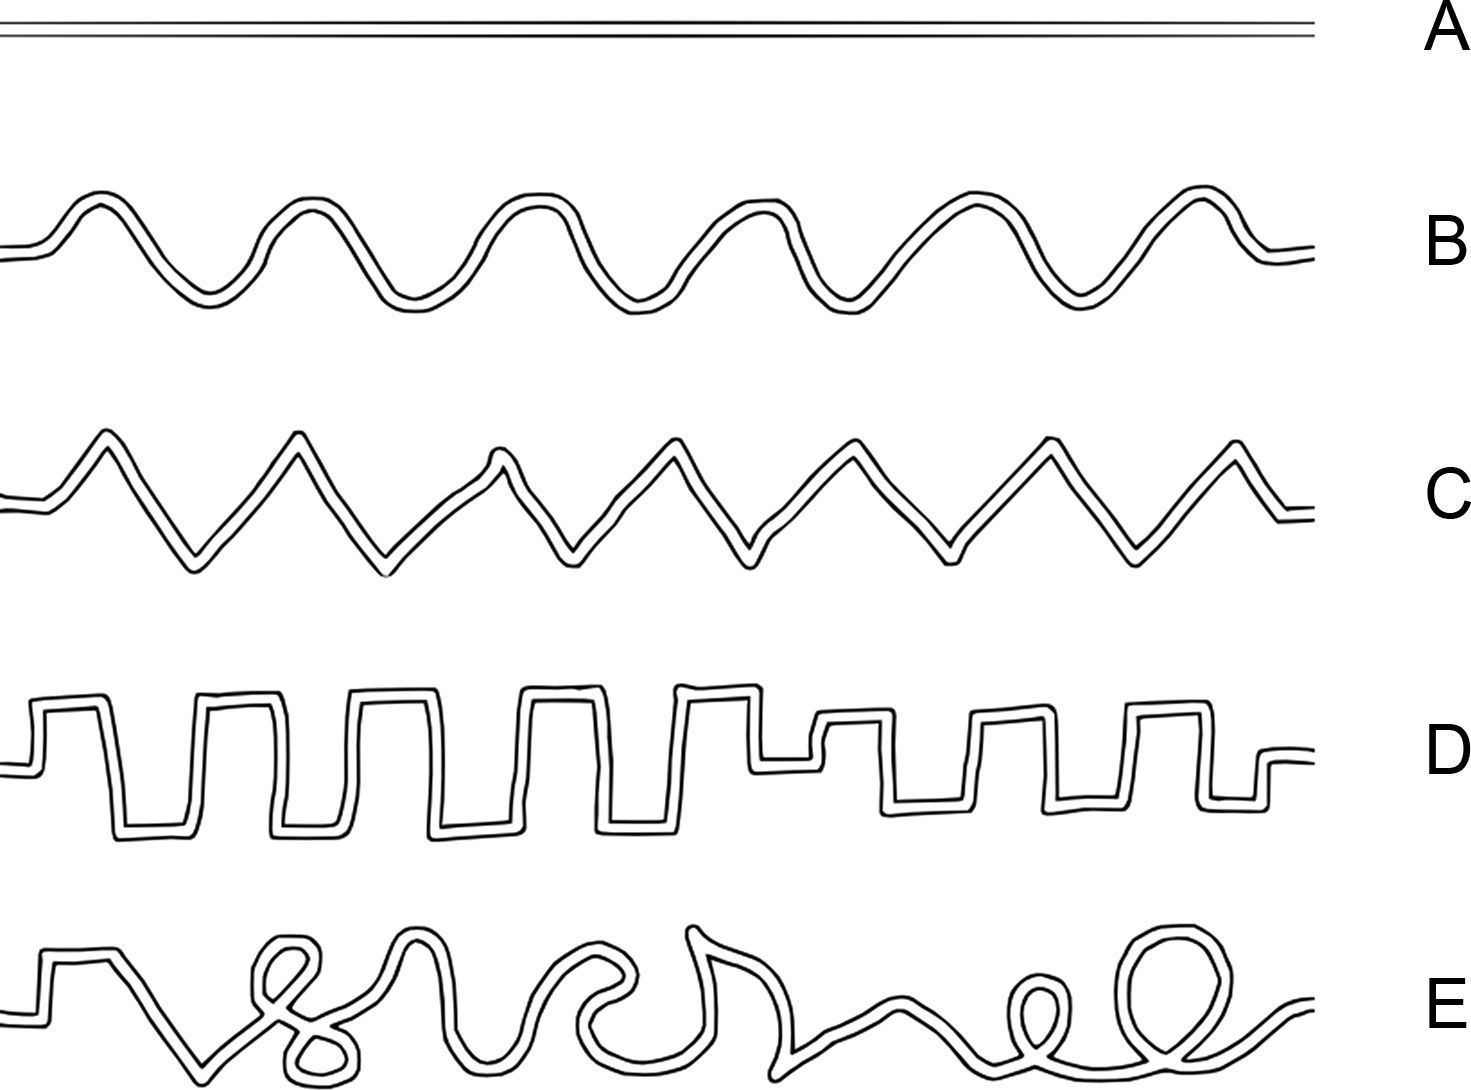
Testing procedureIn each trial of the tracing task the participants were presented with a maze-like visual pattern – a tracing path – on the tablet screen. There were five different path shapes, which in the following are denoted as “line”, “sine”, “triangle”, “square” and “complex” (Fig. 1). The width of the tracing path, i.e. the inner space between the borders of the maze, was about 2mm. The thickness of the borders of the maze path was about 0.6mm. One tracing path was presented at a time. The paths are shown in Fig. 1 from A to E in the order of increase of spatial complexity according to our subjective estimate how difficult they would be for the participants to trace.
 “line”, (B) “sine”, (C) “triangle”, (D) “square” and (E) “complex”.")
The participants were instructed to follow through the path with the hand-held stylus such that its tip should follow the middle of the path. Although participants did not receive any explicit instructions about the time limit for the task, the duration for each trial was set to 120s. All participants accomplished tracing within this time limit. In the beginning of each trial, a button “Start” was presented on the left side of the screen and participants were instructed to place the stylus tip inside the button. After they stayed there for 0.5s, a tracing path template appeared on the screen with a “Goal” button on its right end and the participants started tracing from the left to the right toward the “Goal” button at a preferred speed. After they reached the “Goal” button, the trial ended and next trial started automatically. While participants followed through the presented path, the stylus left a visible trace on the screen. The width of the drawn trace was about 1mm and its color was purple. Each participant performed 10 trials of the tracing task in total. Each of five path shapes was presented twice. The order of presentation of tracing paths was randomized. Two additional practice trials were administered prior to testing.
Data processingEach stimulus path was presented on the screen in the form of a black maze template on a white background (Fig. 1). To allow spatial comparison of the stimulus path and the trace drawn by the participants, each presented stimulus path was digitized and X and Y coordinates of the virtual midline curve of the stimulus path were obtained. This curve was then used as the reference stimulus curve for comparison to the trace drawn by the participants.
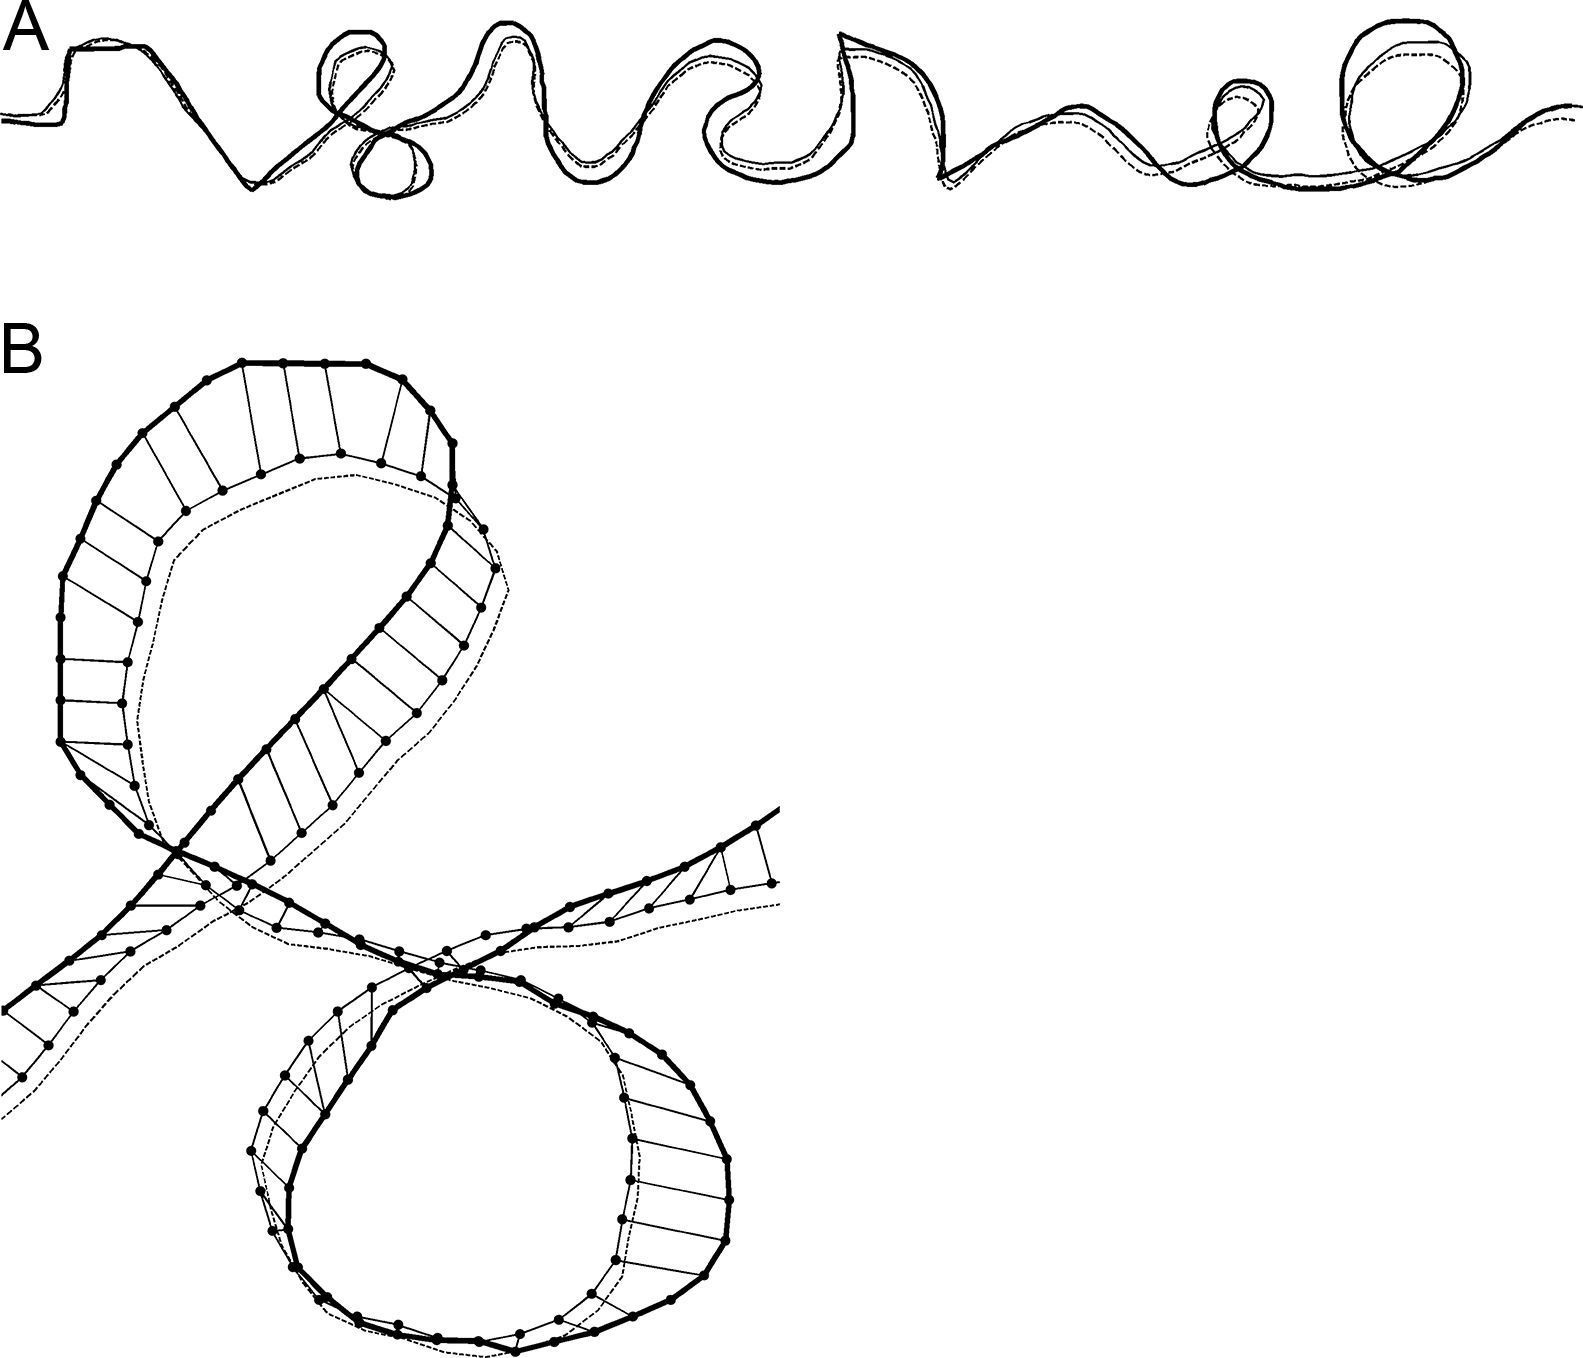
In order to quantify the precision of tracing, temporal information in the kinematic data was discarded and the analysis was focused on the spatial relations between the stimulus reference curve and the trace drawn by participants (c.f. Gonzales et al.,20). The X and Y coordinates of the drawn trace and the reference stimulus curve were resampled by linear interpolation in order to achieve spatial resolution of 1mm for both curves. The trace drawn by the participants was compared to the reference stimulus curve by means of the rigid point set registration method.21 In an iterative procedure, this method finds pairs of corresponding points on the reference stimulus curve and on the trace drawn by participants and compares spatial relations between the curves. By applying transformations (translation, rotation and scaling) to the drawn trace that preserve its shape but eliminate systematic biases (off-set, directional deviation and size difference, respectively), the method computes new X and Y coordinates of the trace drawn by participants (adjusted trace) and matches them with corresponding points of the reference stimulus curve. The adjusted trace drawn by participants that spatially matches best with the stimulus reference curve is selected as the final solution. The methodology is illustrated in Fig. 2, where the final solution is presented for “complex” tracing path.
 The whole tracing path. (B) Magnified selected part of the tracing path. Interconnected dots show the pairs of the corresponding points on the adjusted trace and on the reference stimulus curve.")
Example of the result of the rigid point set registration computational method for the “complex” path shape for one participant in one trial. The reference stimulus curve, the originally drawn trace by participant and the adjusted trace are shown by thick solid line, thin dashed line and thin solid line, respectively. (A) The whole tracing path. (B) Magnified selected part of the tracing path. Interconnected dots show the pairs of the corresponding points on the adjusted trace and on the reference stimulus curve.
To quantify the precision of tracing in each trial, the scalar distances between the corresponding points of the final solution of the adjusted trace drawn by participants and of the reference stimulus curve were computed. Then the median value of the scalar distances was computed as a measure of precision of tracing (“tracing error”) in that trial.
Point set registration computations and computations of tracing error were performed in Matlab v.8 (The MathWorks).
Statistical analysisSegmented linear regression analysis22 on visual acuity and tracing errors was performed in SegReg program.23 This program performs fitting of several regression models to data and selects a model with the best fit based on the highest coefficient of explanation and on significance testing. If a break point, i.e. a sudden change in the relation between the predictor and the dependent variable, is present in the data, the program finds the location of the break point and provides regression functions for segments of the data before and after the break point. Other statistical analyses were performed in SPSS v.20 (IBM SPSS Statistics).
Consistency of motor performance was studied with intraclass correlation analysis. Effects of complexity of tracing paths and vision groups on tracing errors were studied with repeated measures ANOVA.
ResultsThe mean best corrected visual acuity values on the logMAR scale for the four vision groups were −0.09 (group 1), 0.42 (group 2), 0.7 (group 3) and 1.1 (group 4).
Consistency of performanceThe intraclass correlation coefficient for tracing errors in the first and second trial (ICC, two-way mixed model, consistency definition, single measures) was 0.43 for “line” path, 0.89 for “sine”, 0.89 for “triangle”, 0.92 for “square” and 0.86 for “complex” path (all p's<0.001). Thus, consistency of tracing between the first and second trial was moderate for “line” path shape and high for all other path shapes. Repeated-measures ANOVA showed that there was no significant difference in tracing error between the first and second trial for any tracing path shape (all p's>0.05). Thus, there were no significant practice effects on the tracing error for any of the tracing path shapes. Further ICC-analysis of tracing errors showed high consistency of tracing among the five tracing path shapes, ICC=0.83 (p<0.001). Data of the first and second trial for each path shape were pooled (averaged) for further analyses.
Relative spatial complexity of path shapesIn order to determine relative spatial complexity of the presented stimuli paths, i.e. their difficulty for the participants, we computed the average speed of hand movement during tracing as a normalized indicator of tracing difficulty by dividing the constant given length of the presented stimuli path by the actual duration of tracing of this path. In line with Fitts's law, speed of movement typically becomes slower if demands on precision increase, i.e. if stimuli path difficulty increases.24,25
We performed a repeated measures ANOVA on the obtained tracing speeds for the five path shapes, with path shape serving as the within-subjects factor and vision group as the between-subjects factor. A significant main effect of path shape on tracing speed was found (Greenhouse–Geisser, F[1.1, 102.3]=50.32, p<0.001), but no main effect of vision group or interaction effect between path shape and vision group. Subsequent pairwise Bonferroni-adjusted comparisons showed that during tracing of the “line” path, participants were significantly faster (29.7mm/s) than during tracing of the other paths, while tracing speeds for the other paths were not consistently significantly different from each other (18, 18.1, 16.8 and 17.5mm/s for “sine”, “triangle”, “square” and “complex” path, respectively).
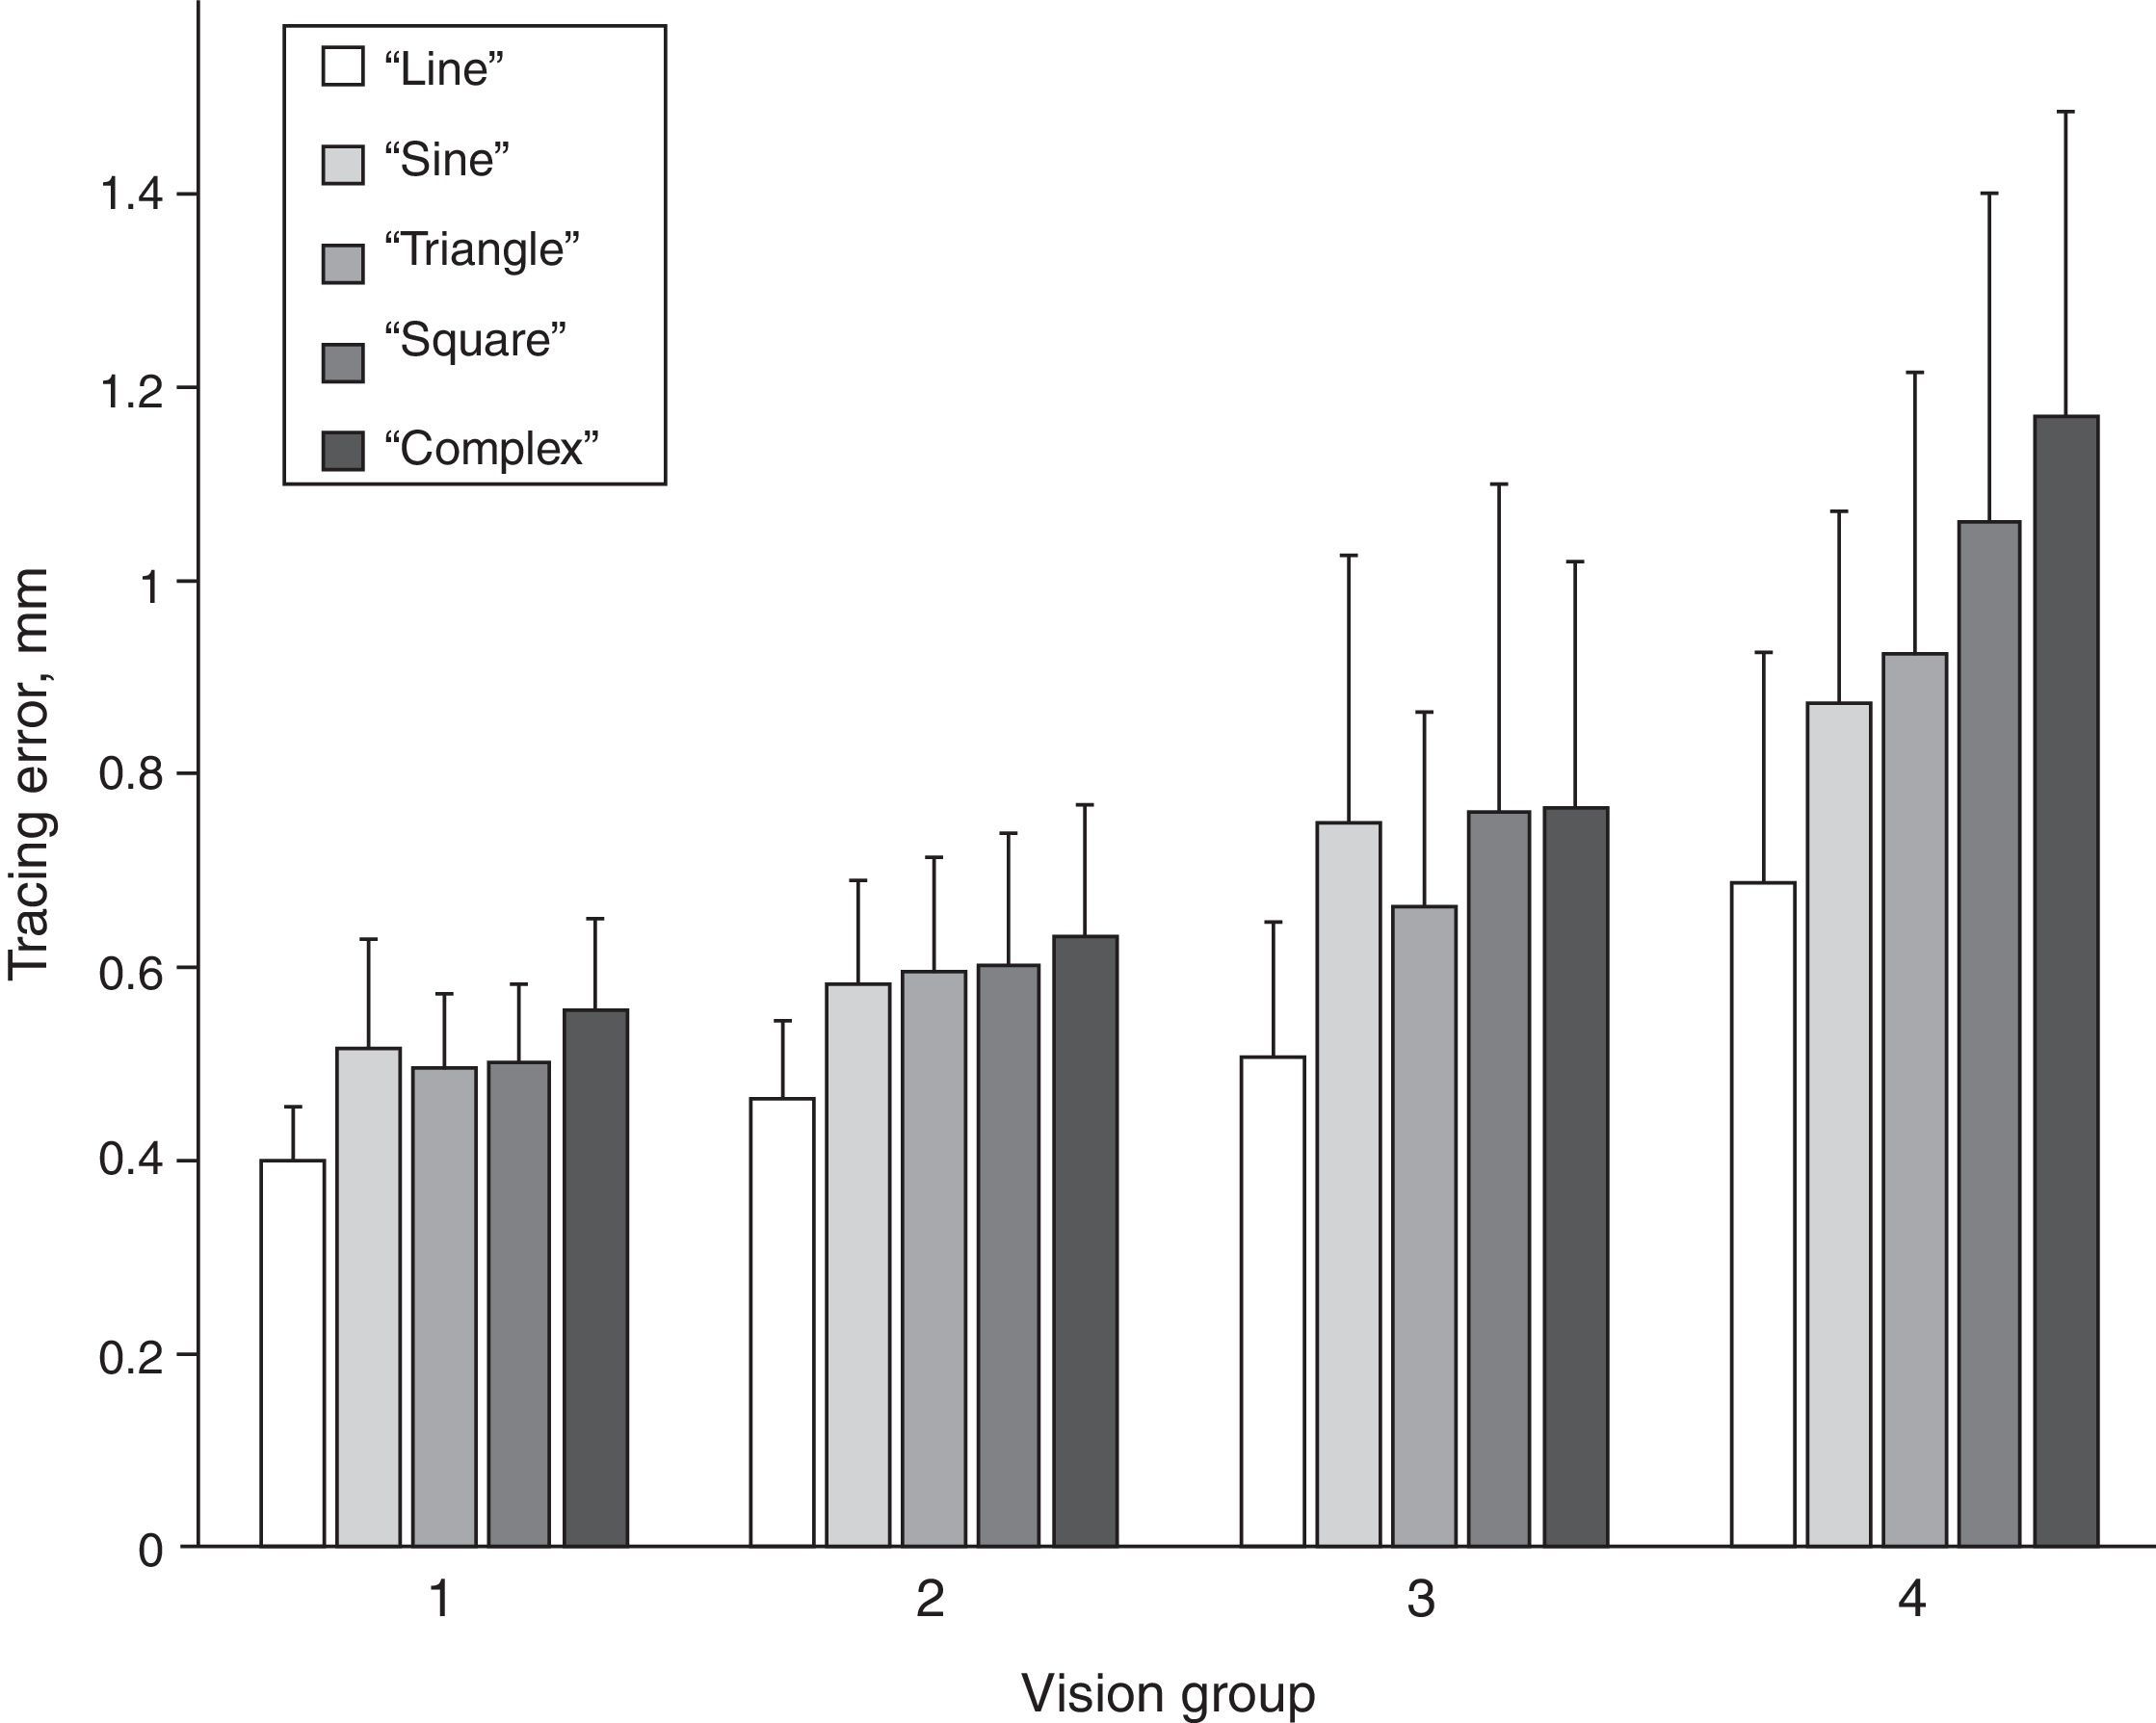
Magnitude of tracing errorsFurther we investigated differences in the magnitude of the tracing error among different tracing path shapes in the four vision groups. The magnitudes of the tracing errors for the five path shapes and for the four vision groups are shown in Fig. 3. A repeated measures ANOVA with path shape as within-subjects factor and vision group as the between-subject factor showed a significant main effect of path shape (Greenhouse–Geisser, F[3.4, 307.3]=100.62, p<0.001). In addition, there was a significant main effect of vision group (Greenhouse–Geisser, F[3,90]=33.92, p<0.001), as well as a significant interaction effect between path shape and vision group (Greenhouse–Geisser, F[10.2, 307.3]=7.90, p<0.001). Bonferroni-corrected pairwise comparisons showed that tracing errors significantly increased from “line” path through “sine”, “triangle” and “square” to “complex” path (p<0.01) (Fig. 3), with mean tracing error values being 0.46, 0.59, 0.58, 0.61 and 0.65mm, respectively. Only the tracing errors for “sine” and “triangle” paths were not significantly different from each other.
.")
The mean tracing errors increased from vision group 1 through 2 and 3 to group 4, with tracing error values being 0.49, 0.57, 0.69 and 0.94mm, respectively. Bonferroni-adjusted pairwise comparisons revealed that all four vision groups differed from each other in tracing error either significantly (all but two pairs, p<0.001) or on the border of significance (group 1 vs 2 p=0.058 and group 2 vs 3 p=0.087). The interaction effect between vision group and path shape was caused by a higher rate of increase of the tracing error from “line” to “complex” path for vision group 4 in comparison to the other groups, as also can be seen in Fig. 3.
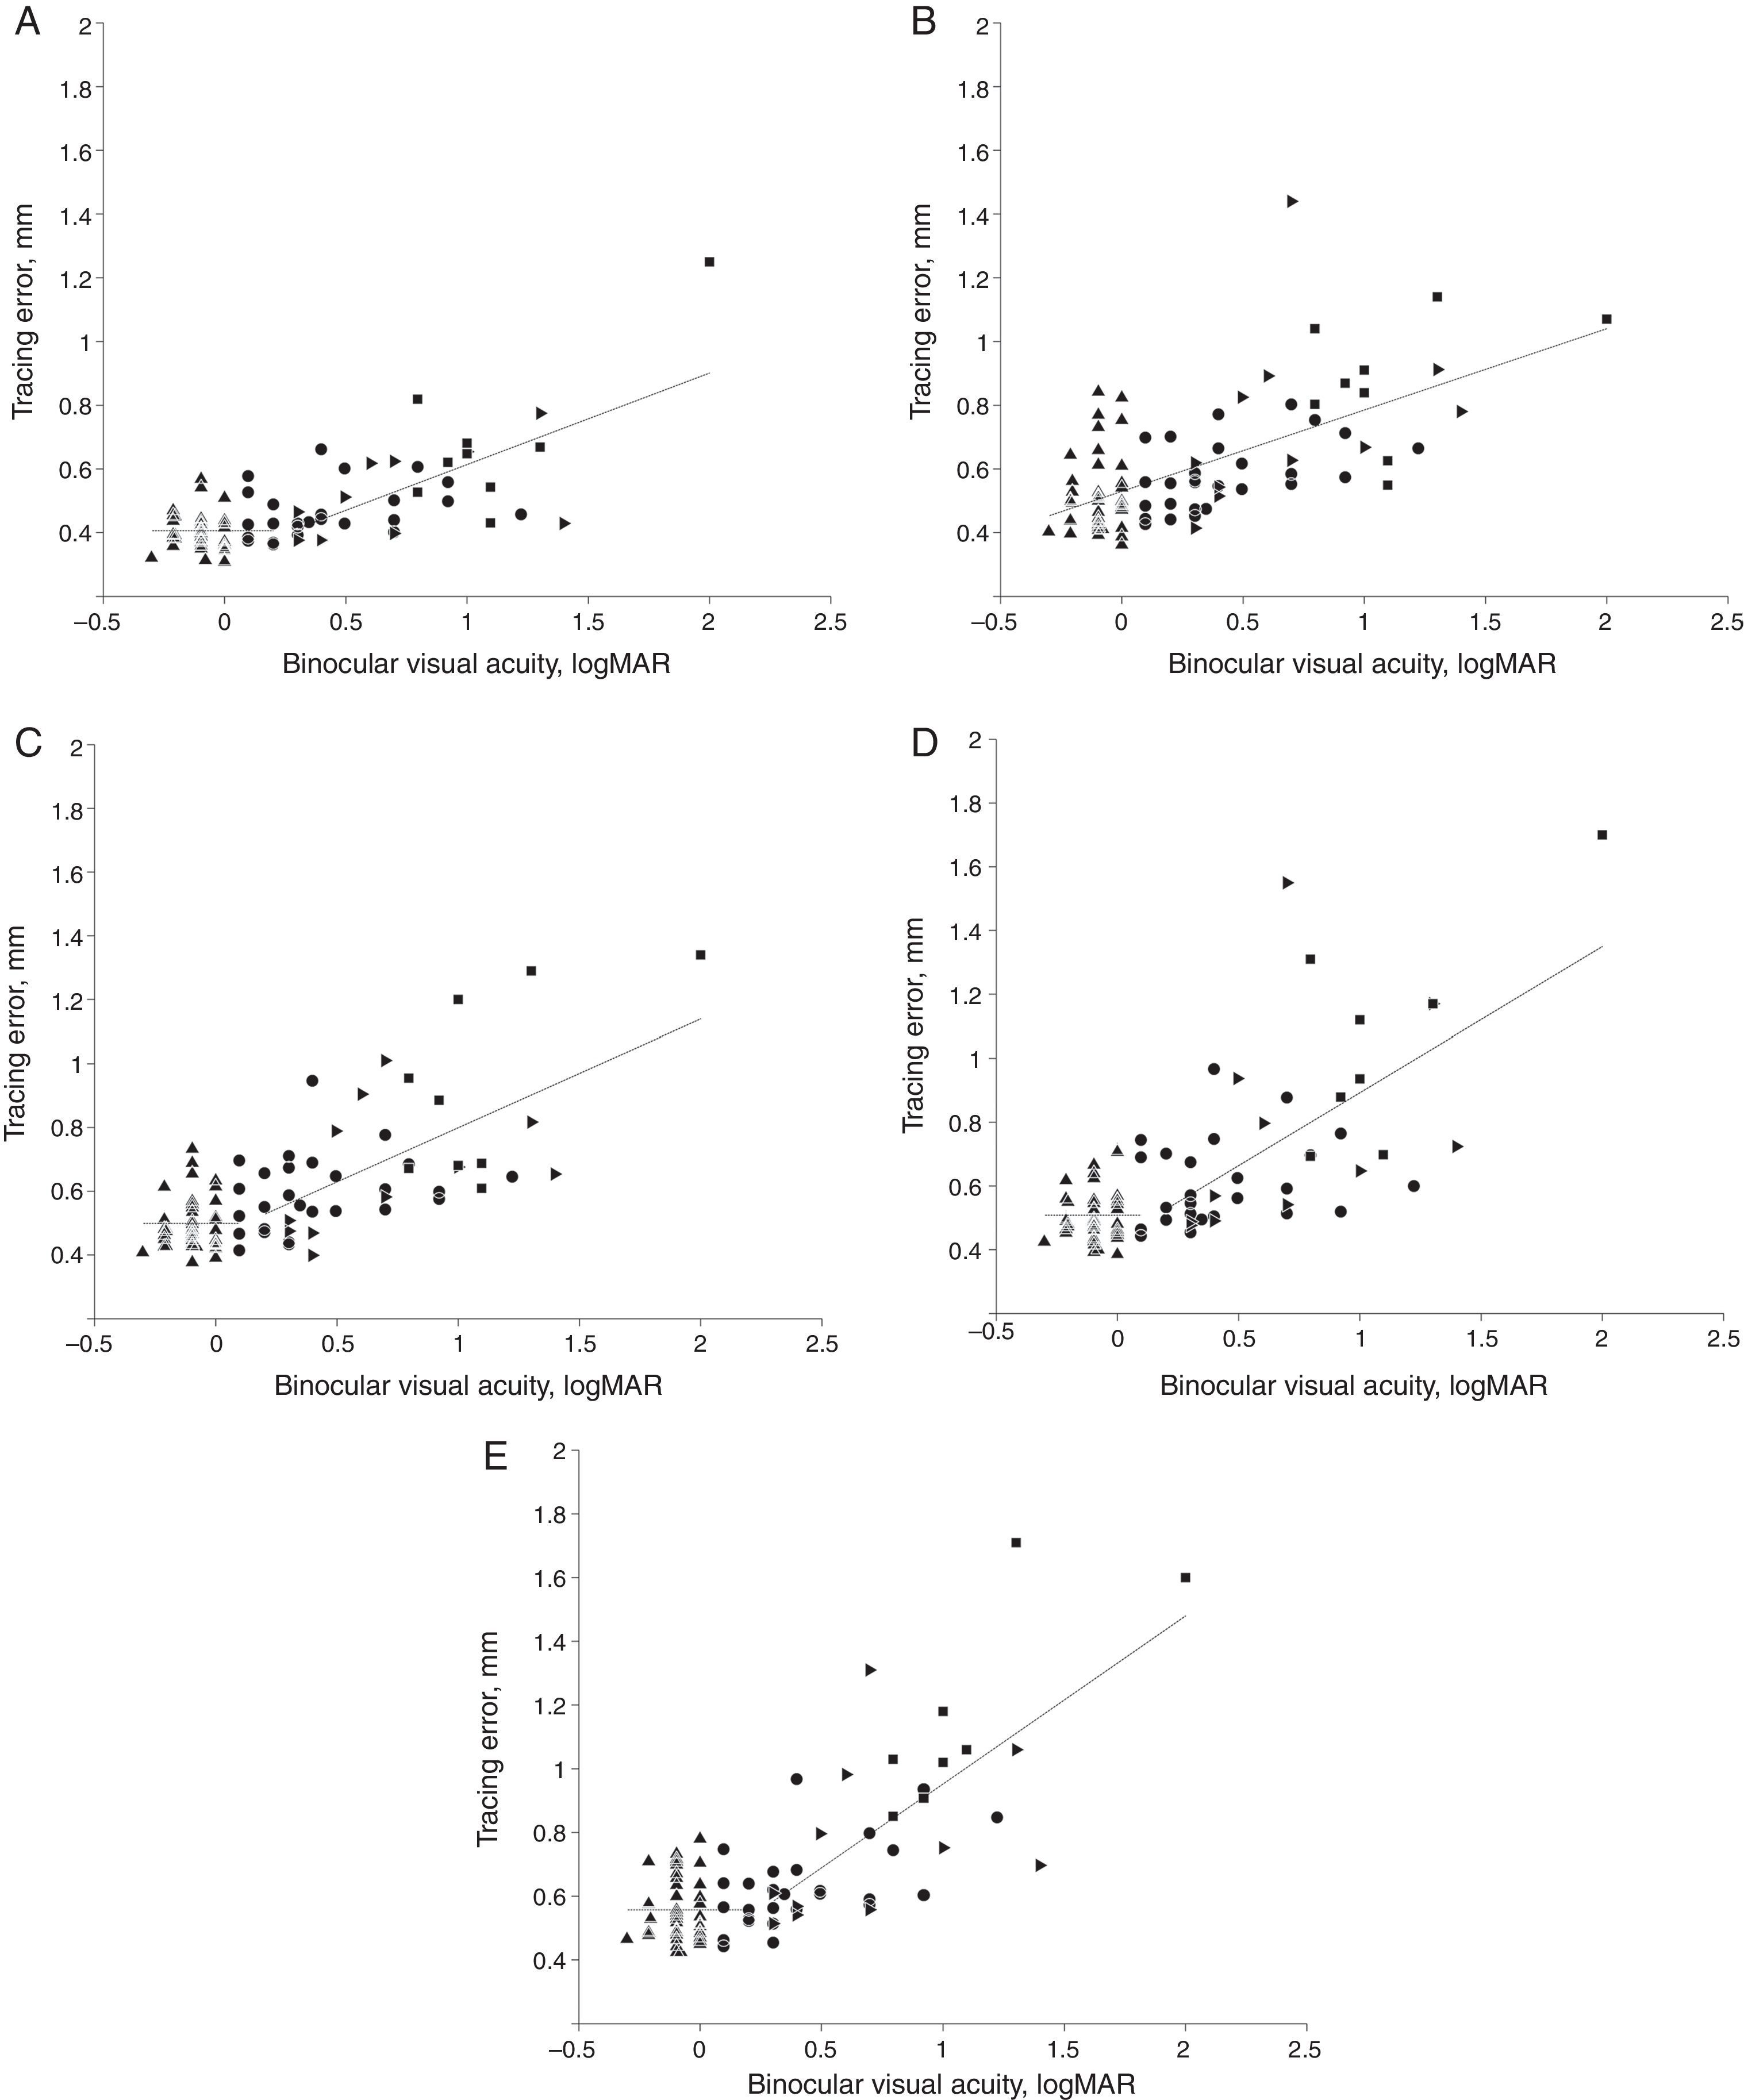
Relationship between tracing error and visual acuityThe subsequent analyses were performed on all participants without separation in vision groups. However, the vision groups were graphically shown by different symbols in Fig. 4. There was a significant correlation between tracing errors and visual acuity (logMAR scale). Pearson correlation coefficients were 0.70, 0.64, 0.70, 0.70 and 0.74 for “line”, “sine”, “triangle”, “square” and “complex” path shapes, respectively (all p's<0.001). That is, the worse the visual acuity the worse the performance in each of the five tracing tasks.
 “line”, (B) “sine”, (C) “triangle”, (D) “square” and (E) “complex”. Vision groups 1–4 are shown by filled up-triangles, circles, right-triangles and squares, respectively. Breakpoint values on logMAR scale for “line”, “triangle”, “square” and “complex” path were 0.27, 0.11, 0.16 and 0.25, respectively (logMAR values ≤0 reflect normal and values >0 reduced visual acuity).")
Segmented linear regression: binocular visual acuity vs tracing error. Regression functions for data segments are shown by dashed lines. Tracing path shapes: (A) “line”, (B) “sine”, (C) “triangle”, (D) “square” and (E) “complex”. Vision groups 1–4 are shown by filled up-triangles, circles, right-triangles and squares, respectively. Breakpoint values on logMAR scale for “line”, “triangle”, “square” and “complex” path were 0.27, 0.11, 0.16 and 0.25, respectively (logMAR values ≤0 reflect normal and values >0 reduced visual acuity).
In order to further elucidate the kind of relationship between visual acuity and kinematic performance in the tracing task, segmented linear regression (SLR)22 analysis was applied to tracing error as the dependent variable (Y) and values of best corrected binocular visual acuity (logMAR scale) as independent variable (X) for each tracing path shape. The SLR analysis showed that the relation between binocular visual acuity and tracing error for most tracing path shapes was best described by regression functions with a break point within the 0.11–0.27 interval of visual acuity on logMAR scale, as shown in Fig. 4 (A, C, D and E). Coefficients of explanation R2 for the regression models for “line”, “triangle”, “square” and “complex” paths were 0.53, 0.5, 0.51 and 0.59 respectively, all p's<0.01. For “sine” path, however, no breakpoint was detected and the relationship was best described by a single regression line (Fig. 4B) with coefficient of explanation R2 of 0.4, p<0.01. The rate of the increase of the tracing error after the break point correlated with the predicted spatial complexity of the visual stimulus path. Thus, the slope in the regression equation for “line”, “triangle”, “square” and “complex” path was 0.29, 0.34, 0.46 and 0.53, respectively.
DiscussionThe segmented linear regression (SLR) analysis showed that for most stimuli shapes the tracing errors remained relatively unaffected in individuals with best corrected binocular visual acuity below the interval 0.11–0.27 logMAR. When binocular visual acuity logMAR values increased above this interval, tracing errors exhibited a steady linear increase in magnitude. The exception was the “sine” tracing path for which a continuous steady increase in tracing error with reduction of visual acuity was found, without a breakpoint. Although a breakpoint in the data for “sine” tracing path could not be detected statistically in the SLR analysis, the distribution of the data points for “sine” tracing path (Fig. 4B) might visually suggest a hint of a breakpoint in a similar interval as for other path shapes. The slopes of regression lines above the breakpoint in Fig. 4 were naturally mostly influenced by performance of individuals with lower visual acuity, since their visual acuity values were located above the breakpoint. Performance of individuals with normal or sub-normal visual acuity was not affected by the visual acuity value. The value of the slope depended on how performance of the individuals with lower visual acuity was affected by the relative difficulty of the stimulus. The found critical interval of visual acuity in which detriments in tracing start to occur lies above the normal value ≤0 of visual acuity on the logMAR scale. Thus, individuals that are having a minor reduction of visual acuity according to optometric criteria nevertheless perform fine motor tasks as successfully as individuals with normal vision.
The critical interval of binocular visual acuity for tracing performance decrements in our study was relatively close to the visual acuity value for the definition of low vision by the World Health Organization (WHO).18 The WHO's definition of low vision is visual acuity <0.33 and >0.05 on the decimal scale in the better eye with best correction. Our results indicate, however, that detriments in eye–hand coordination start to occur already at a higher decimal value of reduced visual acuity than in the WHO definition of low vision. Furthermore, the found decimal visual acuity threshold was somewhat higher than the one suggested by Leat et al. (0.5).19 Our objective motor performance measure was likely more sensitive to reduction of visual acuity and could more precisely identify the threshold of visual acuity when performance in fine manual motor actions starts to deteriorate.
The results of the evaluation of the relative complexity of tracing path shapes was in line with our subjectively predicted tracing difficulty of presented visual stimuli (Fig. 1). Based on the values of tracing speed, magnitude of tracing error and also on the rate of tracing error increase in the segmented linear regression (Fig. 4), the stimuli could be ranked in the order of increasing difficulty as the following: “line”, “sine”, “triangle”, “square” and “complex” path shape. The only stimulus without any curvature changes (“line”) was traced substantially faster than other stimuli that had curvature changes of some kind. However, even while tracing the simplest “line” stimulus, participants nevertheless made tracing errors, which were smaller, but of comparable order of magnitude as tracing errors made during tracing of other stimuli. The instructions given to the participants were the same for tracing of different stimuli types. The fact that participants made tracing errors of comparable magnitude for all types of stimuli, including “line”, indicates that participants complied with instructions and tried to achieve a certain similar level of precision during tracing of different path shapes. The participants moved faster if the stimuli configuration allowed it without a sacrifice of precision, like with “line” path. In general, with greater complexity of the task, precision of tracing decreased, indicating increasing demands on eye–hand coordination in the range of visual stimuli from “line” shape to “complex” shape.
The tracing performance of the four vision groups followed the found relationship between visual acuity and tracing error, with group 1 with the best average visual acuity having best tracing performance and the group 4 with the worst average visual acuity having the worst tracing performance. The inspection of the distribution of vision groups in the segmented linear regression analysis plots did not reveal any further particular differences between vision groups. However, the significant interaction of vision group and tracing path shape in the ANOVA analysis of the magnitude of the tracing errors showed that individuals with eccentric fixation (vision group 4) differed from the individuals in the other three groups. Individuals with eccentric fixation exhibited significantly larger difficulties in tracing when stimulus path became more complex in comparison to participants in the other three vision groups. Shifting retinal locus of fixation away from the fovea results in a decrease of the image spatial resolution26,27 and thus a poorer vision of the object.28 This in all likelihood leads to impoverished on-line visual feedback during tracing movements, and thus a decreased performance due to less coordinated eye–hand tracing movements, as has been shown in individuals with central scotomas.29
Variation in tracing error among individual participants was substantially larger in vision groups 3 and 4 than in groups 1 and 2. This can be deduced from the length of the error bars in Fig. 3 and the spread pattern of data points in Fig. 4. In Fig. 4, variation among participants in tracing error is relatively low for the values of visual acuity below break point (mostly groups 1 and 2) and increases above break point (mostly groups 3 and 4), i.e. when tracing error increases. Thus, some individuals with impaired visual acuity in groups 3 and 4 performed tracing tasks substantially worse than other individuals with close to identical levels of impairment of visual acuity in the same groups. Hence, visual acuity testing alone cannot predict detriments of the fine motor functions or their consequences for motor tasks, similar to those used in our study, for example, writing. Objective testing of fine motor functions, such as tracing, may in this regard help differentiating between actual effects of impaired vision on eye–hand coordination and the impact of this deficit on motor performance in individuals with similar levels of impairment of visual acuity. Except visual acuity, there could be possible influence of other factors affecting tracing performance, which may contribute to variation in tracing error among different people with vision impairment. Such factors may include, for example, the ability to perform appropriate saccadic or smooth-pursuit eye-movements (c.f. Lorenceau30) and higher ability of attentive tracking of the visual target.31,32
A “floor effect” of tracing performance during tracing tests used in this study might have been present. The tracing stimuli might not have been difficult enough, which might have led to a substantially smaller variation in tracing error among the participants than it would have been if a more complex tracing stimuli had been used. In line with this assumption, for simpler tracing paths, and especially for the “line” path (Fig. 4A), variation among participants was relatively low, both in vision groups 1 and 2 and groups 3 and 4. However, with an increase of path complexity, especially for “square” and “complex” paths, variation among participants in groups 3 and 4 increased substantially. Thus, using more complex tracing stimuli might allow for better differentiating of different levels of tracing performance in individuals with similar visual acuity but with different underlying causes of vision impairment. This will be investigated in future studies using more elaborate and complex tracing stimuli.
Among other limitations of our study, except possibly insufficient complexity of visual stimuli, there were a small number of participants in vision groups 3 and 4 in comparison to groups 1 and 2 and too heterogeneous underlying visual pathologies in the whole sample, with some participants having several visual diagnoses, and especially in groups 3 and 4. In future studies, however, it would be interesting to include participants with homogenous symptoms to evaluate specific hypotheses concerning aspects of certain visual pathologies separated from other symptoms at different levels of visual acuity.
ConclusionThe results of the study suggest that the used tracing performance measure (tracing error) was consistent across repetitions of tracing task with the same type of visual stimulus and across different shapes of visual stimuli, thus providing a reliable measure of tracing performance. The found threshold interval of reduced visual acuity, when motor performance started to deteriorate, was close to the WHO's low vision criterion. A linear decrease in motor performance was observed with reduction of visual acuity beyond the critical threshold. Testing of fine motor functions with objective kinematic measures may help differentiating between actual effects of reduced visual acuity on eye–hand coordination in individuals with similar levels of impairment of visual acuity.
Conflict of interestThe authors have no conflicts of interest to declare.
This study was supported by a grant to Lars-Olov Lundqvist from the REHSAM Research Program at The Swedish Social Insurance Agency, number 99368-2009/RS11, and to Hans O. Richter from AFA Försäkring and the Swedish Council for Working Life, Social Research Grant 2009-1761.
We thank our volunteers for their generosity and patience. Research engineer Nils-Göran Larson is acknowledged for excellent engineering assistance. Peter Culmer and Mark Mon-Williams are greatly acknowledged for help with the Clinical Kinematic Assessment Tool program that was used for data acquisition.
The Regional Ethics Review Board approved the study. All participants provided written informed consent before participation.


