

To determine the reliability of corneal endothelial cell density (ECD) obtained by automated specular microscopy versus that of validated manual methods and factors that predict such reliability.
MethodsSharp central images from 94 control and 106 glaucomatous eyes were captured with Konan specular microscope NSP-9900. All images were analyzed by trained graders using Konan CellChek Software, employing the fully- and semi-automated methods as well as Center Method. Images with low cell count (input cells number <100) and/or guttata were compared with the Center and Flex-Center Methods. ECDs were compared and absolute error was used to assess variation. The effect on ECD of age, cell count, cell size, and cell size variation was evaluated.
ResultsNo significant difference was observed between the Center and Flex-Center Methods in corneas with guttata (p=0.48) or low ECD (p=0.11). No difference (p=0.32) was observed in ECD of normal controls <40 yrs old between the fully-automated method and manual Center Method. However, in older controls and glaucomatous eyes, ECD was overestimated by the fully-automated method (p=0.034) and semi-automated method (p=0.025) as compared to manual method.
ConclusionOur findings show that automated analysis significantly overestimates ECD in the eyes with high polymegathism and/or large cell size, compared to the manual method. Therefore, we discourage reliance upon the fully-automated method alone to perform specular microscopy analysis, particularly if an accurate ECD value is imperative.
Determinar la fiabilidad de la densidad celular endotelial corneal (ECD) obtenida mediante microscopio especular automático frente a métodos manuales validados y factores predictivos de la fiabilidad.
MétodosSe capturaron imágenes nítidas de 94 controles y 106 ojos glaucomatosos con un microscopio especular Konan NSP-9900. Todas las imágenes fueron analizadas por examinadores expertos mediante el software Konan CellChek, utilizando los métodos automatizado total, semiautomático y de centrado. Se compararon las imágenes con bajo recuento celular (número de células <100) y/o córnea guttata con el método de centrado y centrado flexible. Se compararon las ECD, utilizándose el error absoluto para valorar la variación. Se evaluó el efecto de la ECD sobre la edad, el recuento celular, el tamaño celular y la variación del tamaño celular.
ResultadosNo se observó diferencia significativa entre los métodos de centrado y centrado flexible en las córneas con guttata (p=0,48) o baja ECD (p=0,11). No se observó diferencia (p=0,32) en cuanto a ECD en los controles normales<40 años entre el método totalmente automatizado y el método de centrado manual. Sin embargo, en los controles mayores y en los ojos glaucomatosos, la ECD fue sobreestimada por el método totalmente automatizado (p=0,034) y el método semiautomático (p=0,025), en comparación al método manual.
Conclusión: Nuestros hallazgos muestran que los análisis automatizados sobreestiman considerablemente la ECD en los ojos con alto polimegatismo y/o gran tamaño celular, en comparación al método manual. Por tanto, no recomendamos confiar en el método totalmente automatizado por sí solo para realizar estudios mediante microscopio especular, particularmente en casos en que la precisión del valor de ECD sea imperativo.
Endothelial cell density (ECD) values are routinely used in clinical practice to evaluate the status of the corneal endothelium to make treatment and surgical decisions and to gauge the safety of new drugs, devices and surgical processes during clinical trials.
Non-contact specular microscopes such as the Konan NSP-9900 capture sharp images with sufficient magnification for reliable ECD determination or morphometric analysis. The fixed-frame method for determine ECD allows quantitative analysis of cell structure, including ECD, coefficient of variation (CV), and percentage of hexagonal cells (HEX).1–3
The Konan CellChek software uses several different approaches, varying in speed and complexity, to obtain ECDs, from fully- and semi-automated to manual.4–8 The automated analysis method, or Auto-Trace, automatically outlines endothelial cells and calculates cell density, cell size and hexagonality. In the fully-automated method, the default cell size S pattern is used, while in the semi-automated method, the cell size is manually selected from S to XL. The most commonly manual analysis methods are the Center Method and the Flex-Center Method. In the Center Method, the user marks the center of each cell in a contiguous group, and the software then counts the number of cells by determining cell area from a polygon digitization by locating cell border intersections.9 In the Flex-Center Method, based on the Center Method, the outer boundary of all visible cells is outlined by clicking the intersection of three cells. The use of Flex-Center Method is suggested by the manufacturer when fewer contiguous cells are visible.
We compared automated and manual methods of ECD measurements to determine the optimal methods in terms of accuracy under different conditions and the factors that predict reliability of ECD values in normal and glaucomatous eyes.
MethodsPatients and endothelial photographyNinety-nine normal control eyes and 112 open angle glaucomatous eyes with or without uveitis spanning a wide range of cell densities were recruited from the Doheny Eye Center between May 2013 and May 2014, and were included in the study. None of the eyes had any history of prior intraocular surgery, ocular trauma, keratitis or contact lens wear. Central images of corneal endothelium were captured for each eye with a Konan NSP-9900 specular microscope (Konan Medical USA Inc., Irvine, CA). This study was approved by the Institutional Review Board of University of Southern California (at that time the affiliation of Doheny Eye Institute). Informed consent was obtained from all participants, and the study followed the tenets of the Declaration of Helsinki.
Endothelial cell analysisImages were evaluated by certified graders at the Doheny Image Reading Center using automated and manual methods with Konan CellChek software. To eliminate variability due to poor image quality,10–13 only sharp images with easily identified cell borders were analyzed. The ECD and CV values were calculated with the fully-automated, semi-automated and Center Methods in all images. Images with low cell count [input number (INP) below 100] and/or guttata were graded manually by using both the Center and Flex-Center Methods. The effects on ECD of age, cell count, cell size, and cell size variation were evaluated. Variation in ECD values was determined based on absolute percent error. An absolute error <5% was considered as an acceptable agreement.11 Cell size variation was based on the CV value, where CV ≥ 32 was considered high variation (i.e. polymegathism).14
Statistical analysis
The average of ECD values obtained by two different graders were used for statistical analyses performed by SPSS ver. 19.0 (SPSS Inc., Armonk, NY). Images were stratified by guttata, low cell density (ECD<1500cells/mm2), CV value and age. Paired two tailed t-test and one way ANOVA were used to compare ECD values obtained by fully-automated, semi-automated, Center and Flex-Center Methods in eyes with glaucoma and healthy controls. A p value of <0.05 was considered statistically significant. Agreement between the analysis methods with respect to ECD evaluation was also assessed by the Bland–Altman method (MedCalc, version 12; MedCalc software bvba, Mariakerke, Belgium).
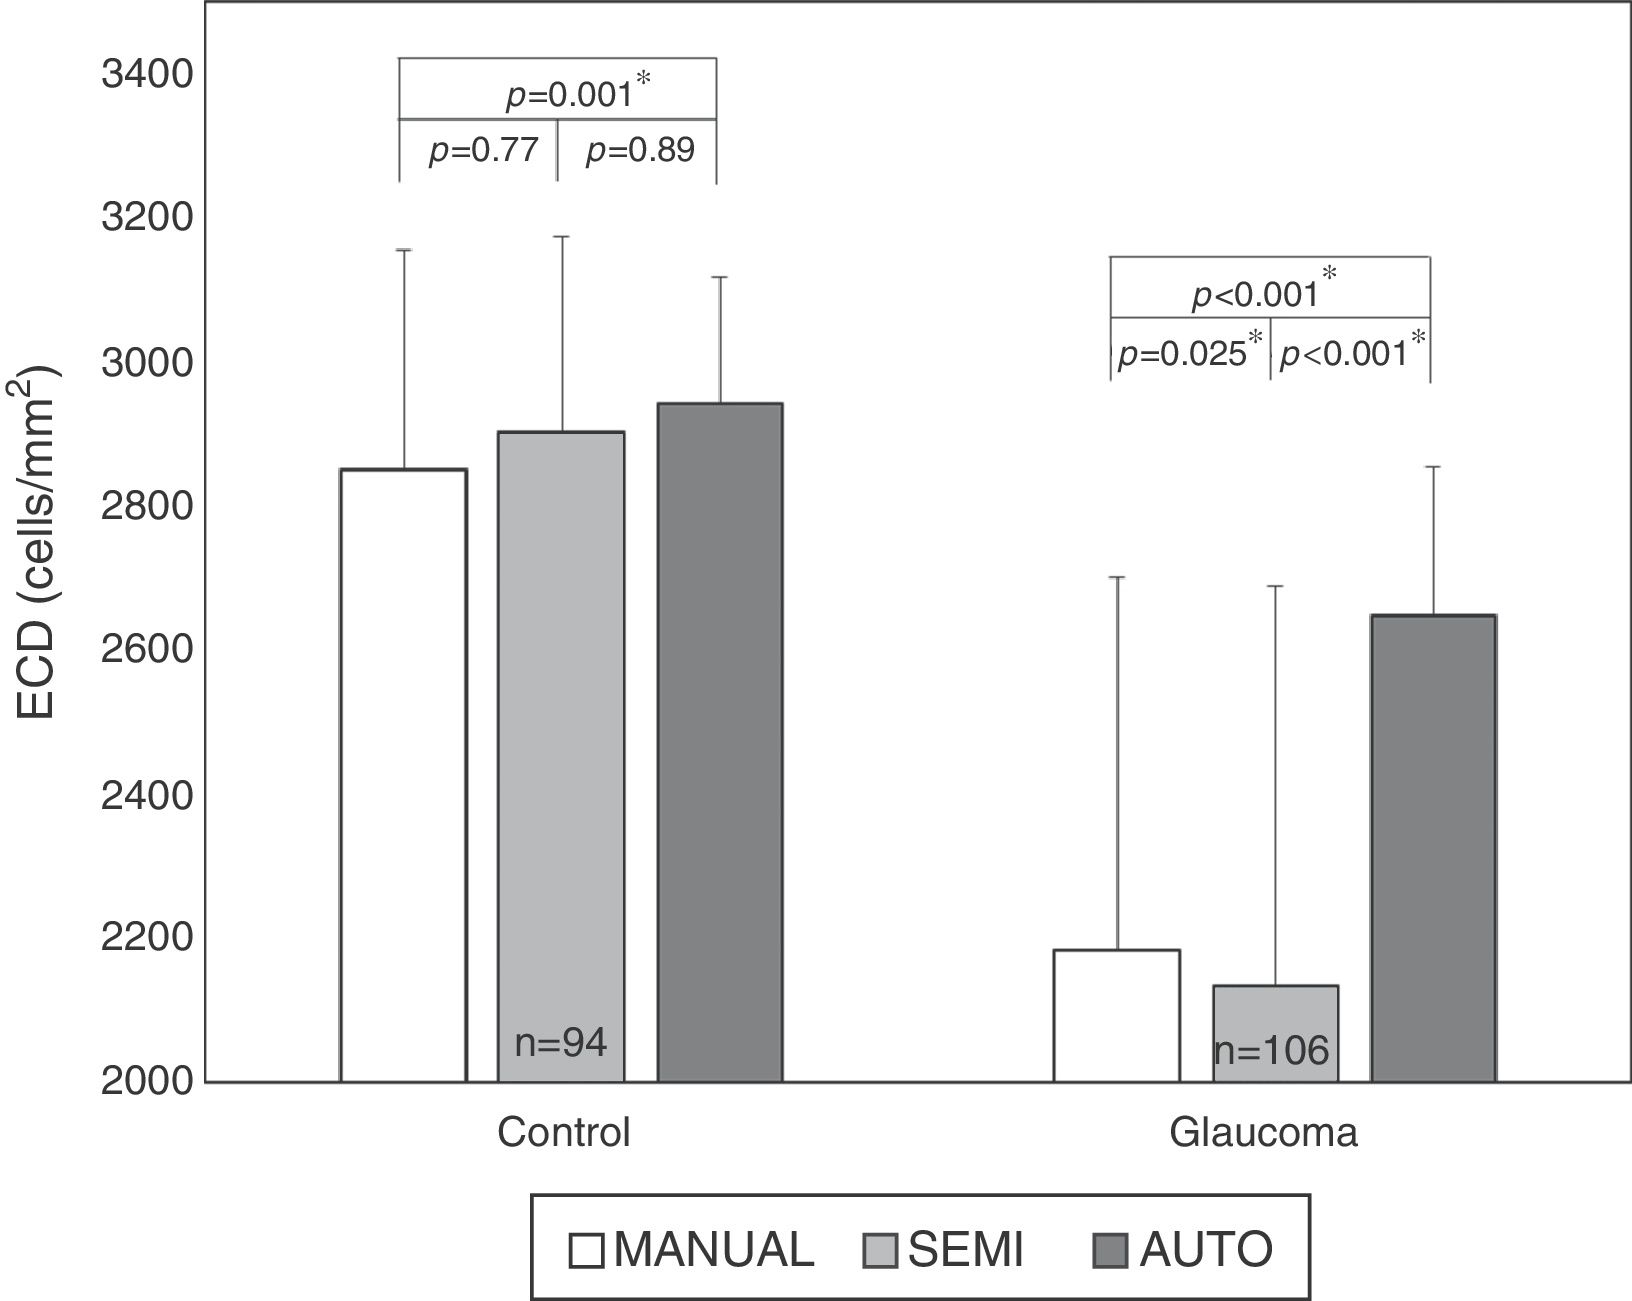
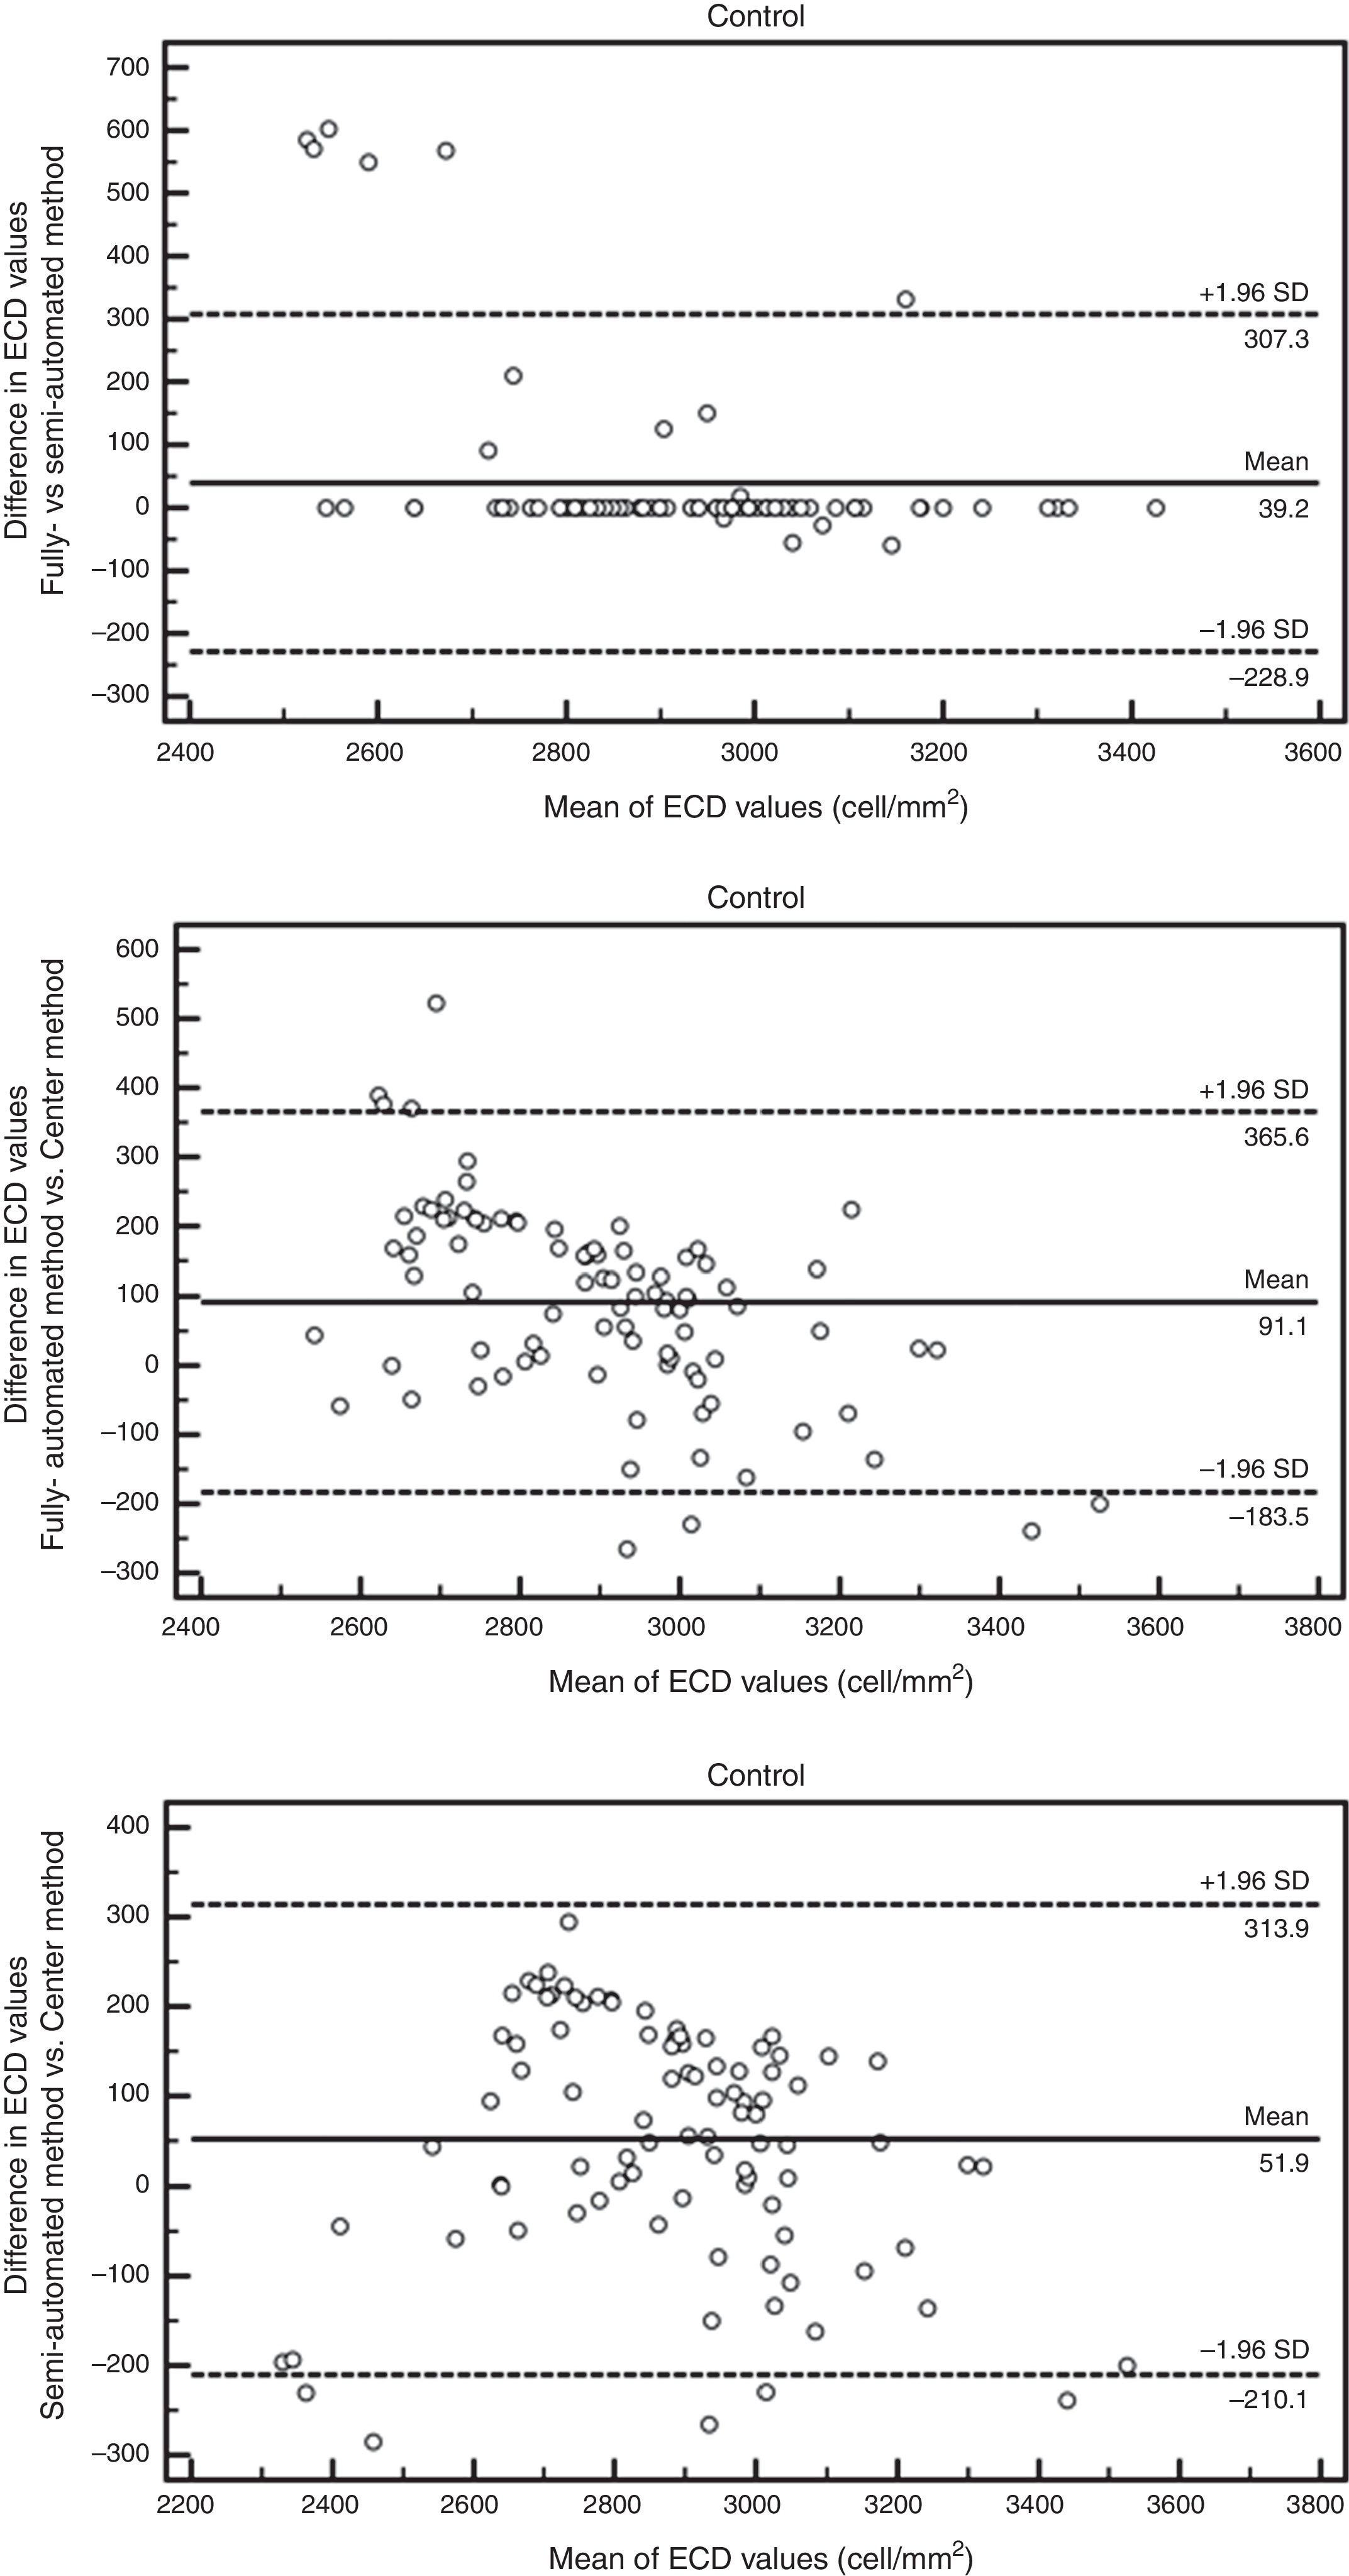
ResultsAuto trace tends to overestimate ECDIn normal subjects, 94 eyes (age 50±18 yrs, 23 males and 24 females) have sharp images. The mean ECD value obtained by fully-automatic, semi-automatic and Center Methods was 2941±176cells/mm2, 2901±273cells/mm2 and 2849±306cells/mm2, respectively. In the patients with glaucoma, 106 eyes (age 65±16 yrs, 27 males and 31 females) have sharp images, with 26 eyes having guttata. The mean ECD value of glaucomatous eyes obtained by fully-automatic, semi-automatic and Center Methods was 2647±205cells/mm2, 2133±556cells/mm2 and 2184±517cells/mm2, respectively. The difference between the manual and fully-automated methods was significant in both controls (p<0.001*) and glaucomatous eyes (p<0.001*, Fig. 1). Semi-automated analysis generated ECD values close to manual analysis in all corneas, but the difference was still significant in glaucomatous eyes (p=0.025, Fig. 1).
Larger cell size and polymegathism drive auto trace inaccuracy by manual, semi-automated (semi) and fully-automated (auto) methods in control and glaucomatous eyes.")
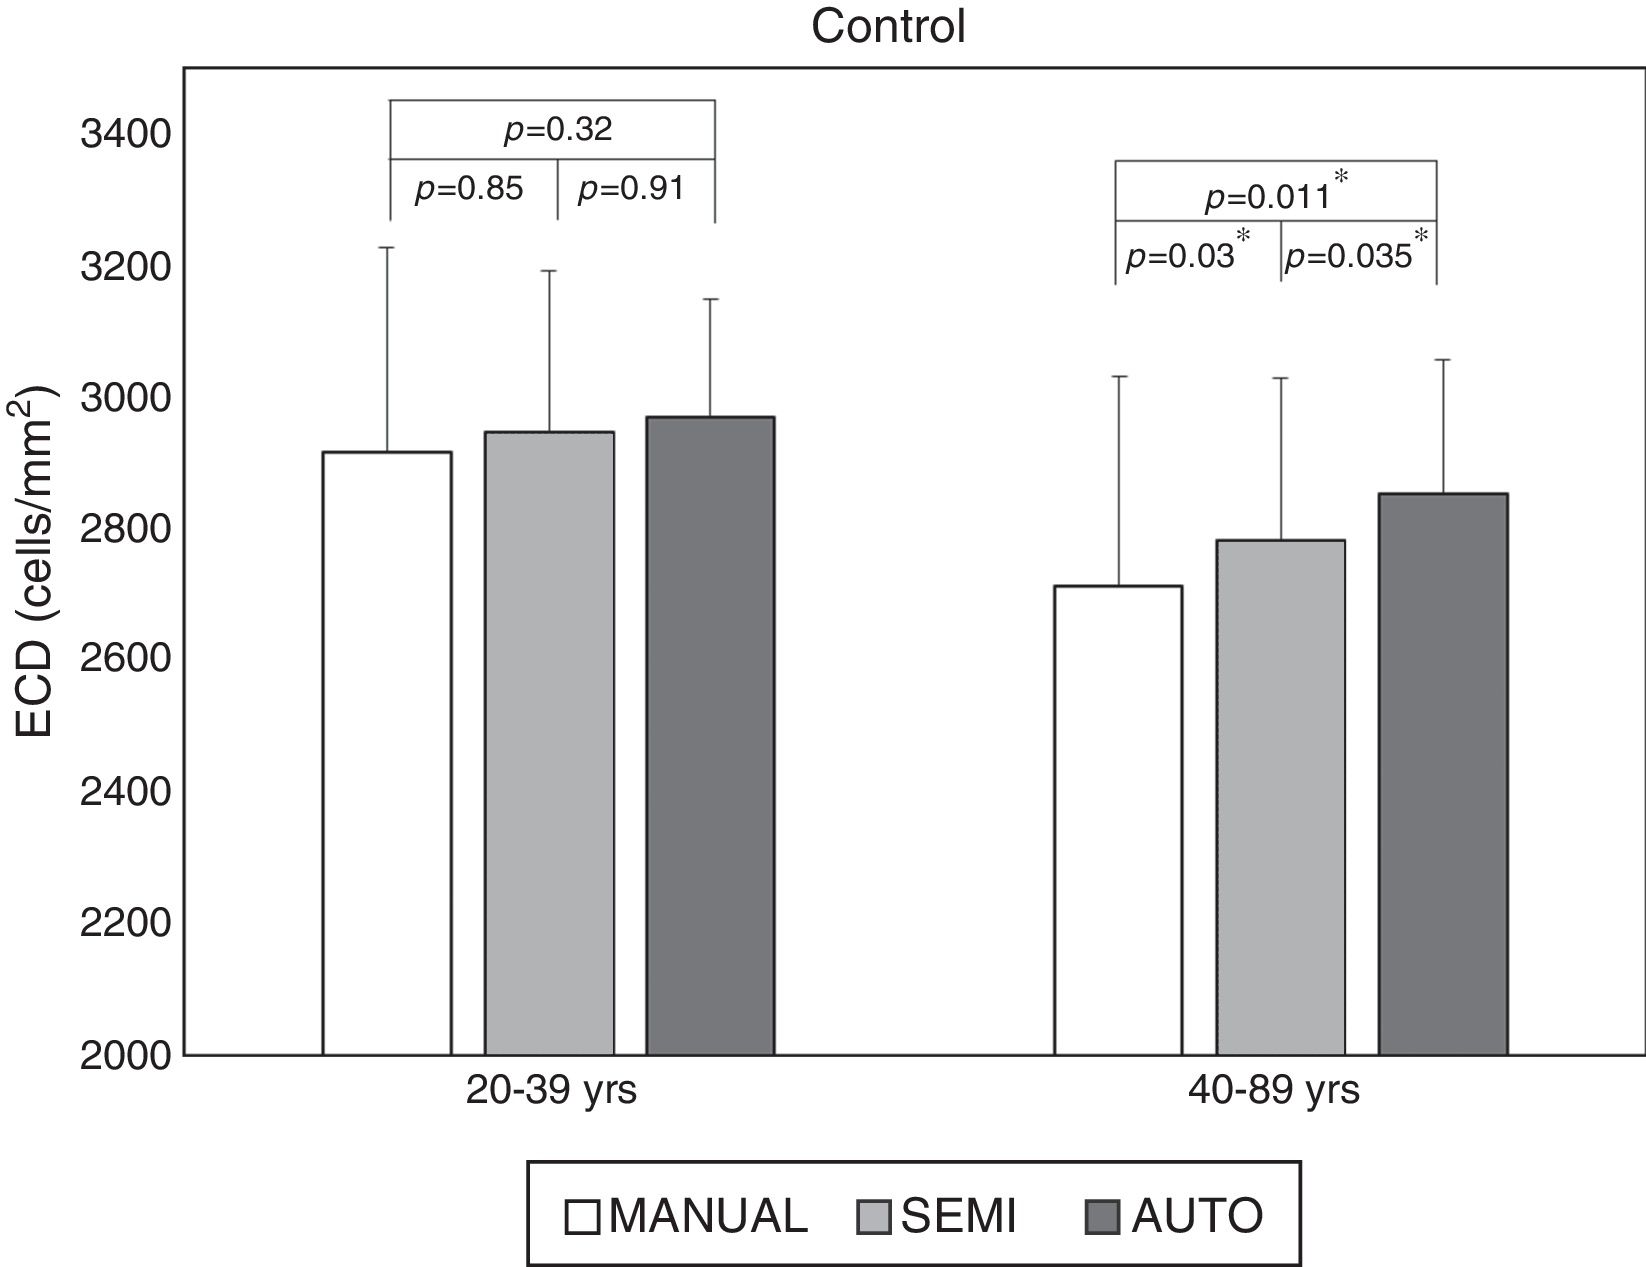
Stratification by age revealed that the ECD difference driving the significance was found in the older age groups. While the difference was still significant in all cohorts with the fully-automated option (Fig. 2), the cohorts that exhibited a statistically significant difference changed with the semi-automated option (Table 1). As shown in Fig. 2, the average ECD values for the control eyes <40 years old were 2969±180cells/mm2 by the fully-automated method, 2947±244cells/mm2 by the semi-automated method and 2916±310cells/mm2 by the Center Method (p=0.32). Meanwhile, the mean ECD values in the older controls were 2854±201cells/mm2 by the fully-automated method, 2783±246cells/mm2 by the semi-automated method and 2712±319cells/mm2 by the Center Method (p<0.05*).
 by manual, semi-automated (semi) and fully-automated (auto) methods in control’ eyes stratified by age.")
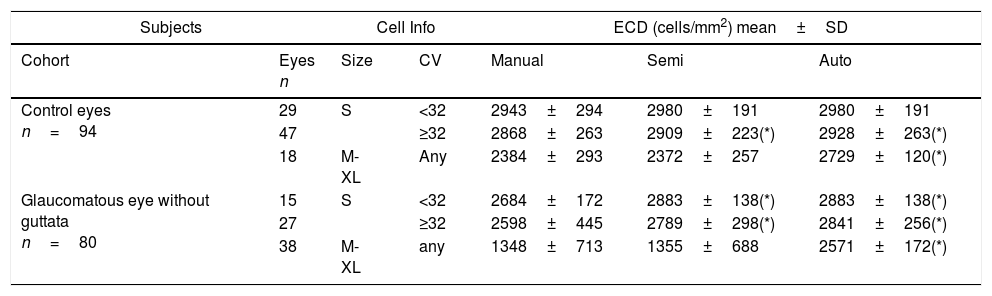
Stratification by cell size and polymegathism.
| Subjects | Cell Info | ECD (cells/mm2) mean±SD | ||||
|---|---|---|---|---|---|---|
| Cohort | Eyes n | Size | CV | Manual | Semi | Auto |
| Control eyes n=94 | 29 | S | <32 | 2943±294 | 2980±191 | 2980±191 |
| 47 | ≥32 | 2868±263 | 2909±223(*) | 2928±263(*) | ||
| 18 | M-XL | Any | 2384±293 | 2372±257 | 2729±120(*) | |
| Glaucomatous eye without guttata n=80 | 15 | S | <32 | 2684±172 | 2883±138(*) | 2883±138(*) |
| 27 | ≥32 | 2598±445 | 2789±298(*) | 2841±256(*) | ||
| 38 | M-XL | any | 1348±713 | 1355±688 | 2571±172(*) | |
ECD=endothelial cell density; SD=standard deviation; CV=coefficient of variation; *=statistical significant.
Further stratification revealed that fully-automated analysis can yield comparable ECD values in normal corneas with uniformly small cell size, 2980±191cells/mm2 in the fully-automated method, 2980±191cells/mm2 in the semi-automated method, and 2943±294cells/mm2 in the Center Method (p=0.12) (Table 1, S+CV<32). When the cells size pattern is M-XL, the ECD values obtained by the fully-automated method were higher (2729±120cells/mm2) than those obtained by the Center Method (2384±293cells/mm2) in healthy control eyes (p=0.013*), whereas the ECD values obtained by the semi-automated method (2372±257cells/mm2) showed no difference (p=0.12). Similarly, in eyes with cell size of M-XL in patients with glaucoma without guttata, the mean ECD values was 2571±172cells/mm2 by the fully-automated method (p<0.001*), 1355±688cells/mm2 by the semi-automated method (p=0.24), and 1348±713cells/mm2 by the Center Method.
While the semi-automated method can further correct ECD values in both normal and diseased eyes (Table 1, M-XL; Fig. 3A), it fails in the presence of polymegathism (Table 1, S+CV≥32); Fig. 3B). In terms of high cell size variation (CV≥32), the mean ECD value obtained by the fully-automated method (2928±263cells/mm2) was higher than that obtained by the Center Method (2868±263cells/mm2, p=0.034*). There was no significant difference from that obtained by the semi-automated method (2909±223cells/mm2, p=0.21) in control eyes <40 yrs of age, because most of the cells are of S pattern. Likewise, in the eyes of patients with glaucoma but without guttata, the mean ECD value obtained with the fully-automated method (2841±256cells/mm2) was higher than that obtained with the Center Method (2598±445cells/mm2, p=0.034*) and there was no difference when compared to the semi-automated method (2789±298cells/mm2, p=0.37).
![(A) Representative sample cornea with larger cell size and low cell size variation (CV<32), before (ungraded) and after fully-automated, semi-automated or manual grading. Endothelial cell density (ECD) error between manual methods is 1.4%. Compared to mean manual ECD, error with automated methods is reduced from 231% with the fully-automated method to 4.4% with the semi-automated method by the grader's manual correction of cell size (from “S”, as the default cell size with the fully-automated method, to “XL” selected in semi-automated method). (B) Representative sample cornea with polymegathism (CV≥32) before (ungraded) and after automated or manual grading. Note how, with polymegathism, no single cell size option from the automated method accurately approximates the manual endothelial cell density (ECD) value [error ranging from 16.2% (M) to 43.7% (S) to 43.5% (L)]. + This is NOT the manufacturer's recommended practice for the given cornea.](https://static.elsevier.es/multimedia/18884296/0000001100000003/v1_201807020402/S1888429617300493/v1_201807020402/en/main.assets/gr3.jpeg?xkr=ue/ImdikoIMrsJoerZ+w93meMsSv3kCFu9ka1kgzl/xrK32s3f4YRcWD6Dd7AXarmbVDJ09DfQV0TB/3H2+XgLqJxRrgYdK7wcioxLyyLLRlEPard8J7+t8N4wF6600TBZjOhaznVayFOCruZBu32iKOTml0YX3WDjjozQynJ8UhjpvlCs4lgcuojHmjqXwr+EKNYcsUwSV13fYlgqUEIwCbQgjtOshgpDxZ1f67B7FI88MTCCq1fbu/7HZn/+faqe0dtcqFS+HpwbuPTgQBJ4W7fA70uR5Igph2ndNRpo0= "(A) Representative sample cornea with larger cell size and low cell size variation (CV<32), before (ungraded) and after fully-automated, semi-automated or manual grading. Endothelial cell density (ECD) error between manual methods is 1.4%. Compared to mean manual ECD, error with automated methods is reduced from 231% with the fully-automated method to 4.4% with the semi-automated method by the grader's manual correction of cell size (from “S”, as the default cell size with the fully-automated method, to “XL” selected in semi-automated method). (B) Representative sample cornea with polymegathism (CV≥32) before (ungraded) and after automated or manual grading. Note how, with polymegathism, no single cell size option from the automated method accurately approximates the manual endothelial cell density (ECD) value [error ranging from 16.2% (M) to 43.7% (S) to 43.5% (L)]. + This is NOT the manufacturer's recommended practice for the given cornea.")
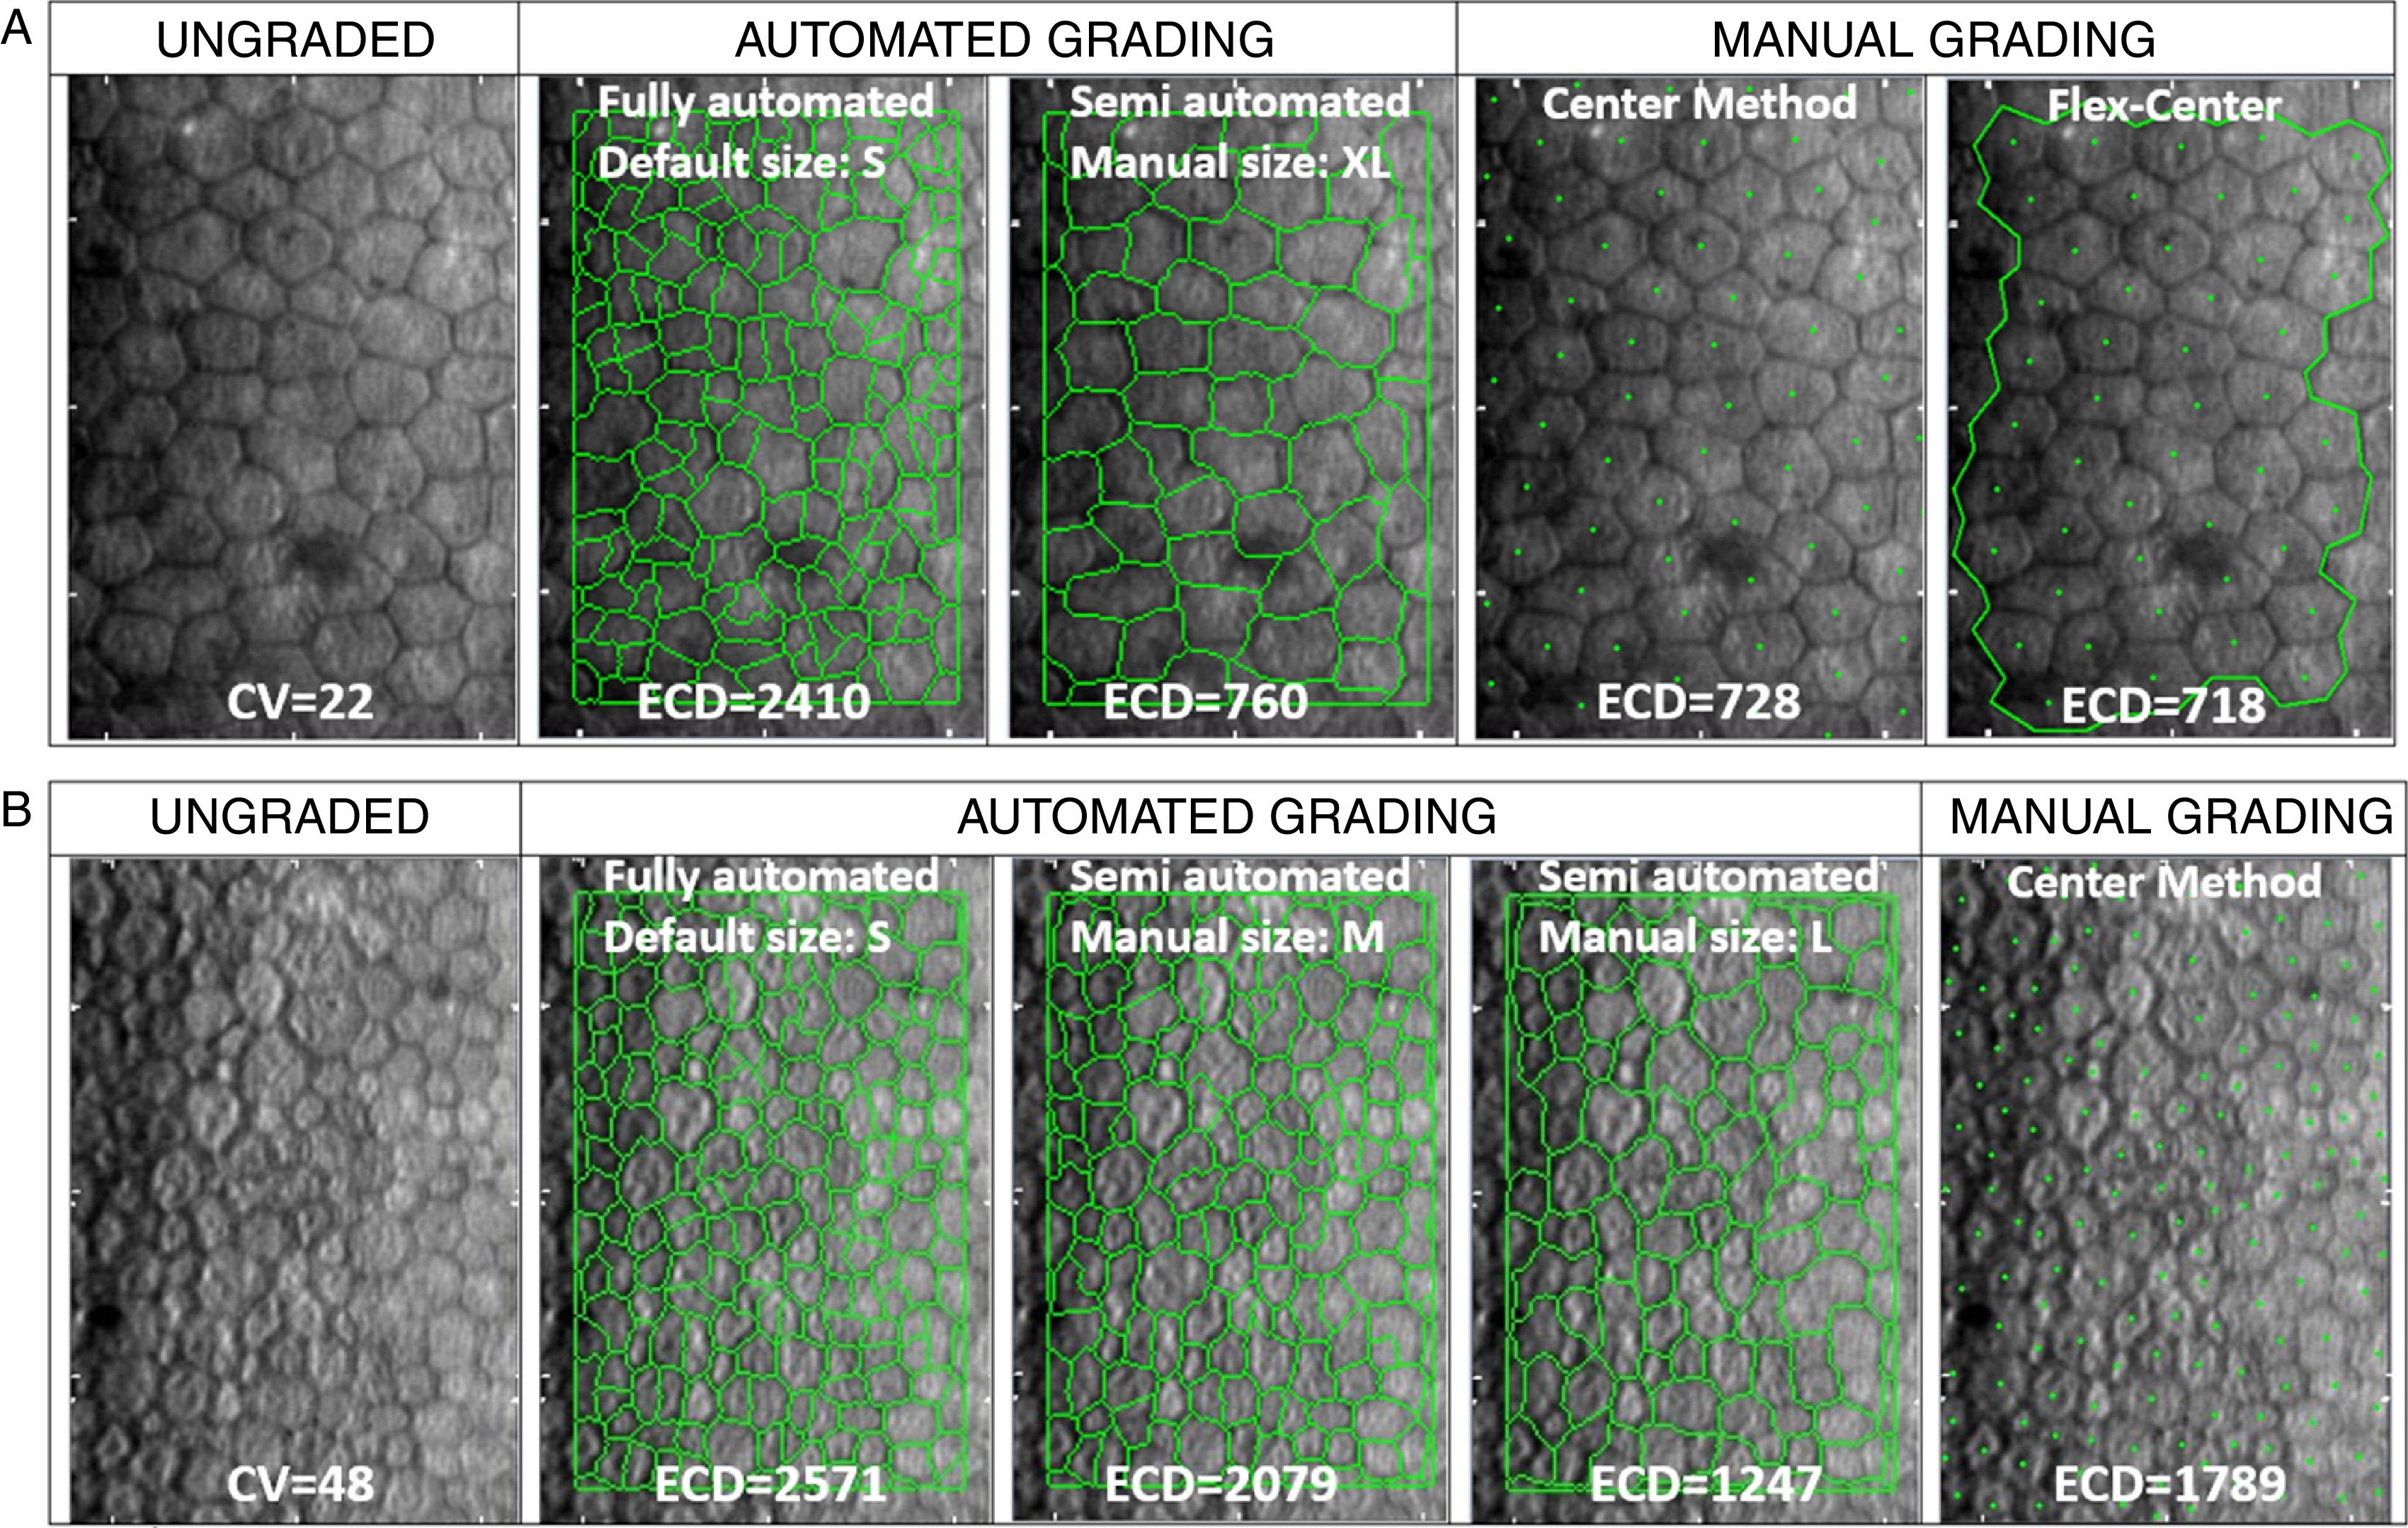
(A) Representative sample cornea with larger cell size and low cell size variation (CV<32), before (ungraded) and after fully-automated, semi-automated or manual grading. Endothelial cell density (ECD) error between manual methods is 1.4%. Compared to mean manual ECD, error with automated methods is reduced from 231% with the fully-automated method to 4.4% with the semi-automated method by the grader's manual correction of cell size (from “S”, as the default cell size with the fully-automated method, to “XL” selected in semi-automated method). (B) Representative sample cornea with polymegathism (CV≥32) before (ungraded) and after automated or manual grading. Note how, with polymegathism, no single cell size option from the automated method accurately approximates the manual endothelial cell density (ECD) value [error ranging from 16.2% (M) to 43.7% (S) to 43.5% (L)].
+ This is NOT the manufacturer's recommended practice for the given cornea.
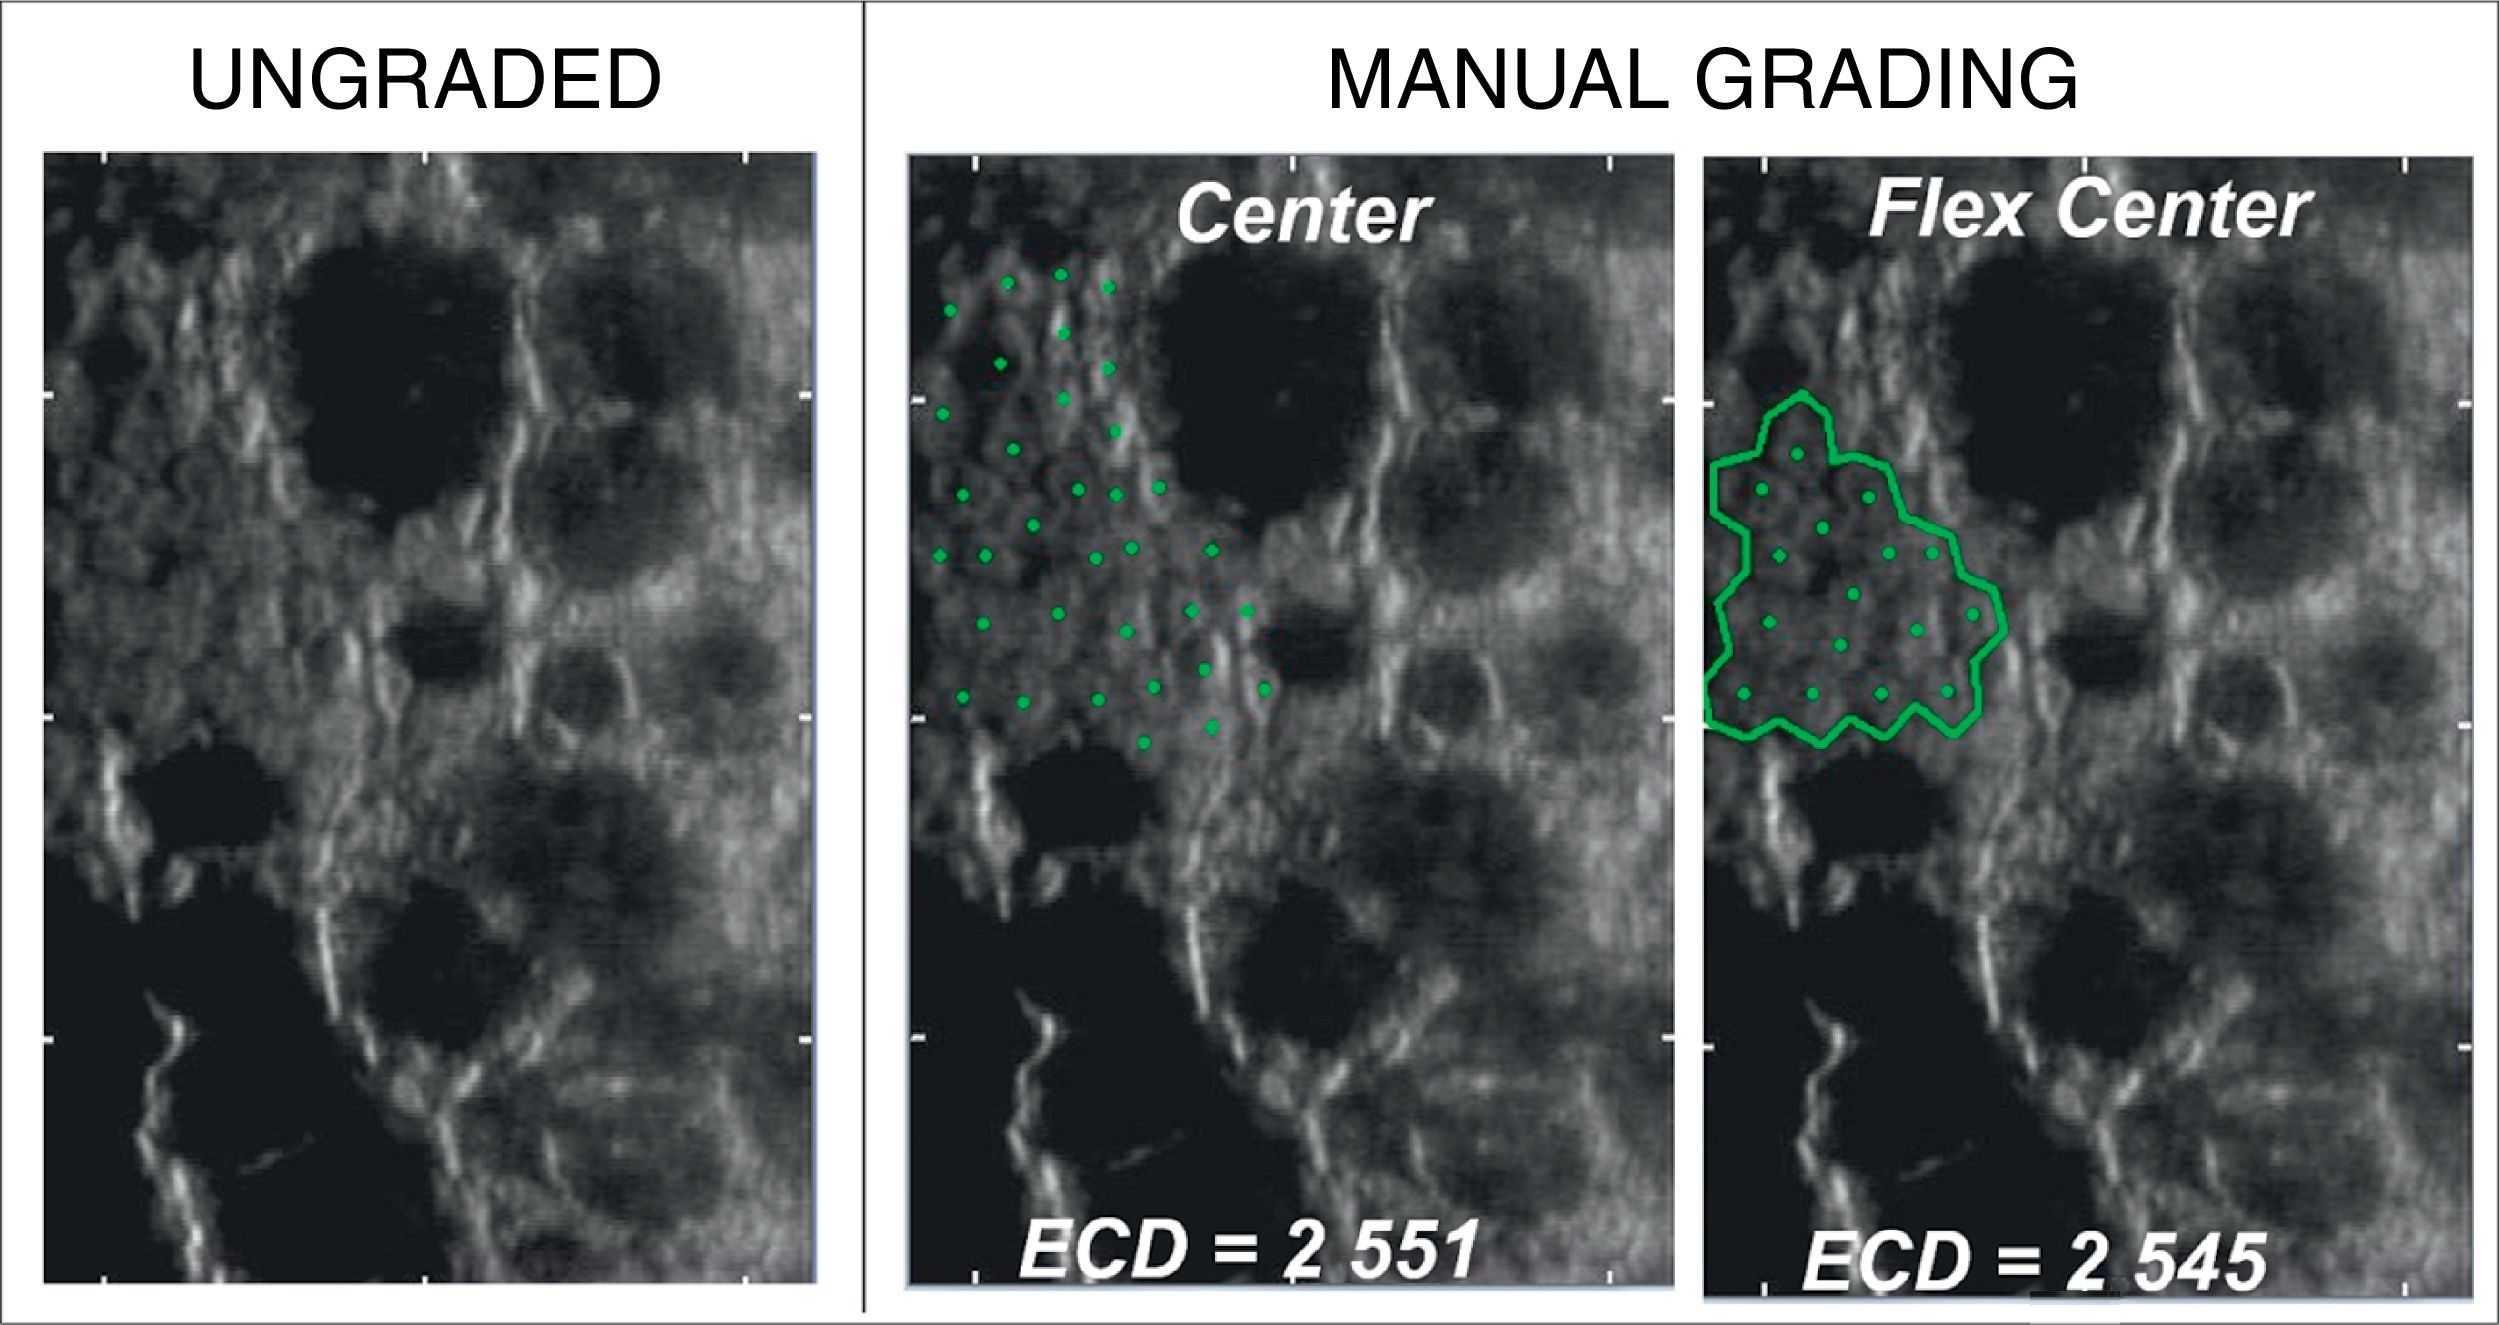
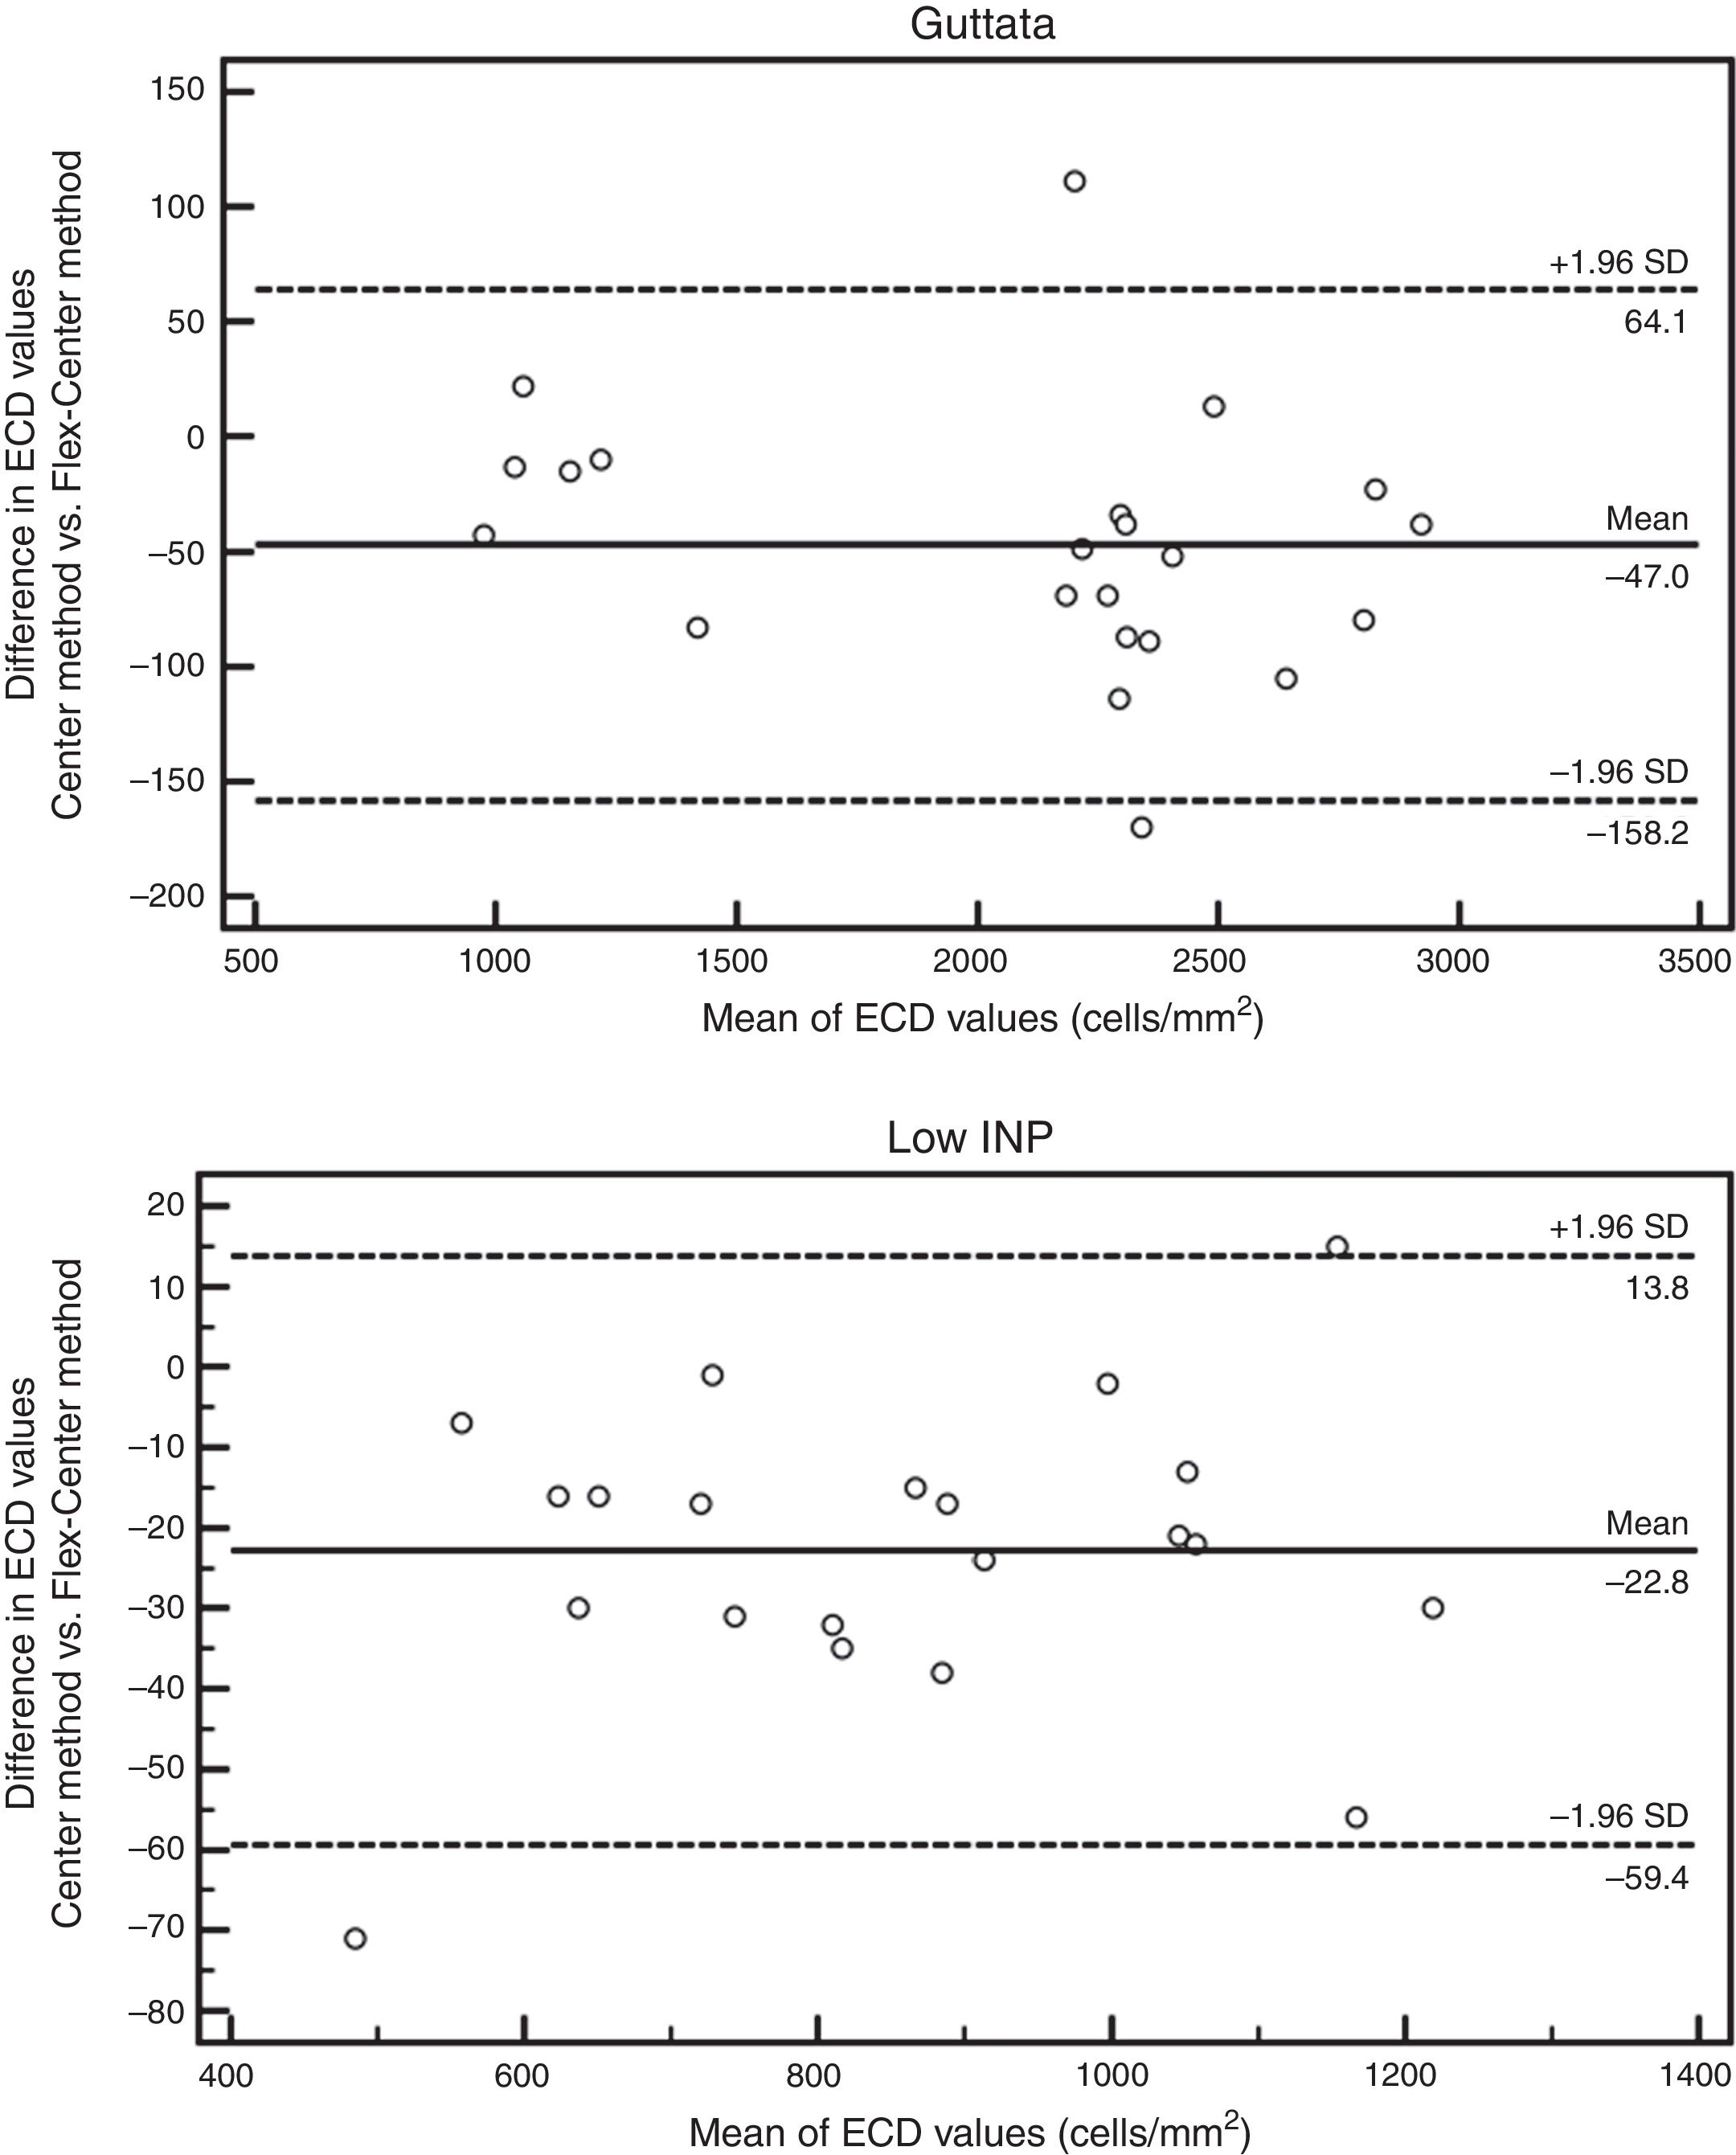
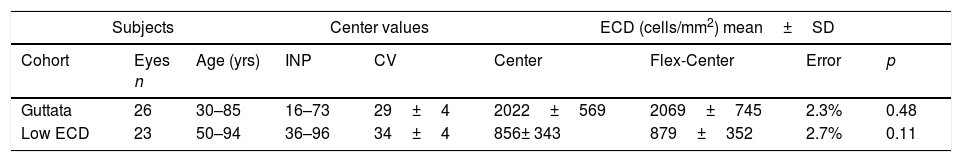
No significant difference was observed between the results obtained by manual Center and Flex-Center Methods in all analyzed corneas with an INP value of less than 100. In the corneas with presence of guttata, which reduced the INP value to 16–73 cells, the mean ECD value was 2022±569cells/mm2 by Center Method and 2069±745cells/mm2 by Flex-Center Method (p=0.48). Fig. 4 showed a sample image obtained in both Center and Flex-Center Methods in severe guttata, resulting in less than 40cells countable. Even in corneas with low ECD, when only 36–96 cells were countable, the mean ECD value obtained by the Center Method was 856±343cells/mm2 and that obtained by the Flex-Center Method was 879±352cells/mm2 (p=0.11). (Table 2; Fig. 3A).
 resulting in a drastically low number of gradable cells (INP<100) graded by different manual methods.")
Mean endothelial cell density by Center and Flex-Center Methods in eyes with low cell count.
| Subjects | Center values | ECD (cells/mm2) mean±SD | ||||||
|---|---|---|---|---|---|---|---|---|
| Cohort | Eyes n | Age (yrs) | INP | CV | Center | Flex-Center | Error | p |
| Guttata | 26 | 30–85 | 16–73 | 29±4 | 2022±569 | 2069±745 | 2.3% | 0.48 |
| Low ECD | 23 | 50–94 | 36–96 | 34±4 | 856± 343 | 879±352 | 2.7% | 0.11 |
ECD=endothelial cell density; SD: standard deviation; INP=input number; CV=coefficient of variation.
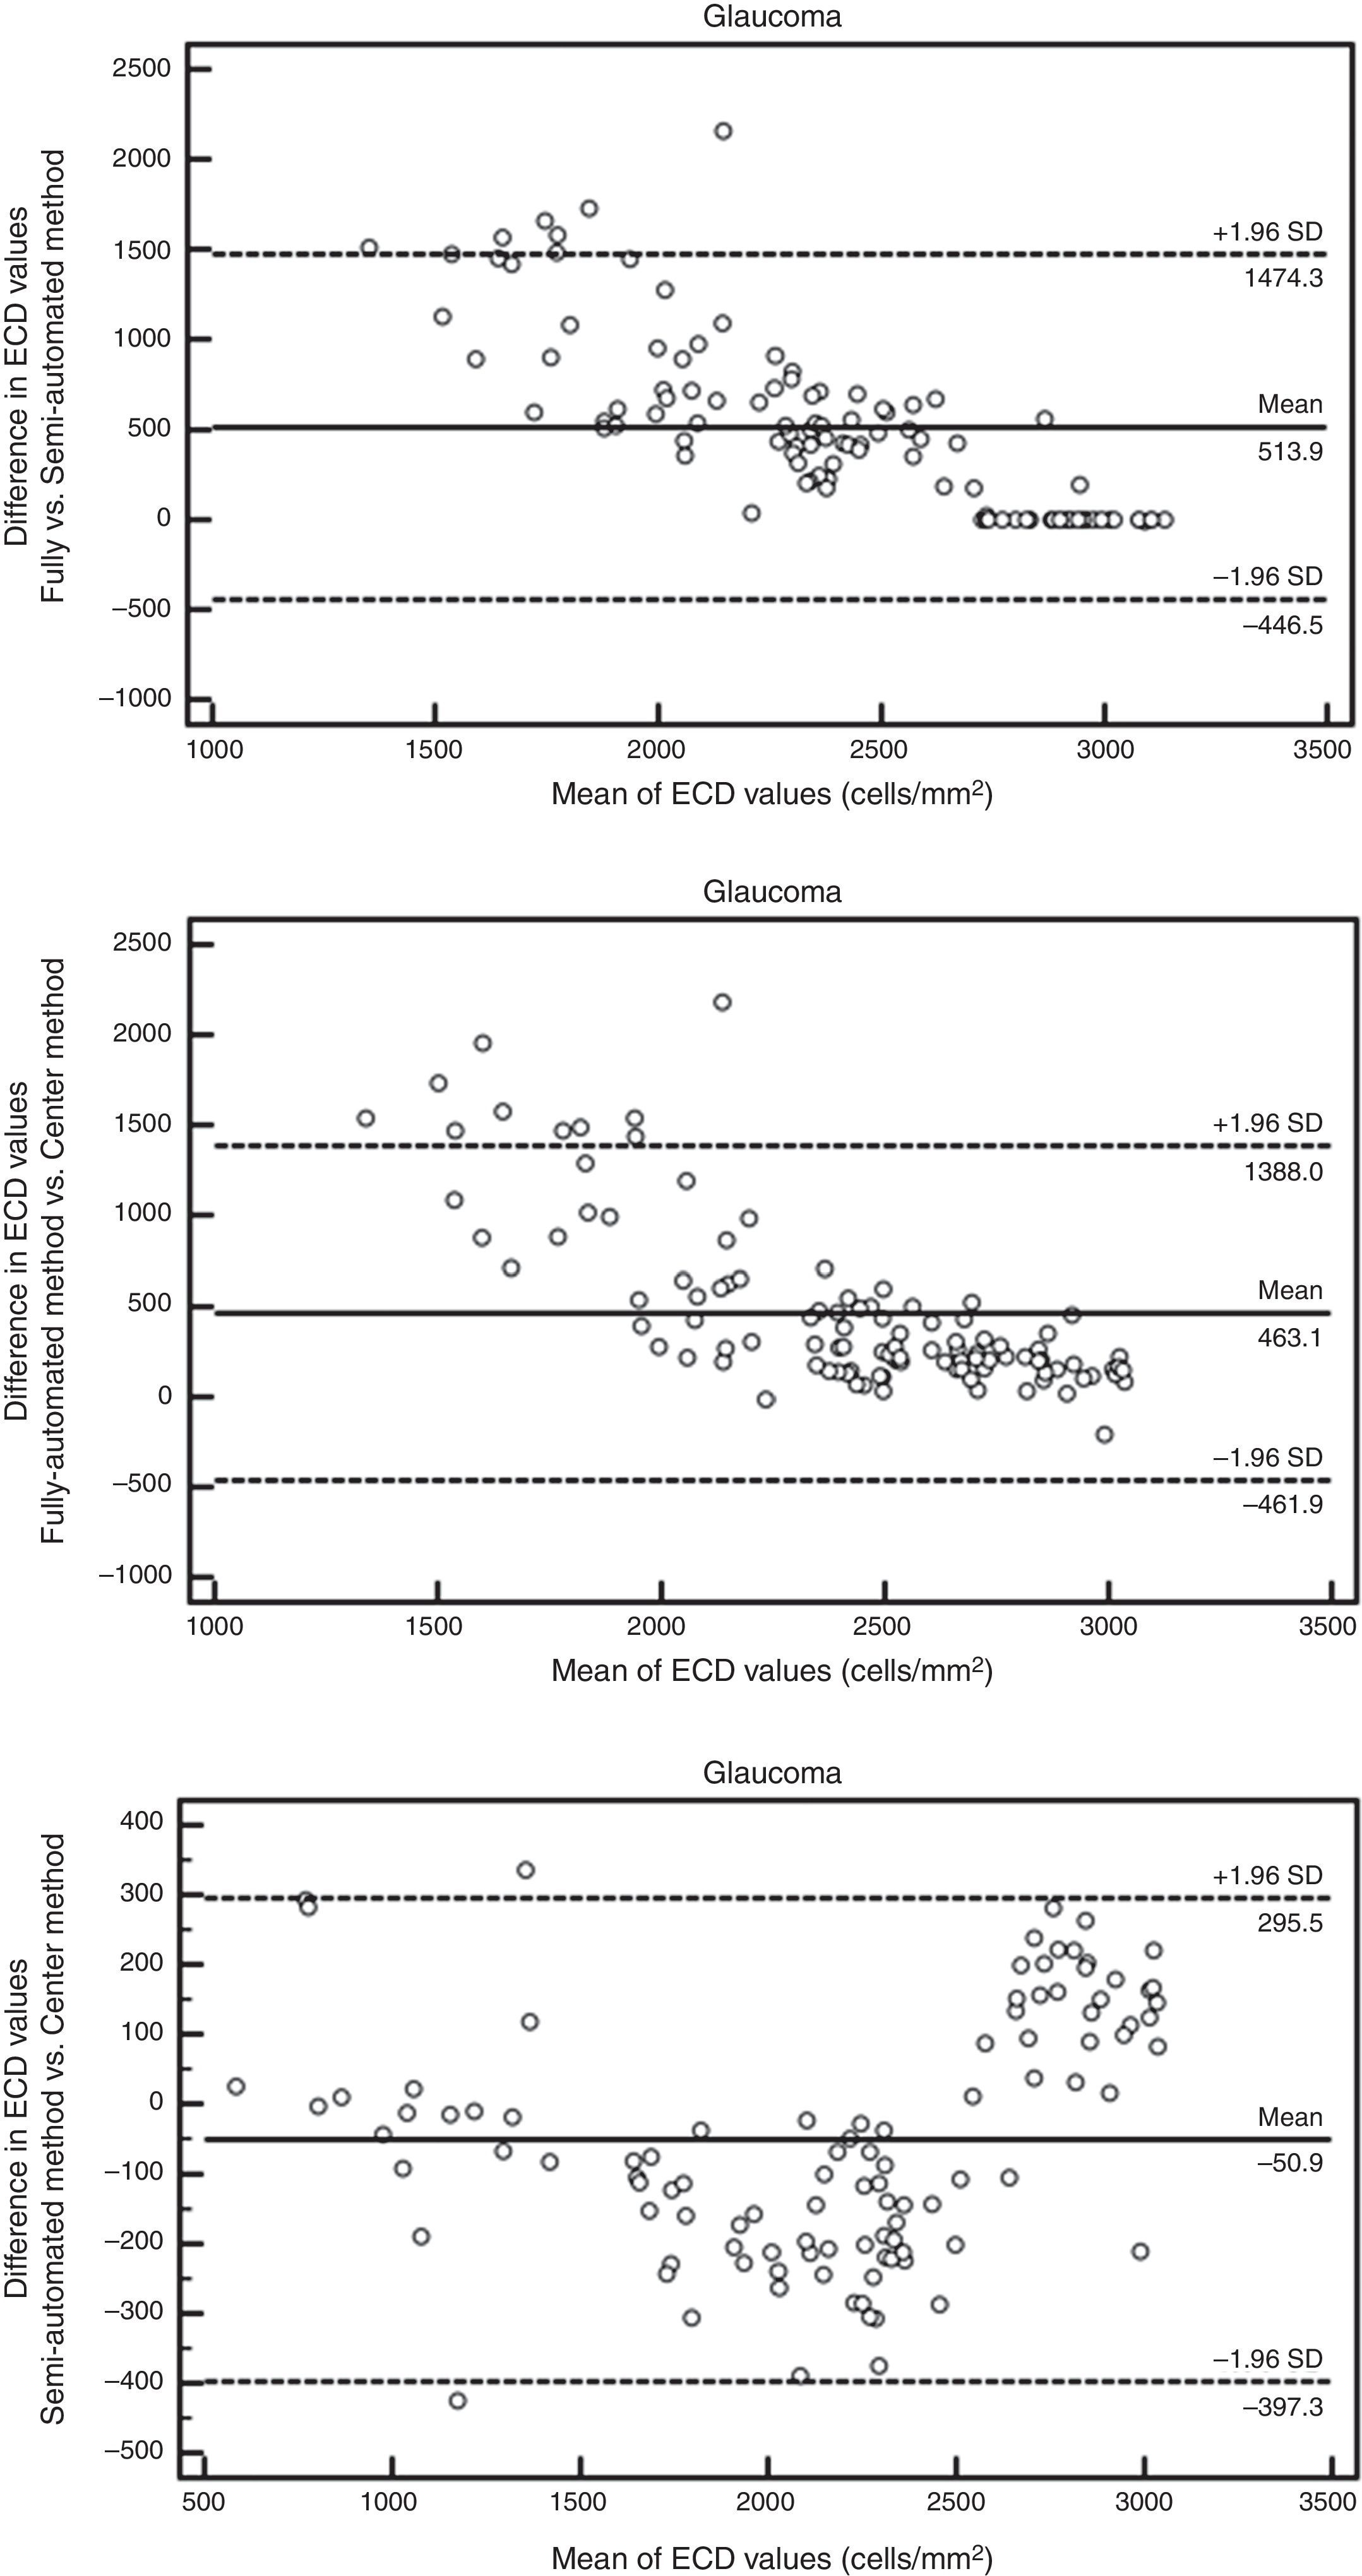
The Bland–Altman analysis showed differences in ECD evaluation by using different analysis methods in all corneas. The difference in ECD values between different analysis methods was low in normal controls, but high in glaucomatous eyes. In control eyes, ECD values determined by the fully-automated method tended to be 39cells/mm2 higher than those determined by the semi-automated method and 91cells/mm2 higher than those obtained by the Center Method; ECD values obtained by semi-automated method were 52cells/mm2 higher than those obtained by the Center Method (Fig. 5). In glaucomatous eyes, the ECD values determined by fully-automated method tended to be 514cells/mm2 higher than those determined by the semi-automated method and 463cells/mm2 higher than those obtained by the Center Method; ECD values obtained by semi-automated method were 51cells/mm2 lower than those obtained by the Center Method (Fig. 6). The mean difference of ECD values derived by Center Method was lower than those obtained by the Flex-Center Method, 47cells/mm2 lower in corneas with guttata and 23cells/mm2 lower in corneas with low INP (Fig. 7).


Endothelial cell density assessment is essential for accurate clinical assessment of endothelial health, following patients after keratoplasty, as well as for clinical trials to document endothelial safety. It is important to know which analysis method is appropriate and reliable for use.
Clinical trials typically use Konan CellChek software for ECD analysis. Herein we studied 4 methods, comparing the fully-automatic, semi-automatic, Center and Flex-Center Methods in normal and glaucomatous eyes. We found that comparable ECD values can be obtained with either the Center or Flex-Center Method when fewer than 100 cells are analyzed. Automated analysis tends to overestimate ECD in both control and diseased eyes. The semi-automated option can compensate for this in eyes with larger cell size. Of the parameters tested, larger cell size and polymegathism are the major factors limiting ECD accuracy in automated analysis.
Based on our findings, the fully-automated method is not reliable because of its poor agreement with other methods, with the exception of younger normal corneas with uniformly small cell size. The Bland–Altman analysis showed the ECD obtained by fully-automated method was much higher than those obtained by both semi-automated and Center Methods in glaucomatous eyes, therefore the fully-automated method cannot be used interchangeably with semi-automated and Center Method in disease eyes. Many studies have shown that the results of automated analysis programs did not match those of manual and semi-automated analysis methods.7,15–18 With automated analysis, the software independently recognizes cell borders and then makes calculations based on the identified cells and their areas. The fully-automated method has a default setting of S cell size, which is not appropriate in corneas with lower ECDs and therefore larger cells. When the cell size matched the M- and L-pattern, the default setting would misidentify the cells as being smaller than they were and overestimate the ECD. Similar results were reported by Price et al.6 when the manual and automated endothelial cell density analysis in normal eyes and eyes that had undergone Descemet's Stripping Endothelial Keratoplasty was compared with using the Konan Noncon Robo Sp-8800 specular microscope.
The semi-automated method allows the grader to use his or her judgment in selecting the pattern that matches the majority of the cells, which helps the computer to appropriately identify the endothelial cell borders and generate a more reliable ECD value than the fully-automated method does. However, in those eyes with high polymegathism, it is difficult to determine what size to select, because cells sizes within the same frame could vary from S to XL. In such cases, the Center Method should be used to identify the cell centers regardless of their cell size. This method has been approved by the FDA for use in clinical trials to generate reliable ECD data. Price et al.19 also used the Konan Center Method for ECD measurement to assess 5-year graft survival after Descemet's Stripping Endothelial Keratoplasty and to determine endothelial cell loss in the surviving grafts. The Flex-Center Method allows the gradable area to be defined by selecting cell borders and maximizing the NUM value by passing the Center Method's requirement of counting cells within a box-shaped contiguous area. However, the Flex-Center Method is more time-consuming, and there is a potential extra source of error in defining borders. Patel et al. reported the Flex-Center Method could be used interchangeably with the Center Method when measuring ECD in 10 normal corneas and 10 corneas after penetrating keratoplasty.20 They suggested the Flex-Center Method is good for assessing corneas with high endothelial cell loss over time, such as transplanted corneas. Villalba et al.,21 used Flex-Center Method versus Center Method for endothelial corneal evaluation in eye banking. In the 67 corneas they studied, they found there were differences in NUM values between the Center and Flex-Center Methods. However, there were no differences in the ECD, CV and HEX between the two methods. Similarly, in our study, the Bland–Altman analysis showed lower difference in ECD values between Center and Flex-Center Methods, suggesting that the two methods can be used interchangeably in corneas with guttata or low INP. For assessment of corneas with guttata, only the local ECD was assessed, not the effective ECD. The local ECD was calculated by the number of contiguous clear cells divided by the counting area of the cells. In Center Method, the area occupied by each cell is derived based on the distance between the center of a cell and the center of all its each neighbors. This means, the outer-most border of cells dotted by the grader is not counted toward the “NUM value (number of cells analyzed)”, which the computer uses to calculate the cell density. In the Flex-Center Method the outer border of the grading area must be drawn first, so all the cell counted are intact. Without using partial profiles of cells to estimate the ECD, the error was eliminated. On the contrary, the error may increase by estimating the local cell density of the image with guttae if the partial cells were included.22,23
One potential limitation of this study was that only 23 cases had an INP of less than 100. Further study is needed to determine the minimum INP that requires use of the Flex-Center Method. A second limitation was that the inter- and intra-grader reproducibility of each method was not compared. Nevertheless, the Konan Center Method has been reported to be a reliable way to analyze ECD and has been used as gold standard for clinical trials.24
In summary, the use of the fully-automated method alone is discouraged. With the exception of corneas from young normal controls, the automated specular analysis yields overestimated ECD values. For improved accuracy, the semi-automated method with manual cell size selection may be considered in corneas with uniformly larger cell size. However, manual determination of ECD by either Center or Flex-Center Method represent the most accurate analysis by specular microscopy and is highly recommended for eyes with polymegathism and guttata.
Declaration of interestsThe authors alone are responsible for the content and writing of the paper. No commercial relationship existed in the form of financial support or personal financial interest for any author.
Conflicts of interestThe authors report no conflicts of interest.


