

To analyze the relationship between the central corneal thickness (CCT) and mid-peripheral corneal thickness (PCT) with the degree of myopia [axial length (AL) and spherical equivalent refractive error (SE)].
Methods175 right myopic eyes from 175 patients were divided according to the degree of SE: group #1 (n=76, <6.00D), group #2 (n=72, between 6.00 and 12.00D) and group #3 (n=27, >12.00D). The CCT and PCT (3mm from the apex to the superior, inferior, nasal and temporal locations) were measured with the Orbscan-II. Relative peripheral index (RPI) was calculated by dividing the PCT by the CCT. The AL was measured with the IOL Master, and the SE was obtained with subjective refraction.
ResultsAL was 25.18±1.16mm, 26.59±1.26mm and 29.45±2.58mm and SE was −3.31±1.40D, −8.32±1.64D and −16.44±4.48D for groups #1, #2 and #3, respectively. Non-statistically significant differences in central and peripheral corneal thickness were found between groups (P>0.05 ANOVA). Non-significant relationship was found between central and peripheral corneal thickness with the AL and SE in the three study groups and in the total sample (r<0.24; P>0.05). The RPI values were similar between groups without significant difference between groups (P>0.05 ANOVA). Linear relationship was found between RPI superior location in group #2 (r=−0.23; P=0.04) and RPI nasal location in group #3 with the EE (r=0.41; P=0.03).
ConclusionThere are no significant differences among low, moderate and extremely myopic eyes related to the CCT and PCT. Corneal thickness is very similar in myopic eyes with small differences that are not clinically relevant to myopic patient management.
Analizar la relación entre el espesor corneal central (ECC) y el espesor corneal periférico (ECP) con el grado de miopía [longitud axial (LA) y equivalente esférico de la refracción (EE)].
MétodosSe agrupó a 175 ojos derechos miópicos de 175 pacientes, de acuerdo al grado de EE: grupo #1 (n=76, <6,00 D), grupo #2 (n=72, entre 6,00 y 12,00 D) y grupo #3 (n=27, >12,00 D). Se midieron el ECC y el ECP (3mm desde el ápex a las localizaciones superior, inferior, nasal y temporal) con Orbscan-II. Se calculó el índice periférico relativo (IPR) dividiendo el ECP por el ECC. La LA se midió utilizando el IOL Master, y se obtuvo el EE mediante refracción subjetiva.
ResultadosLa LA fue de 25,18±1,16mm, 26,59±1,26mm y 29,45±2.58mm y el EE fue de -3,31±1,40 D, -8,32±1,64 D y -16,44±4,48 D para los grupos #1, #2 y #3, respectivamente. Se hallaron diferencias no estadísticamente significativas en cuanto a espesor central y periférico corneal entre los grupos (P>0,05 ANOVA). Se halló una relación no significativa entre el espesor central y periférico corneal y la LA y EE en los tres grupos de estudio y en la muestra total (r<0,24; P>0,05). Los valores del IPR fueron similares entre los grupos, sin diferencia significativa entre ellos (P>0,05 ANOVA). Se halló una relación lineal entre la localización superior del IPR del grupo #2 (r=−0,23; P=0,04) y la localización nasal del IPR en el grupo #3 con EE (r=0,41; P=0,03).
ConclusiónNo existen diferencias significativas entre los ojos con miopía baja, moderada y extrema en cuanto a ECC y ECP. El espesor corneal es muy similar en ojos miópicos, con pequeñas diferencias que no son clínicamente relevantes para el tratamiento de los pacientes con miopía.
Corneal thickness is an important indicator of corneal health. Its alteration may be indicative of different pathologies,1 so in clinical practice it is of great importance to obtain the most reliable corneal pachymetry value for each patient. Corneal thickness is also implicated in the measurement of intraocular pressure (IOP) or when planning corneal refractive surgery (this value influences the final decision as to whether surgery is necessary, the selection of a particular surgical procedure, issues related to follow-up or the rate of postoperative complications).2,3 Factors influencing the thickness of the corneal pachymetry include the time of day, patient age, the use of contact lenses or the presence of any corneal degeneration.4 The influence of refractive error on corneal thickness has not yet been clearly established.5–7
Myopia is one of the most common eye disorders worldwide. It affects around 25% of the population in the West and over 80% in some Asian regions.8 Changes related to myopic eyes include elongated axial length (AL) and stretching of the retina, choroid and sclera.9 Some studies concluded that eyes with myopia have more flattened corneas, deeper anterior chambers and major white-to-white corneal diameters when compared with low-myopic, emmetropic and hyperopic eyes.10,11
Although numerous studies10–15 have related the central corneal thickness (CCT) with the degree of myopia, none of these studies have considered the mid-peripheral corneal thickness (PCT) in highly myopic eyes. However, the results of these studies are controversial. Some found that myopic subjects have a thicker CCT,12 others a thinner CCT,7,13 while yet others found no correlation between CCT and myopia.10,11,14,15 These controversial results concerning the relationship between high myopia and the CCT is controversial, requiring further study to clarify the topic.
Hence, the main objective of this study is to evaluate corneal thickness in both the center and the mid-periphery of the cornea in a sample of myopic eyes and to correlate these findings with the refractive error, expressed with the spherical equivalent (SE) and with the AL.
MethodsSubjectsIn total, 175 right eyes from 175 myopic subjects were enrolled in the study. There were 107 women and 68 men; the mean age was 36.4±9.3 years (ranging from 18 to 67 years). The SE of the refractive error ranged from −0.50D to −26.00D (−6.96±4.90D). Contact lens use was discontinued for at least 15 days prior to data collection.
Subjects were excluded if they had an active ocular-surface disease such as significant dry eye, corneal opacities, glaucoma, current medication that could affect ocular physiology, astigmatism >2.00 D, any type of corneal dystrophy such us keratoconus or if they had undergone any kind of ocular surgery. Informed consent was obtained from each subject after approval was granted by the Human Sciences Ethics Committee of the University of Valladolid. All subjects were treated in accordance with the Declaration of Helsinki.
InstrumentationThe CCT and PCT were measured with the Orbscan II (Bausch & Lomb, Rochester, NY, version 3.12). The procedure involving the Orbscan II has previously been described.16,17 This device uses an algorithm that involves multiplying corneal thickness by an acoustic factor of 0.92. Corneal pachymetry was measured in five different corneal locations: at the center and at the superior, inferior, nasal and temporal (at 3mm from the apex) corneal positions. An experimenter and blinded operator performed all the Orbscan measurements.
The relative peripheral index (RPI)18 was calculated by dividing the PCT by the CCT. This index expresses the rate of thickening of the cornea from the center to the periphery.
The eyeball AL was assessed with the IOL Master (Carl Zeiss Meditec, Jena, Germany) using non-contact partial coherence laser interferometry.19,20
The spherical equivalent (SE) was calculated as the sum of the sphere and half the refractive astigmatism in dioptres (D) obtained after standard monocular subjective refraction (maximum positive lens that provides the best visual acuity).
Data analysisData were analyzed using the statistical package SPSS version 14.0 (SPSS Inc., Chicago, IL, USA). A normal distribution of variables was assessed using the Kolmogorov–Smirnov test. Three study groups were established based on the value of the SE; group #1=low myopic eyes under 6.00 D, group #2=moderately myopic eyes with prescriptions ranging from 6.00 to 12.00 D and group #3=extremely myopic eyes above 12.00 D.
The CCT and PCT differences between the three groups of myopia were analyzed using multiple analysis of variance (ANOVA) with the Bonferroni correction (post hoc comparisons). A P-value <0.05 was considered statistically significant. Linear regression was used to analyze the correlation between central and peripheral pachymetry with the SE and the AL; the correlation coefficient (r2) was determined. The Pearson correlation coefficient was also calculated to determine the relationship among the study variables. A P-value <0.05 was considered statistically significant.
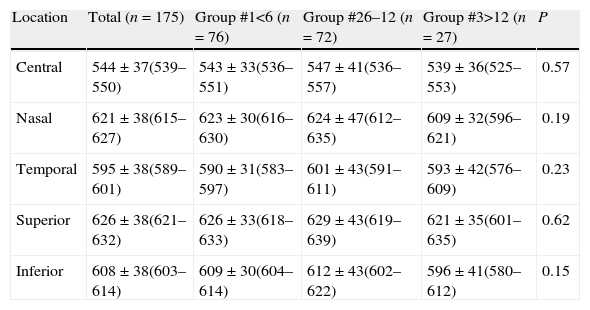
ResultsThe CCT and PCT values for the total sample and the three study groups are summarized in Table 1. Group #1 (low myopic eyes, under 6.00 D) comprised 76 eyes (34.43±9.41 years), with an average SE of −3.31±1.40 D, AL of 25.18±1.16mm, IOP of 14.14±2.11mmHg, maximum corneal power of 44.01±1.53D and minimum corneal power of 43.11±1.51 D; group #2 (moderate myopic eyes, between 6.00 and 12.00 D) comprised 72 eyes (36.72±8.31 years) with an average SE of −8.32±1.64 D, AL of 26.59±1.26mm, IOP of 14.10±2.23mmHg, maximum corneal power of 44.82±1.58 D and minimum corneal power of 43.57±1.30 D; and group #3 (extremely myopic eyes, more than 12.00 D) comprised 27 eyes (40.74±10.16 years) with an average SE of −16.44±4.48 D, AL of 29.45±2.58mm, IOP of 14.80±2.45mmHg, maximum corneal power of 44.79±1.68 D and minimum corneal power of 43.69±1.40 D. No differences were found between men and women in the total sample and in each three studied groups in CCT and PCT (P>0.05).
Mean corneal thickness (CT), standard deviation (SD) (μm) and the 95% CI, for the total sample and for all the studied groups for all the corneal locations studied.
| Location | Total (n=175) | Group #1<6 (n=76) | Group #26–12 (n=72) | Group #3>12 (n=27) | P |
| Central | 544±37(539–550) | 543±33(536–551) | 547±41(536–557) | 539±36(525–553) | 0.57 |
| Nasal | 621±38(615–627) | 623±30(616–630) | 624±47(612–635) | 609±32(596–621) | 0.19 |
| Temporal | 595±38(589–601) | 590±31(583–597) | 601±43(591–611) | 593±42(576–609) | 0.23 |
| Superior | 626±38(621–632) | 626±33(618–633) | 629±43(619–639) | 621±35(601–635) | 0.62 |
| Inferior | 608±38(603–614) | 609±30(604–614) | 612±43(602–622) | 596±41(580–612) | 0.15 |
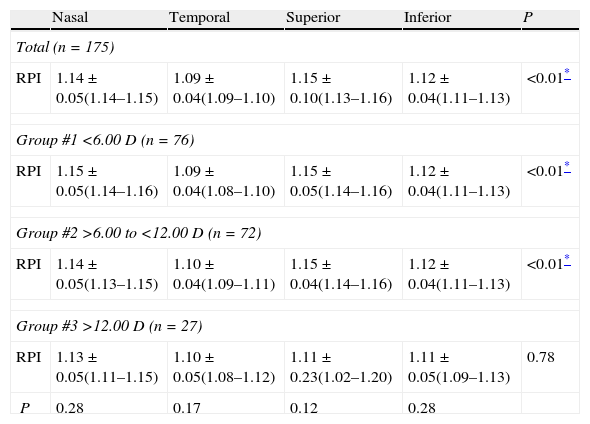
Non-statistically significant differences in the CCT and PCT were found among the study groups (P>0.05, ANOVA). However, the RPI shows statistical differences (P<0.05 ANOVA with Bonferroni correction, Table 2) with corneal location in all study groups except in extremely myopic eyes (group #3).
Mean relative peripheral index (RPI), standard deviation (SD) and the 95% CI for the total sample and for all the studied groups for all the corneal locations studied.
| Nasal | Temporal | Superior | Inferior | P | |
| Total (n=175) | |||||
| RPI | 1.14±0.05(1.14–1.15) | 1.09±0.04(1.09–1.10) | 1.15±0.10(1.13–1.16) | 1.12±0.04(1.11–1.13) | <0.01* |
| Group #1 <6.00 D (n=76) | |||||
| RPI | 1.15±0.05(1.14–1.16) | 1.09±0.04(1.08–1.10) | 1.15±0.05(1.14–1.16) | 1.12±0.04(1.11–1.13) | <0.01* |
| Group #2 >6.00 to <12.00 D (n=72) | |||||
| RPI | 1.14±0.05(1.13–1.15) | 1.10±0.04(1.09–1.11) | 1.15±0.04(1.14–1.16) | 1.12±0.04(1.11–1.13) | <0.01* |
| Group #3 >12.00 D (n=27) | |||||
| RPI | 1.13±0.05(1.11–1.15) | 1.10±0.05(1.08–1.12) | 1.11±0.23(1.02–1.20) | 1.11±0.05(1.09–1.13) | 0.78 |
| P | 0.28 | 0.17 | 0.12 | 0.28 | |
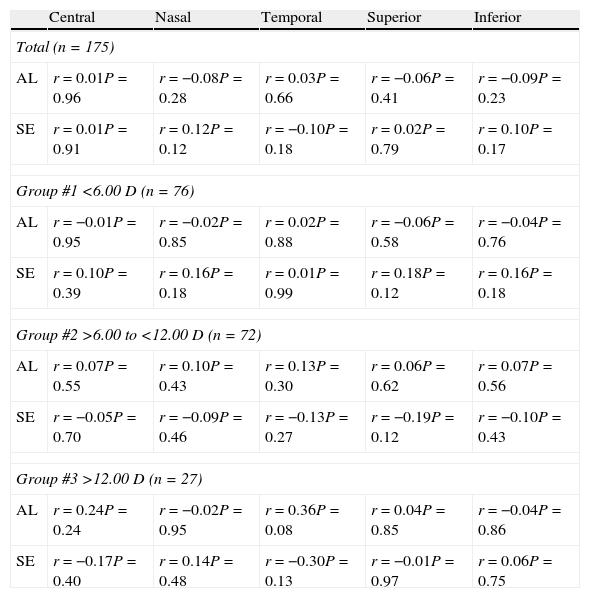
A significant direct relationship was obtained between the central and peripheral thickness in all positions (central, nasal, temporal, superior and inferior) for all sample and in each study group with a r>0.75 (P<0.01). Non-significant relationships were found between central thickness (at both the center and the periphery of the cornea) with AL and SE (Table 3).
The relationship between central and peripheral (nasal, temporal, superior and inferior locations) corneal thickness, respectively, with axial length (AL) and the spherical equivalent (SE).
| Central | Nasal | Temporal | Superior | Inferior | |
| Total (n=175) | |||||
| AL | r=0.01P=0.96 | r=−0.08P=0.28 | r=0.03P=0.66 | r=−0.06P=0.41 | r=−0.09P=0.23 |
| SE | r=0.01P=0.91 | r=0.12P=0.12 | r=−0.10P=0.18 | r=0.02P=0.79 | r=0.10P=0.17 |
| Group #1 <6.00 D (n=76) | |||||
| AL | r=−0.01P=0.95 | r=−0.02P=0.85 | r=0.02P=0.88 | r=−0.06P=0.58 | r=−0.04P=0.76 |
| SE | r=0.10P=0.39 | r=0.16P=0.18 | r=0.01P=0.99 | r=0.18P=0.12 | r=0.16P=0.18 |
| Group #2 >6.00 to <12.00 D (n=72) | |||||
| AL | r=0.07P=0.55 | r=0.10P=0.43 | r=0.13P=0.30 | r=0.06P=0.62 | r=0.07P=0.56 |
| SE | r=−0.05P=0.70 | r=−0.09P=0.46 | r=−0.13P=0.27 | r=−0.19P=0.12 | r=−0.10P=0.43 |
| Group #3 >12.00 D (n=27) | |||||
| AL | r=0.24P=0.24 | r=−0.02P=0.95 | r=0.36P=0.08 | r=0.04P=0.85 | r=−0.04P=0.86 |
| SE | r=−0.17P=0.40 | r=0.14P=0.48 | r=−0.30P=0.13 | r=−0.01P=0.97 | r=0.06P=0.75 |
Low correlation was found between the central thickness and AL for group #1 (r2<0.01, P=0.820), group #2 (r2<0.01, P=0.797) and group #3 (r2=0.10, P=0.098). A similar trend was found for the mild-peripheral thickness at nasal (r2<0.01, P>0.05 for all study groups), temporal (r2<0.09, P>0.05 for all study groups), superior (r2<0.02, P>0.05 for all study groups) and inferior (r2<0.01, P>0.05 for all study groups) corneal locations.
Spherical equivalent showed a low correlation with central thickness for group #1 (r2=0.10, P=0.394), group #2 (r2<0.01, P=0.703) and group #3 (r2=0.03, P=0.401). A similar trend was found for the mild-peripheral thickness at nasal (r2<0.02, P>0.05 for all study groups), temporal (r2<0.08, P>0.05 for all study groups), superior (r2<0.03, P<0.05 for all study groups) and inferior (r2<0.02, P>0.05 for all study groups) corneal locations.
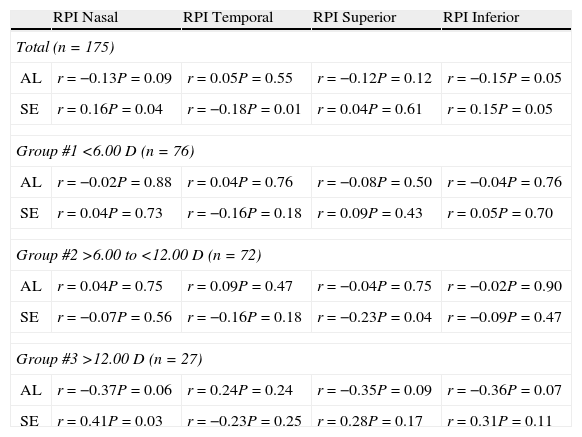
Relationship between AL and SE with relative peripheral indexThe total sample RPI and specific RPI in each study group for all PCT locations were summarized in Table 2 without statistical differences (P>0.05, ANOVA) between all study groups. The relationships between the RPI and the AL or SE are summarized in Table 4.
The relationship between the relative peripheral index (RPI) and the axial length (AL) and the spherical equivalent (SE).
| RPI Nasal | RPI Temporal | RPI Superior | RPI Inferior | |
| Total (n=175) | ||||
| AL | r=−0.13P=0.09 | r=0.05P=0.55 | r=−0.12P=0.12 | r=−0.15P=0.05 |
| SE | r=0.16P=0.04 | r=−0.18P=0.01 | r=0.04P=0.61 | r=0.15P=0.05 |
| Group #1 <6.00 D (n=76) | ||||
| AL | r=−0.02P=0.88 | r=0.04P=0.76 | r=−0.08P=0.50 | r=−0.04P=0.76 |
| SE | r=0.04P=0.73 | r=−0.16P=0.18 | r=0.09P=0.43 | r=0.05P=0.70 |
| Group #2 >6.00 to <12.00 D (n=72) | ||||
| AL | r=0.04P=0.75 | r=0.09P=0.47 | r=−0.04P=0.75 | r=−0.02P=0.90 |
| SE | r=−0.07P=0.56 | r=−0.16P=0.18 | r=−0.23P=0.04 | r=−0.09P=0.47 |
| Group #3 >12.00 D (n=27) | ||||
| AL | r=−0.37P=0.06 | r=0.24P=0.24 | r=−0.35P=0.09 | r=−0.36P=0.07 |
| SE | r=0.41P=0.03 | r=−0.23P=0.25 | r=0.28P=0.17 | r=0.31P=0.11 |
Low correlation was found between AL with nasal RPI [group #1 (r2<0.01, P=0.402), group #2 (r2<0.01, P=0.748) and group #3 (r2=0.18, P=0.026)], temporal RPI [group #1 (r2<0.01, P=0.886), group #2 (r2<0.01, P=0.663) and group #3 (r2<0.01, P=0.981)], superior RPI [group #1 (r2<0.01, P=0.521), group #2 (r2<0.01, P=0.477) and group #3 (r2=0.09, P=0.134)] and inferior RPI [group #1 (r2<0.01, P=0.938), group #2 (r2<0.01, P=0.596) and group #3 (r2=0.09, P=0.127)].
Spherical equivalent for the three studied groups showed a low correlation with the nasal RPI [group #1 (r2<0.01, P=0.725), group #2 (r2<0.01, P=0.558) and group #3 (r2=0.17, P=0.034)], temporal RPI [group #1 (r2=0.02, P=0.178), group #2 (r2=0.02, P=0.180) and group #3 (r2=0.05, P=0.251)], superior RPI [group #1 (r2<0.01, P=0.430), group #2 (r2=0.05, P=0.048) and group #3 (r2=0.07, P=0.174)] and inferior RPI [group #1 (r2<0.10, P=0.691), group #2 (r2<0.01, P=0.471) and group #3 (r2=0.09, P=0.114)].
DiscussionThe CCT is of paramount importance in clinical practice for many reasons, such as its influence on IOP measurement. It is also critical when planning refractive surgery and other clinical situations. The overall sample CCT was 544±37μm. This value is somehow higher than that reported by Doughty and Zaman4 in his meta-analysis, where the average CCT was 535μm when considering healthy corneas with CCT values between 503 and 565μm. Garcia-Medina et al. studied 310 myopic eyes and obtained a CCT of 550±36μm, slightly higher than our result.21 AlMahmoud et al.11 obtained similar CCT value as that found in the present study (543±34μm in a sample of 3091 myopic eyes).
The relationship between refractive error and the CCT has been previously studied in several reports. However, the results of these studies are controversial. Some found that subjects with myopia had thicker corneas,12 whereas others found that they have thinner corneas,7,13 and finally, others did not find any relationship between the CCT and the degree of myopia.10,11,14,15
With this background, further investigation was needed to clarify if there is any influence of refractive error on corneal thickness (by means of the AL or the SE). We did not find a significant relationship between the CCT with AL or SE when the total sample was analyzed. Kunert et al.12 in a 1214 myopic-eye sample and by Sanchis-Gimeno et al.13 analyzed the CCT in extremely myopic eyes (range 12.00–24.00 D) and compared the results with a control sample comprised of low myopic eyes. They did not obtain statistically significant differences between the two groups, but they did find a similar tendency for the corneas on extremely myopic eyes to be thicker than those on low myopic eyes.
However, Chang et al.22 found an inverse relationship between the CCT and AL, which means that corneas are thinner in longer eyes (i.e., they have a high degree of myopia). However, Chang et al. did not include extremely myopic eyes, yielding an average SE of −4.17D in a sample of 216 myopic eyes.
Other authors have not found any relationship between the CCT and SE or AL. Chen et al.14 analyzed 500 hyperopic, emmetropic and myopic eyes but did not find any significant relationship. Studying the sample as a unique group (without differentiation according to the degree of myopia) may have influenced their conclusions. In the same way, AlMahmoud et al.11 studied 3091 myopic eyes with an average SE of −4.58D, ranging from −0.13 to −14.00D and did not find a significant relationship between the CCT and SE. AlMahmoud et al. did not study the sample in segmented groups to identify any differences that resulted from changes in the degrees of myopia.
Another possible explanation for these controversial results yielded by the comparison of the CCT and SE could be the fact that different corneal pachymeters have been used in different studies. Notably, ultrasound pachymetry has been shown to provide lightly higher CCT values than slit-lamp-based pachymetry (Orbscan II).4 The time of day also influences the corneal thickness, with higher values in the morning than in the afternoon.4 In this study, we used Orbscan II pachymetry (with a 0.92 acoustic factor) to determine the corneal thickness because it provides a non-invasive, repeatable and reproducible23 measurement of central and peripheral pachymetry in healthy eyes. The use of a 0.92 acoustic factor could be not valid for all corneal topographic positions24,25 and some authors recommend that no acoustic factor be used.26 However, the effect of the use of any acoustic factor has a limited effect when correlation (linear regression) is calculated,25 as we conduct in this study.
To the best of the authors’ knowledge, this is the first time that not only the CCT but also the PCT has been studied and related with the degree of myopia (in terms of AL and SE).
In eyes without ocular pathology, the cornea thickens from the center to the periphery,27 independently of the SE, due to an increase in the thickness of Bowman's layer and the stroma when reaching the periphery of the cornea.28 We found a thinner CCT than indicated by nasal, temporal, superior and inferior pachymetry for both the total sample and for all study groups. As expected, all pachymetries (central, nasal, temporal, superior and inferior) were directly correlated (r>0.78 P<0.05).
The assessment of the central and peripheral corneal thickness is also important to analyze the corneal biomechanical properties.29 Jiang et al.29 and Plakitsi et al.30 studied the relationship between the corneal hysteresis and myopia. Both found low corneal hysteresis in high myopic eyes (more than 6.00 D), with thicker CCT in high myopic eyes29 and conclude that the mechanical strength in anterior segment of the high myopic eyes is compromised. However, they did not study the peripheral pachymetry. Also, Jiang et al.29 did not find differences between CCT in non myopic (SE>−0.50D) and different degrees of myopia [low myopia (SE between −0.50 and −3.00D), moderate myopia (SE between −3.00 and −6.00D) and high myopia (SE<−6.00D)]. These results agree with our findings and suggest that biomechanical worsening related with high myopia could be more related with corneal biologic modifications, than with anatomical differences in central thickness. Further investigation is necessary that clarify the role of the PCT in the corneal hysteresis values in high myopic eyes.
Corneal thickness is of great importance in excimer laser refractive surgery of myopia. The results of this study highlight the necessity of pachymetry evaluation in preoperative assessment of excimer laser surgery in any degree of myopia to avoid post-surgery complications.31
RPI was also calculated to establish how much thicker the PCT was in comparison to the CCT. Jonuscheit and Doughty18 described this index in 2009. The differences between groups were approximately 3% and could be related to the degree of Orbscan II repeatability when measuring healthy corneas (repeatability was established in 0.74%, 1.67%, 1.29%, 1.11% and 1.11% for central, superior, inferior, nasal and temporal corneal locations, respectively).23
We used IOL Master biometry to assess the AL because it provides non-contact, repeatable, high-resolution measurements of AL with insignificant differences with ultrasound biometry in AL measurement32 and similar refractive outcome after cataract surgery.33
ConclusionThere are no significant differences among low, moderate and extremely myopic eyes related to the CCT and PCT. Central and peripheral corneal thickness are very similar in myopic eyes with small differences that are not clinically relevant to myopic patient management.
Conflicts of interestThe authors have no conflicts of interest to declare.


