

To compare the peripheral refraction and spherical aberration profiles along three visual field meridians of 16 commercial single vision (SV), bifocal (BF) and multifocal (MF) test contact lenses with a single vision control.
MethodForty-four participants [24.2±2.4 years, SE: −0.50 to −4.50D] were randomly fitted, contra-laterally, with 6 SV's [Air Optix Aqua (control), Acuvue Oasys, Biofinity, Clariti, Night & Day and Proclear], 3 BF's [Acuvue Bifocal low and high add, MiSight] and 8 MF's [Proclear D & N in 1.5 and 2.5D adds; AirOptix, PureVision low & high adds]. Peripheral refraction was performed across horizontal, oblique and vertical meridians, with lenses on eye using the BHVI-EyeMapper. The power vectors M, J0, J45 and the spherical aberration coefficient were analysed. The peripheral refraction and aberration profiles of the test lenses were compared with the profiles of the control lens using curvature and slope coefficients.
ResultsCompared to the control, a relative peripheral hyperopic shift (M), a less negative J0 curvature coefficient along the horizontal meridian, a less positive J0 curvature coefficient along the vertical meridian, a less negative J45 curvature coefficient along the oblique meridian and a more positive spherical aberration curvature coefficient along most meridians was seen with the Acuvue Bifocal and all center-near multifocal lenses. For the center-distance multifocal lenses the direction of the curvature coefficients of the same refraction and aberration components was opposite to that of the center-near lenses.
The greatest differences in the slope coefficients when compared to the control were found for the Acuvue Bifocal lenses and all multifocal contact lenses for the refractive component M and the spherical aberration coefficient along the horizontal visual field meridian, with the Acuvue Bifocal and the center-near multifocal lenses having more positive coefficients and the center-distance lenses having more negative coefficients.
ConclusionWhen worn on eye, different commercially available lens types produce differences in the direction and magnitude of the peripheral refraction and spherical aberration profiles along different visual field meridians. This information may be relevant to refractive development and myopia control.
Comparar los perfiles de refracción periférica y aberración esférica en tres meridianos del campo visual de 16 lentes de contacto (LC) comerciales de prueba monofocales (VS), bifocales (BF) y multifocales (MF), con control de visión simple.
MétodoColocamos aleatoria y contralateralmente a cuarenta participantes [44,2±2,4 años, SE: −0,5 a −4,5 D]: 6 LC monofocales [Air Optix Aqua (control), Acuvue Oasys, Biofinity, Clariti, Night & Day y Proclear], 3 bifocales [Acuvue Bifocal con adición baja y alta, MiSight] y 8 MF [Proclear D & N con adición de 1,5 y 2,5D; AirOptix, PureVision con adición baja y alta]. Realizamos la refracción periférica en los meridianos horizontal, oblicuo y vertical, con lentillas en un ojo utilizando el BHVI-EyeMapper. Se analizaron los vectores de potencia M, J0, J45 y el coeficiente de aberración esférica. Se compararon los perfiles de refracción periférica y aberración esférica de las LC de prueba con los perfiles de las LC de control utilizando los coeficientes de curvatura y pendiente.
ResultadosEn comparación con el control, observamos un cambio hiperópico periférico relativo (M), un coeficiente de curvatura J0 menos negativo en el meridiano horizontal, un coeficiente de curvatura J0 menos positivo en el meridiano vertical, un coeficiente de curvatura J45 menos negativo en el meridiano oblicuo, y un coeficiente de curvatura de aberración esférica más positivo en la mayoría de meridianos con las lentillas Acuvue Bifocal y todas las lentillas multifocales de diseño centro-cerca. Para las lentillas multifocales centro-lejos la dirección de los coeficientes de curvatura de los mismos componentes de refracción y aberración fue opuesta a la de las lentillas centro-cerca.
Las mayores diferencias en cuanto a coeficientes de pendiente, al compararse con el control, se encontraron en las lentillas Acuvue Bifocal y en todas las lentillas multifocales para el componente refractivo M y el coeficiente de aberración esférica en el meridiano del campo visual horizontal, siendo las lentillas Acuvue Bifocal y las multifocales centro-cerca las que mostraron más coeficientes positivos, y las lentillas centro-lejos las que reflejaron más coeficientes negativos.
ConclusiónAl colocarse en un solo ojo, las diferentes lentillas comerciales producen diferencias en cuanto a dirección y magnitud de los perfiles de refracción periférica y aberración esférica en los diferentes meridianos del campo visual. Esta información puede ser relevante para el desarrollo refractivo y el control de la miopía.
Controlled experimental studies in animals have been critical to the understanding of refractive development, showing that not only central1–4 but also peripheral5–7 hyperopic retinal defocus can stimulate eye growth. In addition, studies in human eyes have shown that myopic eyes usually have greater accommodative lag, or central hyperopic defocus during near viewing,8–11 and more relative peripheral hyperopic defocus than emmetropic eyes.12–14 Based on these findings, it was hypothesized that optical interventions that reduce central and/or peripheral hyperopic defocus may reduce myopia progression.
Numerous studies have since tested the hypothesis of reducing central (i.e. accommodative lag) or peripheral hyperopic defocus with either spectacles, such as progressive addition lenses or executive bifocals,15–17 or contact lenses, such as center-distance multifocal contact lenses, concentric bifocal contact lenses or orthokeratology lenses.18–23 The majority of optical interventions showed a reduction of myopia progression between 30% and 40% when compared to standard single vision lenses.24 Unlike with spectacle lenses, which require the wearer to look through a certain portion of the spectacle lens in order to achieve the desired myopia control effect, a more consistent myopia control treatment can be achieved with contact lens-based interventions, as the desired power profile within the optical zone is positioned directly over the pupil.
Power profile measurements (in vitro), as reported previously,25–27 permit a direct comparison of commercially available soft contact lens designs. Besides the general lens design differences known for single vision, concentric bifocal or center-distance and center-near multifocal lenses, there are distinctive differences between the individual contact lens types from each manufacturer and some power profiles of the same contact lens type (brand) vary as a function of distance labeled power and/or near add power.26,27
To understand the central and peripheral differences of contact lenses, it is not only of interest to know the power profile differences between the different lens types but also to compare the refraction changes across the visual field when the different contact lens types are worn on eye. To date, only a few studies have compared central and peripheral refraction measurements with different contact lenses on eye.28–35 Those studies were limited to measurements with only a few multifocal contact lens types and measurements were usually taken along the horizontal visual field meridian using a modified open-view Shin-Nippon autorefractor.
When performing refraction measurements through contact lenses that feature a non-uniform power distribution across the optic zone, different operational principles between instruments, such as auto-refractors and aberrometers, need to be taken into account. In a recent pilot study,32 a simple experiment was performed that involved refraction measurements through a model eye fitted with a well-centered single vision spectacle lens with and without a 1.25mm hole drilled into its center. While the measurement results with the auto- refractor (Shin Nippon) were identical for both test conditions, the results with the aberrometer (COAS-HD) were different. This confirms the differences of the instrument's refraction principles, i.e. the Shin-Nippon auto-refractor ignores the central part of the pupil, which can be explained by its ring-operation principle, while the aberrometer quantifies the refractive error from the captured wavefront across the entire pupil area. This suggests that when measuring through contact lenses with non-uniform power profiles (e.g. multifocal contact lenses), an aberrometer would provide more meaningful refraction results than an auto-refractor.32
The aim of this study was to use an aberrometer instrument to compare the peripheral refraction and spherical aberration profiles, as determined from three visual field meridians (horizontal, 45/135° oblique and vertical) of 16 commercially available contact lenses, i.e. five single vision, three bifocal and eight multifocal contact lenses, with a control single vision lens featuring minimal spherical aberration.25
MethodsStudy designThis was a prospective, participant-masked, non-dispensing, contralateral, crossover, balanced-block design clinical trial conducted at the Brien Holden Vision Institute (Sydney, Australia). The protocol and informed consent were reviewed and approved by an independent ethics committee (Bellberry Human Research Ethics Committee, South Australia) and the research followed the tenets of the Declaration of Helsinki. Written informed consent was obtained from all participants after explanation of the nature, procedures, and consequences of the study and before any study procedures were performed. The study was registered with the Australian and New Zealand Clinical Trial Registry (ACTRN12612000370808) prior to enrolment of the first participant.
ParticipantsForty-four participants, aged 18–35 years, were enrolled into this study. Participants were required to have myopia between −0.25 to −4.00D, astigmatism of no greater than −1.00D and have normal ocular health, which would not prevent them from safely wearing contact lenses. Previous experience with contact lens wear was not a requirement.
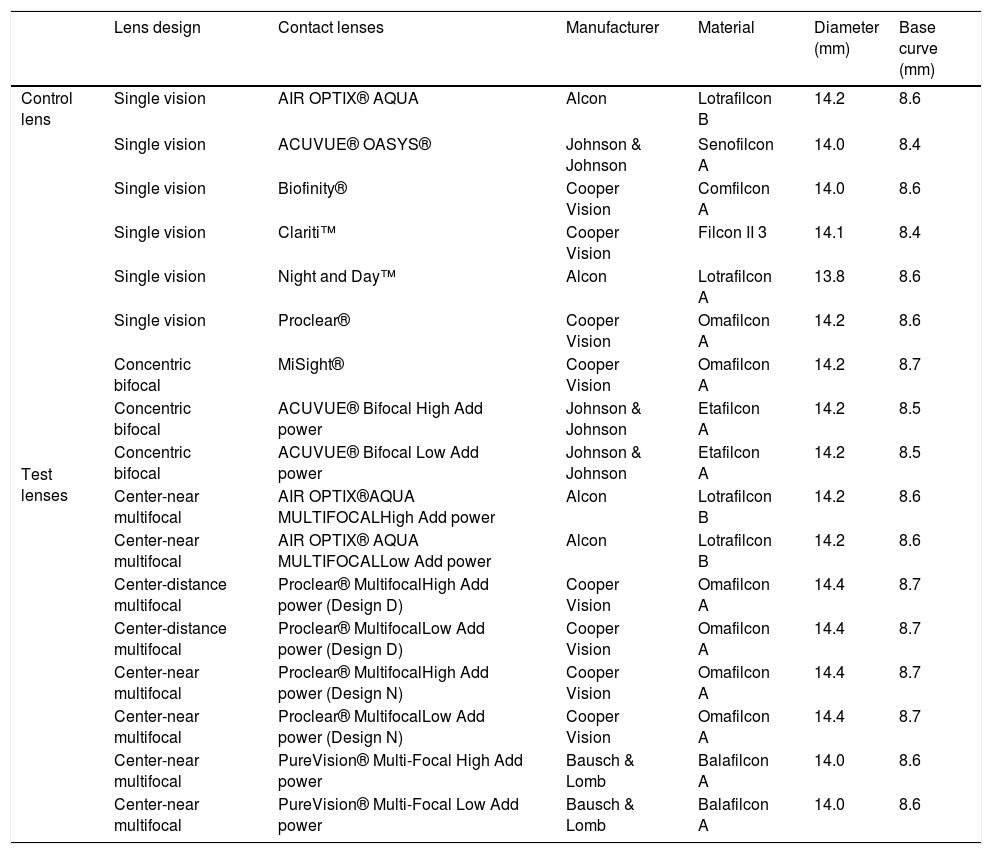
Each participant attended five scheduled visits (including the baseline visit), with a minimum of one overnight wash-out between the visits. Participants were asked to wear their own habitual correction during the washout period. At the baseline visit, all participants were fitted binocularly with AirOptix Aqua single vision contact lenses (control). Sixteen types of commercial contact lenses (test) (Table 1) were randomly assigned to 88 eyes. At the 4 scheduled follow-up visits, 4 lens types (i.e. 2 pairs per visit) were worn as per randomisation. To permit a direct comparison between lens types, the distance-labeled contact lens power was kept the same for all lens types, i.e. based on the best-corrected distance refraction (spherical equivalent) with the control lens. Approximately one hour after each lens fit, central and peripheral refraction measurements were performed.
Details of contact lenses used in the study.
| Lens design | Contact lenses | Manufacturer | Material | Diameter (mm) | Base curve (mm) | |
|---|---|---|---|---|---|---|
| Control lens | Single vision | AIR OPTIX® AQUA | Alcon | Lotrafilcon B | 14.2 | 8.6 |
| Test lenses | Single vision | ACUVUE® OASYS® | Johnson & Johnson | Senofilcon A | 14.0 | 8.4 |
| Single vision | Biofinity® | Cooper Vision | Comfilcon A | 14.0 | 8.6 | |
| Single vision | Clariti™ | Cooper Vision | Filcon II 3 | 14.1 | 8.4 | |
| Single vision | Night and Day™ | Alcon | Lotrafilcon A | 13.8 | 8.6 | |
| Single vision | Proclear® | Cooper Vision | Omafilcon A | 14.2 | 8.6 | |
| Concentric bifocal | MiSight® | Cooper Vision | Omafilcon A | 14.2 | 8.7 | |
| Concentric bifocal | ACUVUE® Bifocal High Add power | Johnson & Johnson | Etafilcon A | 14.2 | 8.5 | |
| Concentric bifocal | ACUVUE® Bifocal Low Add power | Johnson & Johnson | Etafilcon A | 14.2 | 8.5 | |
| Center-near multifocal | AIR OPTIX®AQUA MULTIFOCALHigh Add power | Alcon | Lotrafilcon B | 14.2 | 8.6 | |
| Center-near multifocal | AIR OPTIX® AQUA MULTIFOCALLow Add power | Alcon | Lotrafilcon B | 14.2 | 8.6 | |
| Center-distance multifocal | Proclear® MultifocalHigh Add power (Design D) | Cooper Vision | Omafilcon A | 14.4 | 8.7 | |
| Center-distance multifocal | Proclear® MultifocalLow Add power (Design D) | Cooper Vision | Omafilcon A | 14.4 | 8.7 | |
| Center-near multifocal | Proclear® MultifocalHigh Add power (Design N) | Cooper Vision | Omafilcon A | 14.4 | 8.7 | |
| Center-near multifocal | Proclear® MultifocalLow Add power (Design N) | Cooper Vision | Omafilcon A | 14.4 | 8.7 | |
| Center-near multifocal | PureVision® Multi-Focal High Add power | Bausch & Lomb | Balafilcon A | 14.0 | 8.6 | |
| Center-near multifocal | PureVision® Multi-Focal Low Add power | Bausch & Lomb | Balafilcon A | 14.0 | 8.6 | |
The AirOptix Aqua single vision lens was chosen as a control lens, due to its ‘quasi-linear’ (i.e. minimal spherical aberration) power profile across the optic zone and the fact that its power profile only slightly changes across the power range.25 This control lens therefore permits the relative comparison of the refraction maps with the 16 commercial contact lens types. In the context of this paper, the 16 commercial lens types have been classified into single vision, concentric bifocal, center-near and center-distance multifocal contact lenses. Details of all study lenses are listed in Table 1.
InstrumentAfter one hour of lens wear, peripheral refraction and spherical aberration profiles were measured under distance (+1.00 D fogging to control accommodation) viewing settings using the BHVI-EyeMapper. Details of this instrument have been explained previously.36,37
In brief, the BHVI-EyeMapper is a custom-built aberrometer, which facilitates refraction and aberration measurements over a wide field of view, i.e. from −50° to +50° in 10° steps. The instrument head can be rotated from 0° to 90° in 15° steps, which permits measurements along seven visual field meridians. In this study, the instrument head was positioned at 0°, 45° and 90°. Due to its monocular, closed-view design the 45° instrument head position corresponds to nasal/superior and temporal/inferior 45° visual field measurements for right eye measurements and temporal/superior and nasal/inferior 135° visual field measurements for left eye measurements.
To avoid on-eye movements of the contact lens during measurements and to allow enough time for the participant to fixate the target, each measurement was taken about two seconds after a blink. With each lens on eye, four independent measurements were performed under low illumination (∼20lux). The non-measured eye was occluded.
AnalysisOnly visual field measurements of up to 30° (instead of 50°) were considered for the analysis, because some far peripheral data points along the vertical and oblique visual field meridians were missing. Missing data points in the far periphery of vertical and oblique visual field meridians can occur due to a partial obstruction of the pupil by the eye lid and/or eye lashes despite the participant's effort to open the eyes wide during the measurement (e.g. this limitation is more common in Asian eyes).
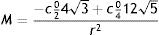
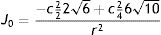
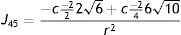
The refractive vector components M, J0 and J45 as well as the spherical aberration values were quantified over a 4mm circular pupil to allow a direct comparison of the peripheral refraction/aberration profiles and refraction/aberration maps between lens types. M, J0 and J45 were determined through paraxial curvature matching (up to 4th order)38 of each wavefront aberration map as shown in Eqs. (1)–(3):
To compare the peripheral refraction and spherical aberration profiles every test lens was compared to its crossover control, at each visual field meridian using a quadratic model. For this, curvature and slope coefficients of the relative profiles were estimated by fitting a second-order polynomial (least square regression) for each refractive power vector and the spherical aberration term. Whereas curvature coefficients were used to compare the curvature of the refraction and aberration profiles, slope coefficients were used to compare the symmetry of the profiles. A positive curvature coefficient indicates a positive shift in power in both visual fields of each measured meridian and vice versa for a negative curvature coefficient. Relative to on-axis, a positive slope coefficient indicates a positive measurement in the nasal and superior field and a negative measurement in the temporal and inferior visual field, for the horizontal and vertical meridians respectively.
A linear mixed model with subject random intercepts was then used to compare the slope and curvature coefficients between control and test lenses. The mixed model included field angle, quadratic term for field angle, lens type and the interactions between lens type with field angle and the quadratic term as factors. The coefficients and 95% confidence intervals for the slope and curvature for each lens type were estimated from the linear mixed model. Statistical significance was indicated by the non-overlapping of the 95% confidence intervals. The data was analysed separately for each test lens at each meridian. Analysis was performed using SPSS 21.
ResultsForty-four participants (age 24.2±2.4 years, spherical equivalent −2.67±0.91D, 65% female, 16% neophytes) completed the study.
Figs. 1–4 compare the curvature coefficients as obtained from the peripheral refraction (M, J0 and J45) and spherical aberration (SA) profiles between all single vision, bifocal and multifocal test contact lenses with the AirOptix Aqua control contact lens. Figs. 5–8 compare the slope coefficients of the profiles of those lenses. In addition, examples for the comparison of refraction and spherical aberration maps between the control and selected test lenses are shown in the attached supplementary material S1 to S4.
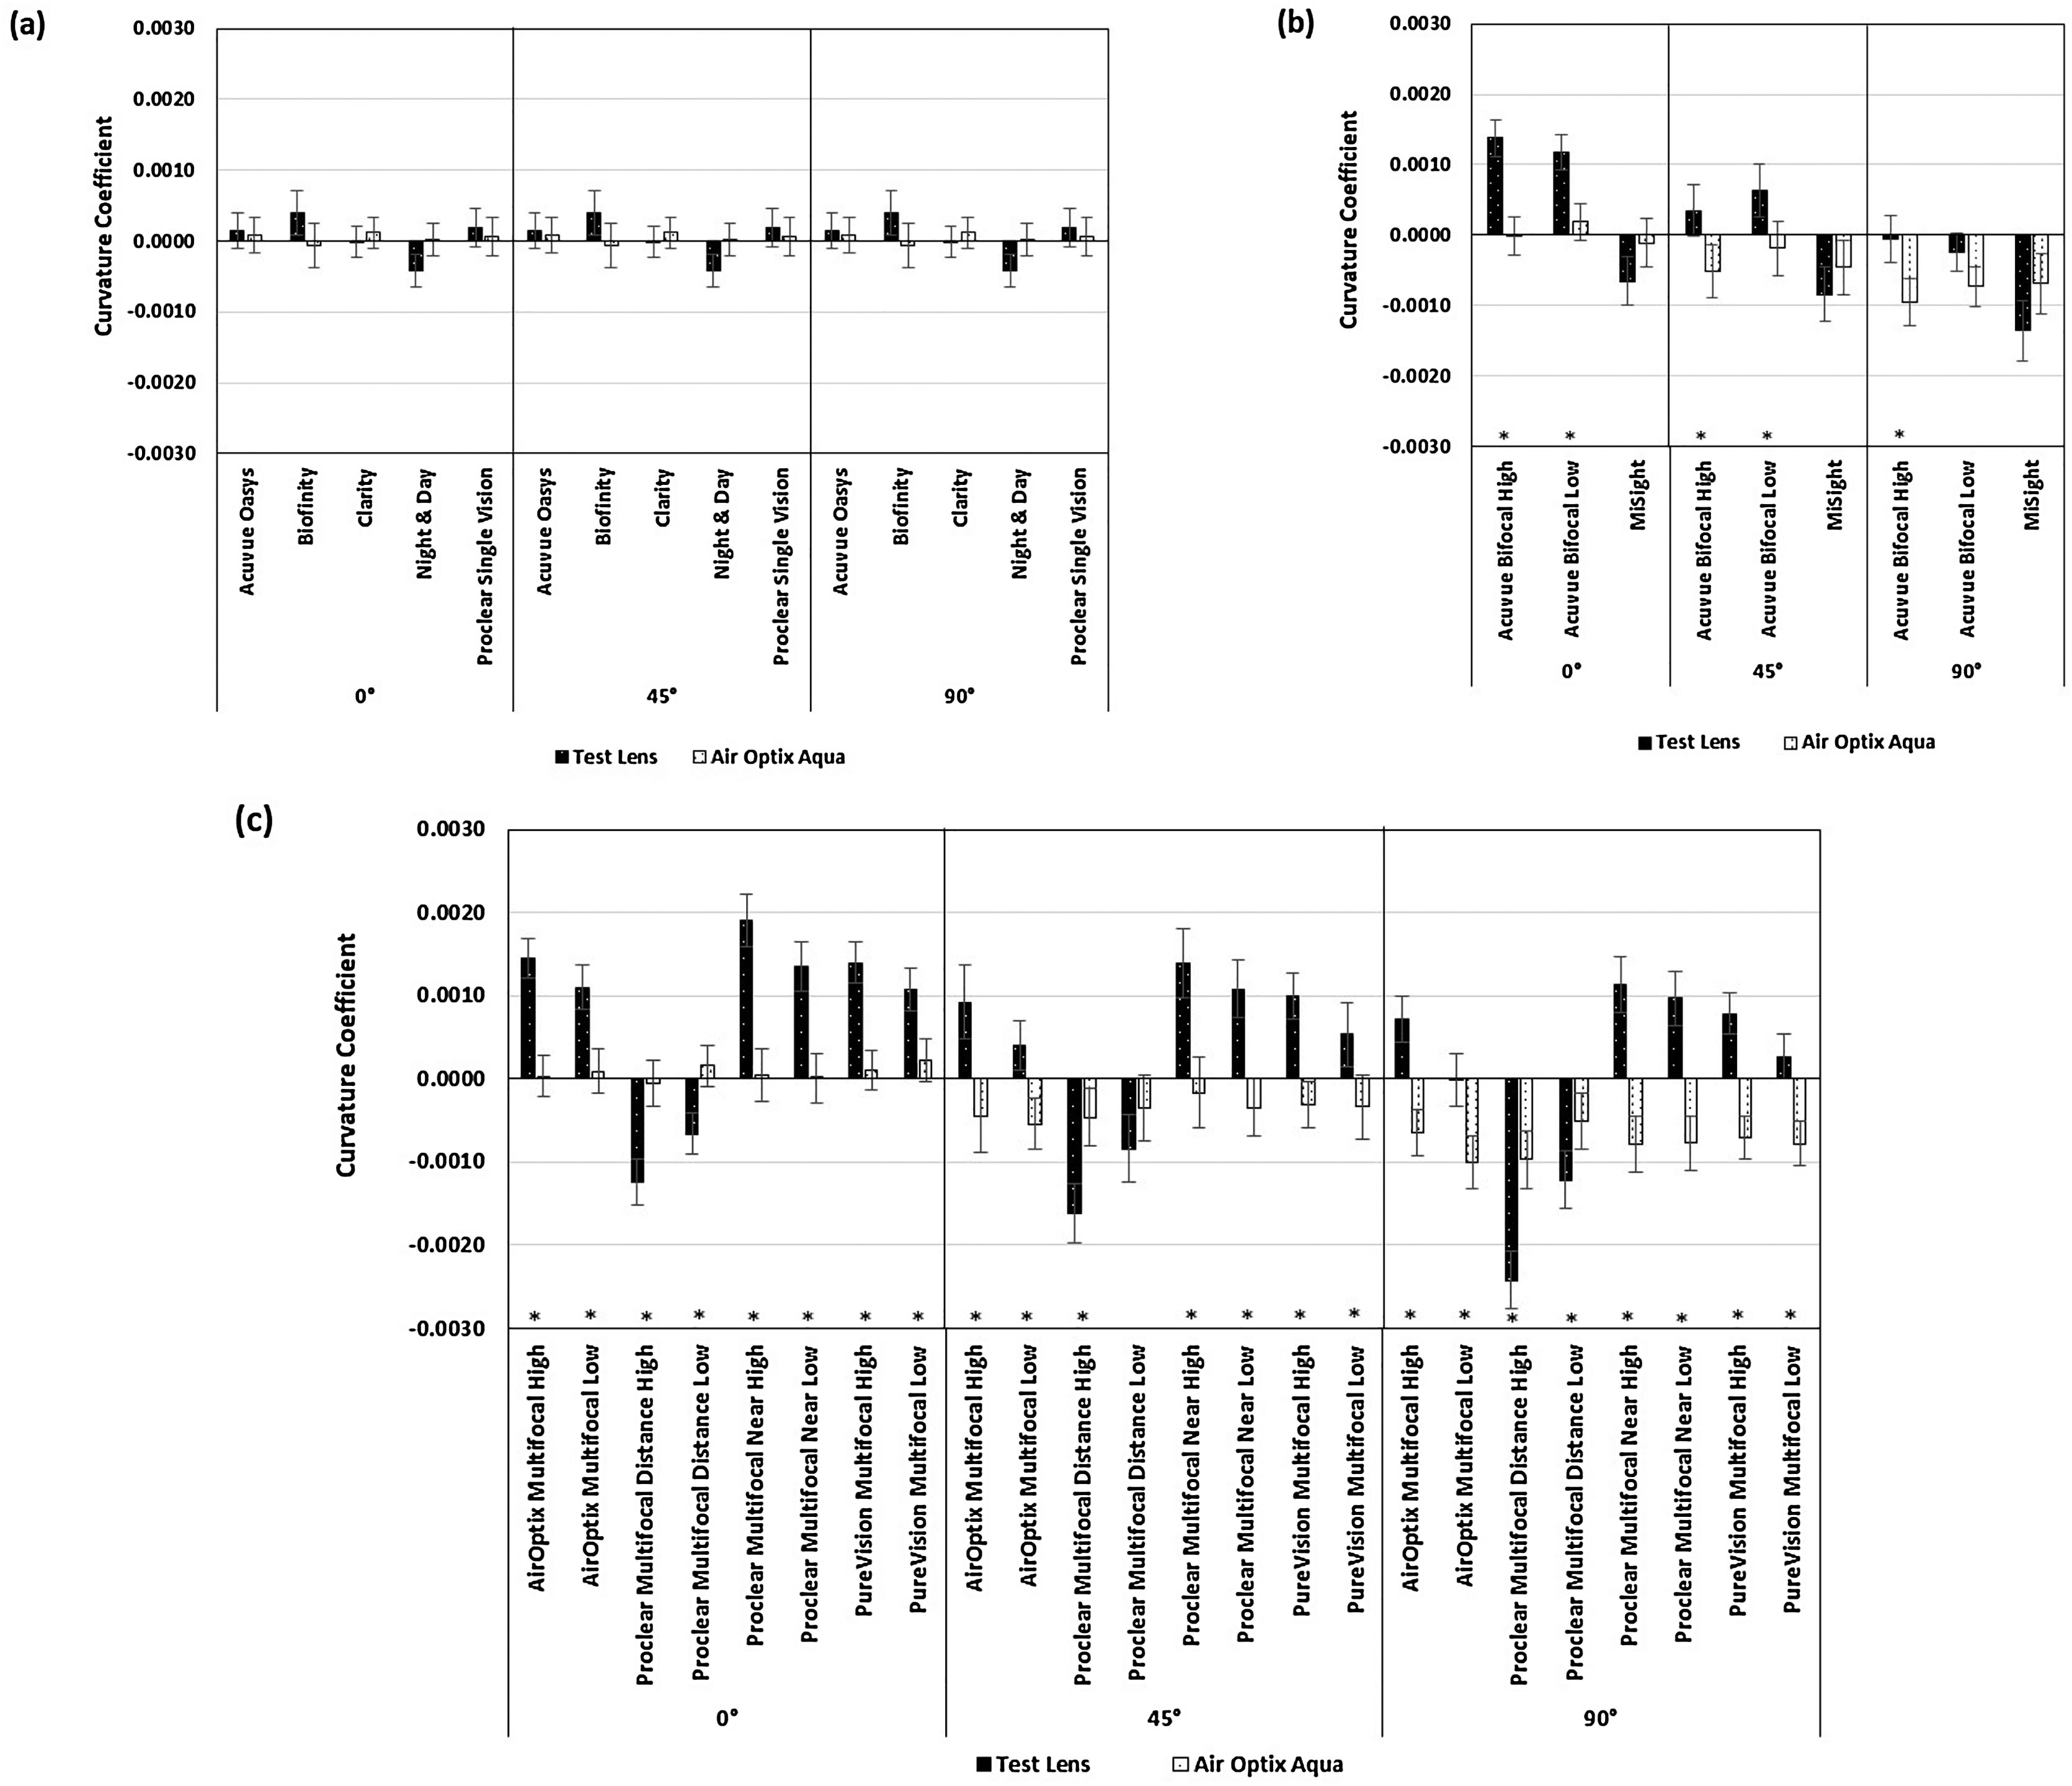
![Comparison of curvature coefficients (M) between the test contact lenses [(a) single vision, (b) bifocal and (c) multifocal] and AirOptix Aqua (control) contact lens for all three visual field meridians (i.e. 0°, 45° and 90°). Error bars indicate 95% confidence intervals. * indicates overlapping of 95% confidence intervals.](https://static.elsevier.es/multimedia/18884296/0000001300000001/v2_202002131537/S1888429618300980/v2_202002131537/en/main.assets/gr1.jpeg?xkr=ue/ImdikoIMrsJoerZ+w93meMsSv3kCFu9ka1kgzl/xrK32s3f4YRcWD6Dd7AXaruRxaMFA3yot1zg2gK5/R560TApWqJBJAB9mGd+vqFtBa8v/QE0j6hNsWPCVzD3aQ36KXTVd/bgJHJFWRfBhgJ2sYiVONWHbR8gNQCvjtlw2r4F6PKP8z3uXfKZT0SPaI1ahzNJl8T2TKTg7eke7J75crW50uBEpSZJxz/bkS7ZIhZPB1jsdX9jVkxACW9y5fbuyMkKQw0VNwPrqB98tFRX1/wW0RwLpPD9DMkyMZgls= "Comparison of curvature coefficients (M) between the test contact lenses [(a) single vision, (b) bifocal and (c) multifocal] and AirOptix Aqua (control) contact lens for all three visual field meridians (i.e. 0°, 45° and 90°). Error bars indicate 95% confidence intervals. * indicates overlapping of 95% confidence intervals.")
Comparison of curvature coefficients (M) between the test contact lenses [(a) single vision, (b) bifocal and (c) multifocal] and AirOptix Aqua (control) contact lens for all three visual field meridians (i.e. 0°, 45° and 90°). Error bars indicate 95% confidence intervals. * indicates overlapping of 95% confidence intervals.
![Comparison of curvature coefficients (J0) between the test contact lenses [(a) single vision, (b) bifocal and (c) multifocal] and AirOptix Aqua (control) contact lens for all three visual field meridians (i.e. 0°, 45° and 90°). Error bars indicate 95% confidence intervals. * indicates overlapping of 95% confidence intervals.](https://static.elsevier.es/multimedia/18884296/0000001300000001/v2_202002131537/S1888429618300980/v2_202002131537/en/main.assets/gr2.jpeg?xkr=ue/ImdikoIMrsJoerZ+w93meMsSv3kCFu9ka1kgzl/xrK32s3f4YRcWD6Dd7AXaruRxaMFA3yot1zg2gK5/R560TApWqJBJAB9mGd+vqFtBa8v/QE0j6hNsWPCVzD3aQ36KXTVd/bgJHJFWRfBhgJ2sYiVONWHbR8gNQCvjtlw2r4F6PKP8z3uXfKZT0SPaI1ahzNJl8T2TKTg7eke7J75crW50uBEpSZJxz/bkS7ZIhZPB1jsdX9jVkxACW9y5fbuyMkKQw0VNwPrqB98tFRX1/wW0RwLpPD9DMkyMZgls= "Comparison of curvature coefficients (J0) between the test contact lenses [(a) single vision, (b) bifocal and (c) multifocal] and AirOptix Aqua (control) contact lens for all three visual field meridians (i.e. 0°, 45° and 90°). Error bars indicate 95% confidence intervals. * indicates overlapping of 95% confidence intervals.")
Comparison of curvature coefficients (J0) between the test contact lenses [(a) single vision, (b) bifocal and (c) multifocal] and AirOptix Aqua (control) contact lens for all three visual field meridians (i.e. 0°, 45° and 90°). Error bars indicate 95% confidence intervals. * indicates overlapping of 95% confidence intervals.
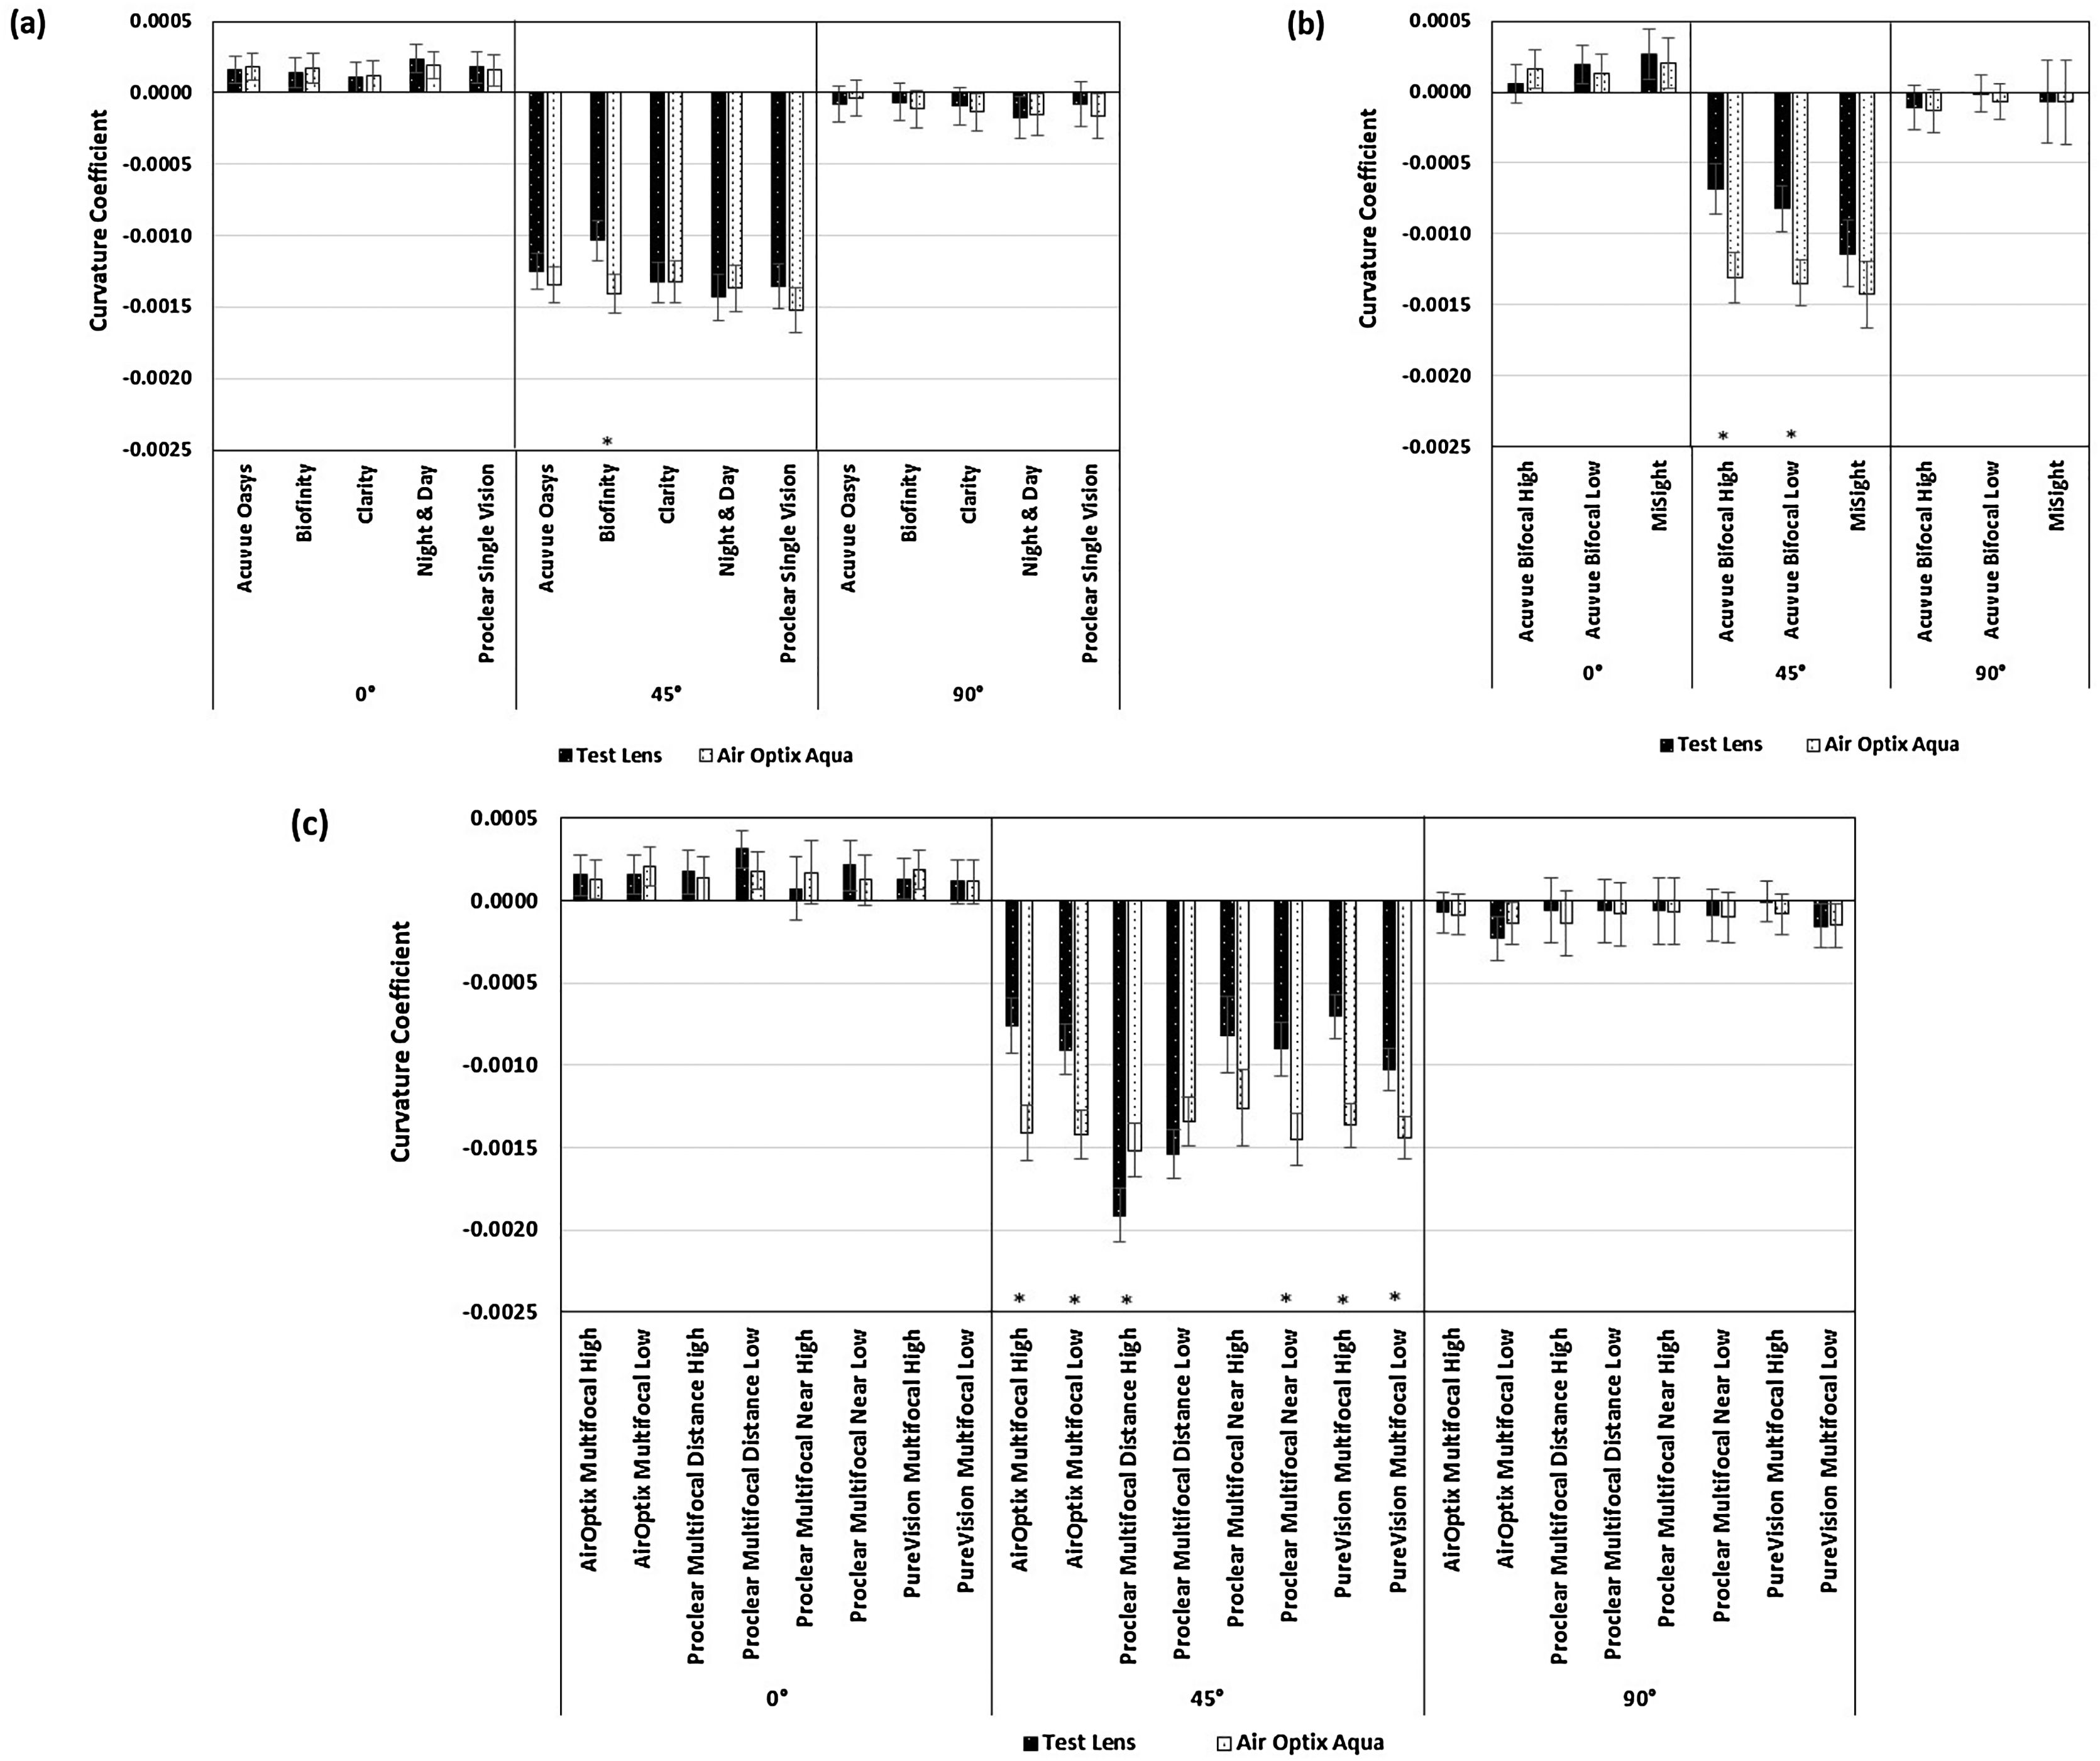
![Comparison of curvature coefficients (J45) between the test contact lenses [(a) single vision, (b) bifocal and (c) multifocal] and AirOptix Aqua (control) contact lens for all three visual field meridians (i.e. 0°, 45° and 90°). Error bars indicate 95% confidence intervals. * indicates overlapping of 95% confidence intervals.](https://static.elsevier.es/multimedia/18884296/0000001300000001/v2_202002131537/S1888429618300980/v2_202002131537/en/main.assets/gr3.jpeg?xkr=ue/ImdikoIMrsJoerZ+w93meMsSv3kCFu9ka1kgzl/xrK32s3f4YRcWD6Dd7AXaruRxaMFA3yot1zg2gK5/R560TApWqJBJAB9mGd+vqFtBa8v/QE0j6hNsWPCVzD3aQ36KXTVd/bgJHJFWRfBhgJ2sYiVONWHbR8gNQCvjtlw2r4F6PKP8z3uXfKZT0SPaI1ahzNJl8T2TKTg7eke7J75crW50uBEpSZJxz/bkS7ZIhZPB1jsdX9jVkxACW9y5fbuyMkKQw0VNwPrqB98tFRX1/wW0RwLpPD9DMkyMZgls= "Comparison of curvature coefficients (J45) between the test contact lenses [(a) single vision, (b) bifocal and (c) multifocal] and AirOptix Aqua (control) contact lens for all three visual field meridians (i.e. 0°, 45° and 90°). Error bars indicate 95% confidence intervals. * indicates overlapping of 95% confidence intervals.")
Comparison of curvature coefficients (J45) between the test contact lenses [(a) single vision, (b) bifocal and (c) multifocal] and AirOptix Aqua (control) contact lens for all three visual field meridians (i.e. 0°, 45° and 90°). Error bars indicate 95% confidence intervals. * indicates overlapping of 95% confidence intervals.
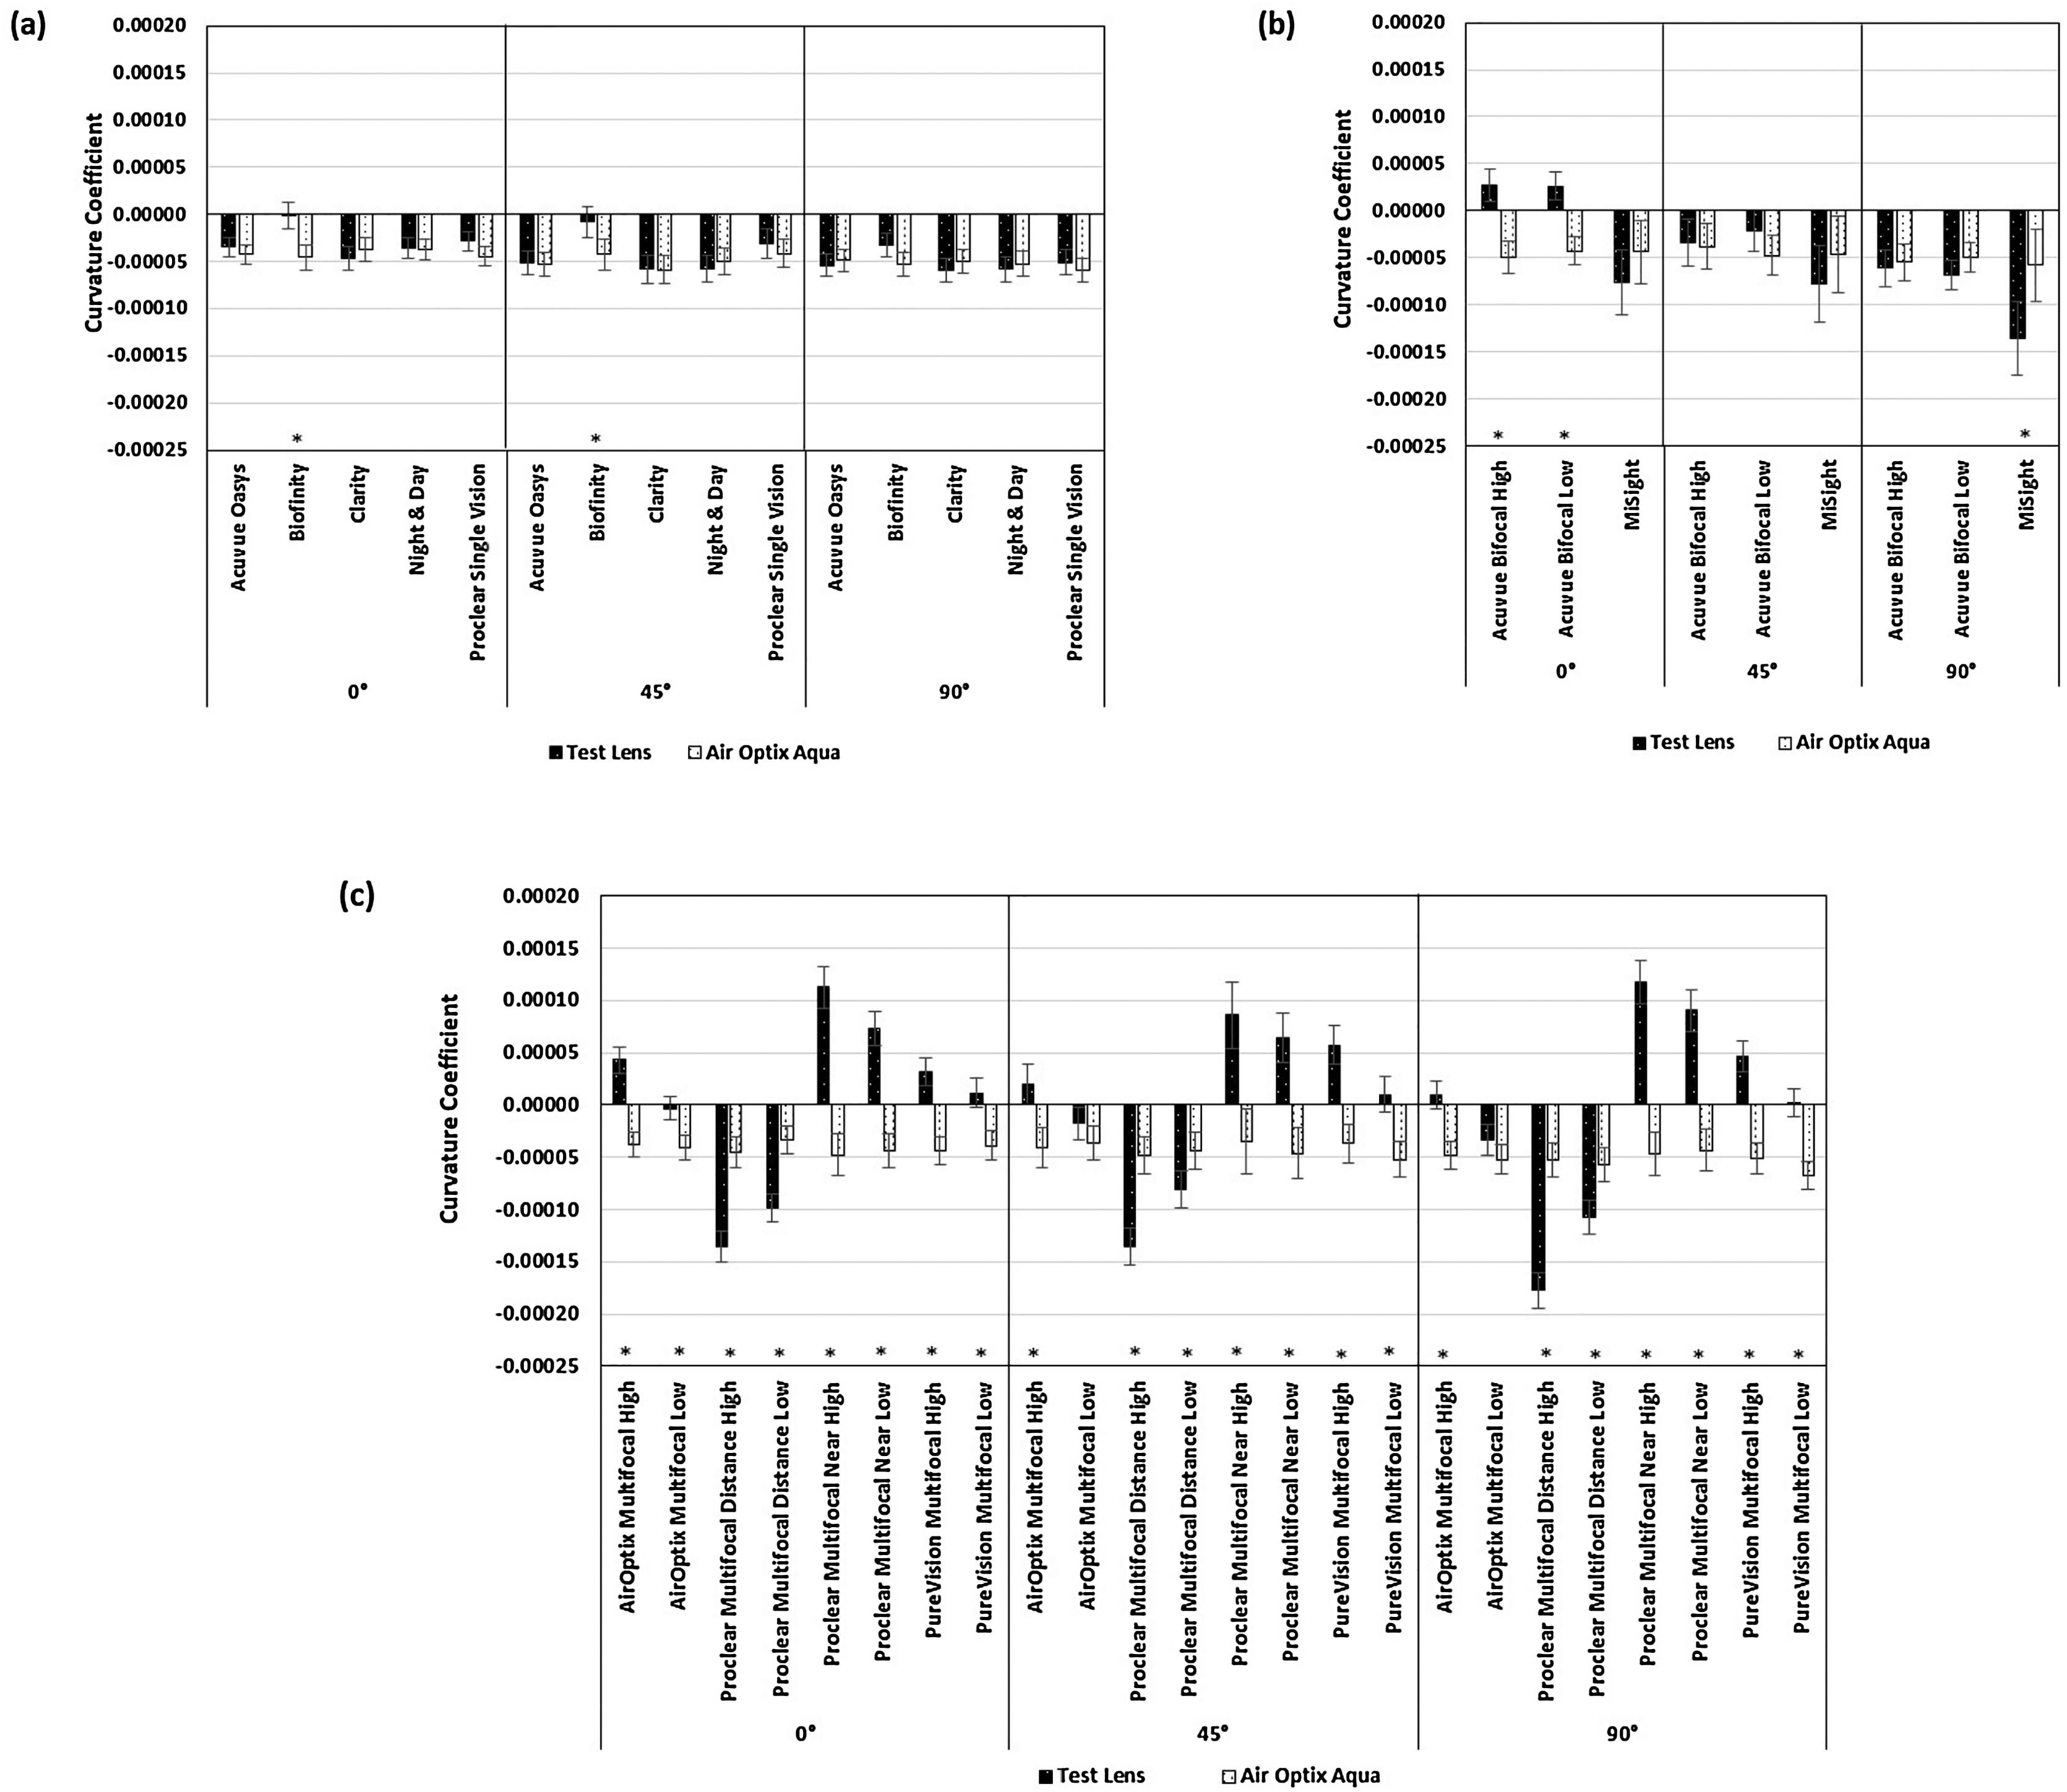
![Comparison of curvature coefficients (SA) between the test contact lenses [(a) single vision, (b) bifocal and (c) multifocal] and AirOptix Aqua (control) contact lens for all three visual field meridians (i.e. 0°, 45° and 90°). Error bars indicate 95% confidence intervals. * indicates overlapping of 95% confidence intervals.](https://static.elsevier.es/multimedia/18884296/0000001300000001/v2_202002131537/S1888429618300980/v2_202002131537/en/main.assets/gr4.jpeg?xkr=ue/ImdikoIMrsJoerZ+w93meMsSv3kCFu9ka1kgzl/xrK32s3f4YRcWD6Dd7AXaruRxaMFA3yot1zg2gK5/R560TApWqJBJAB9mGd+vqFtBa8v/QE0j6hNsWPCVzD3aQ36KXTVd/bgJHJFWRfBhgJ2sYiVONWHbR8gNQCvjtlw2r4F6PKP8z3uXfKZT0SPaI1ahzNJl8T2TKTg7eke7J75crW50uBEpSZJxz/bkS7ZIhZPB1jsdX9jVkxACW9y5fbuyMkKQw0VNwPrqB98tFRX1/wW0RwLpPD9DMkyMZgls= "Comparison of curvature coefficients (SA) between the test contact lenses [(a) single vision, (b) bifocal and (c) multifocal] and AirOptix Aqua (control) contact lens for all three visual field meridians (i.e. 0°, 45° and 90°). Error bars indicate 95% confidence intervals. * indicates overlapping of 95% confidence intervals.")
Comparison of curvature coefficients (SA) between the test contact lenses [(a) single vision, (b) bifocal and (c) multifocal] and AirOptix Aqua (control) contact lens for all three visual field meridians (i.e. 0°, 45° and 90°). Error bars indicate 95% confidence intervals. * indicates overlapping of 95% confidence intervals.
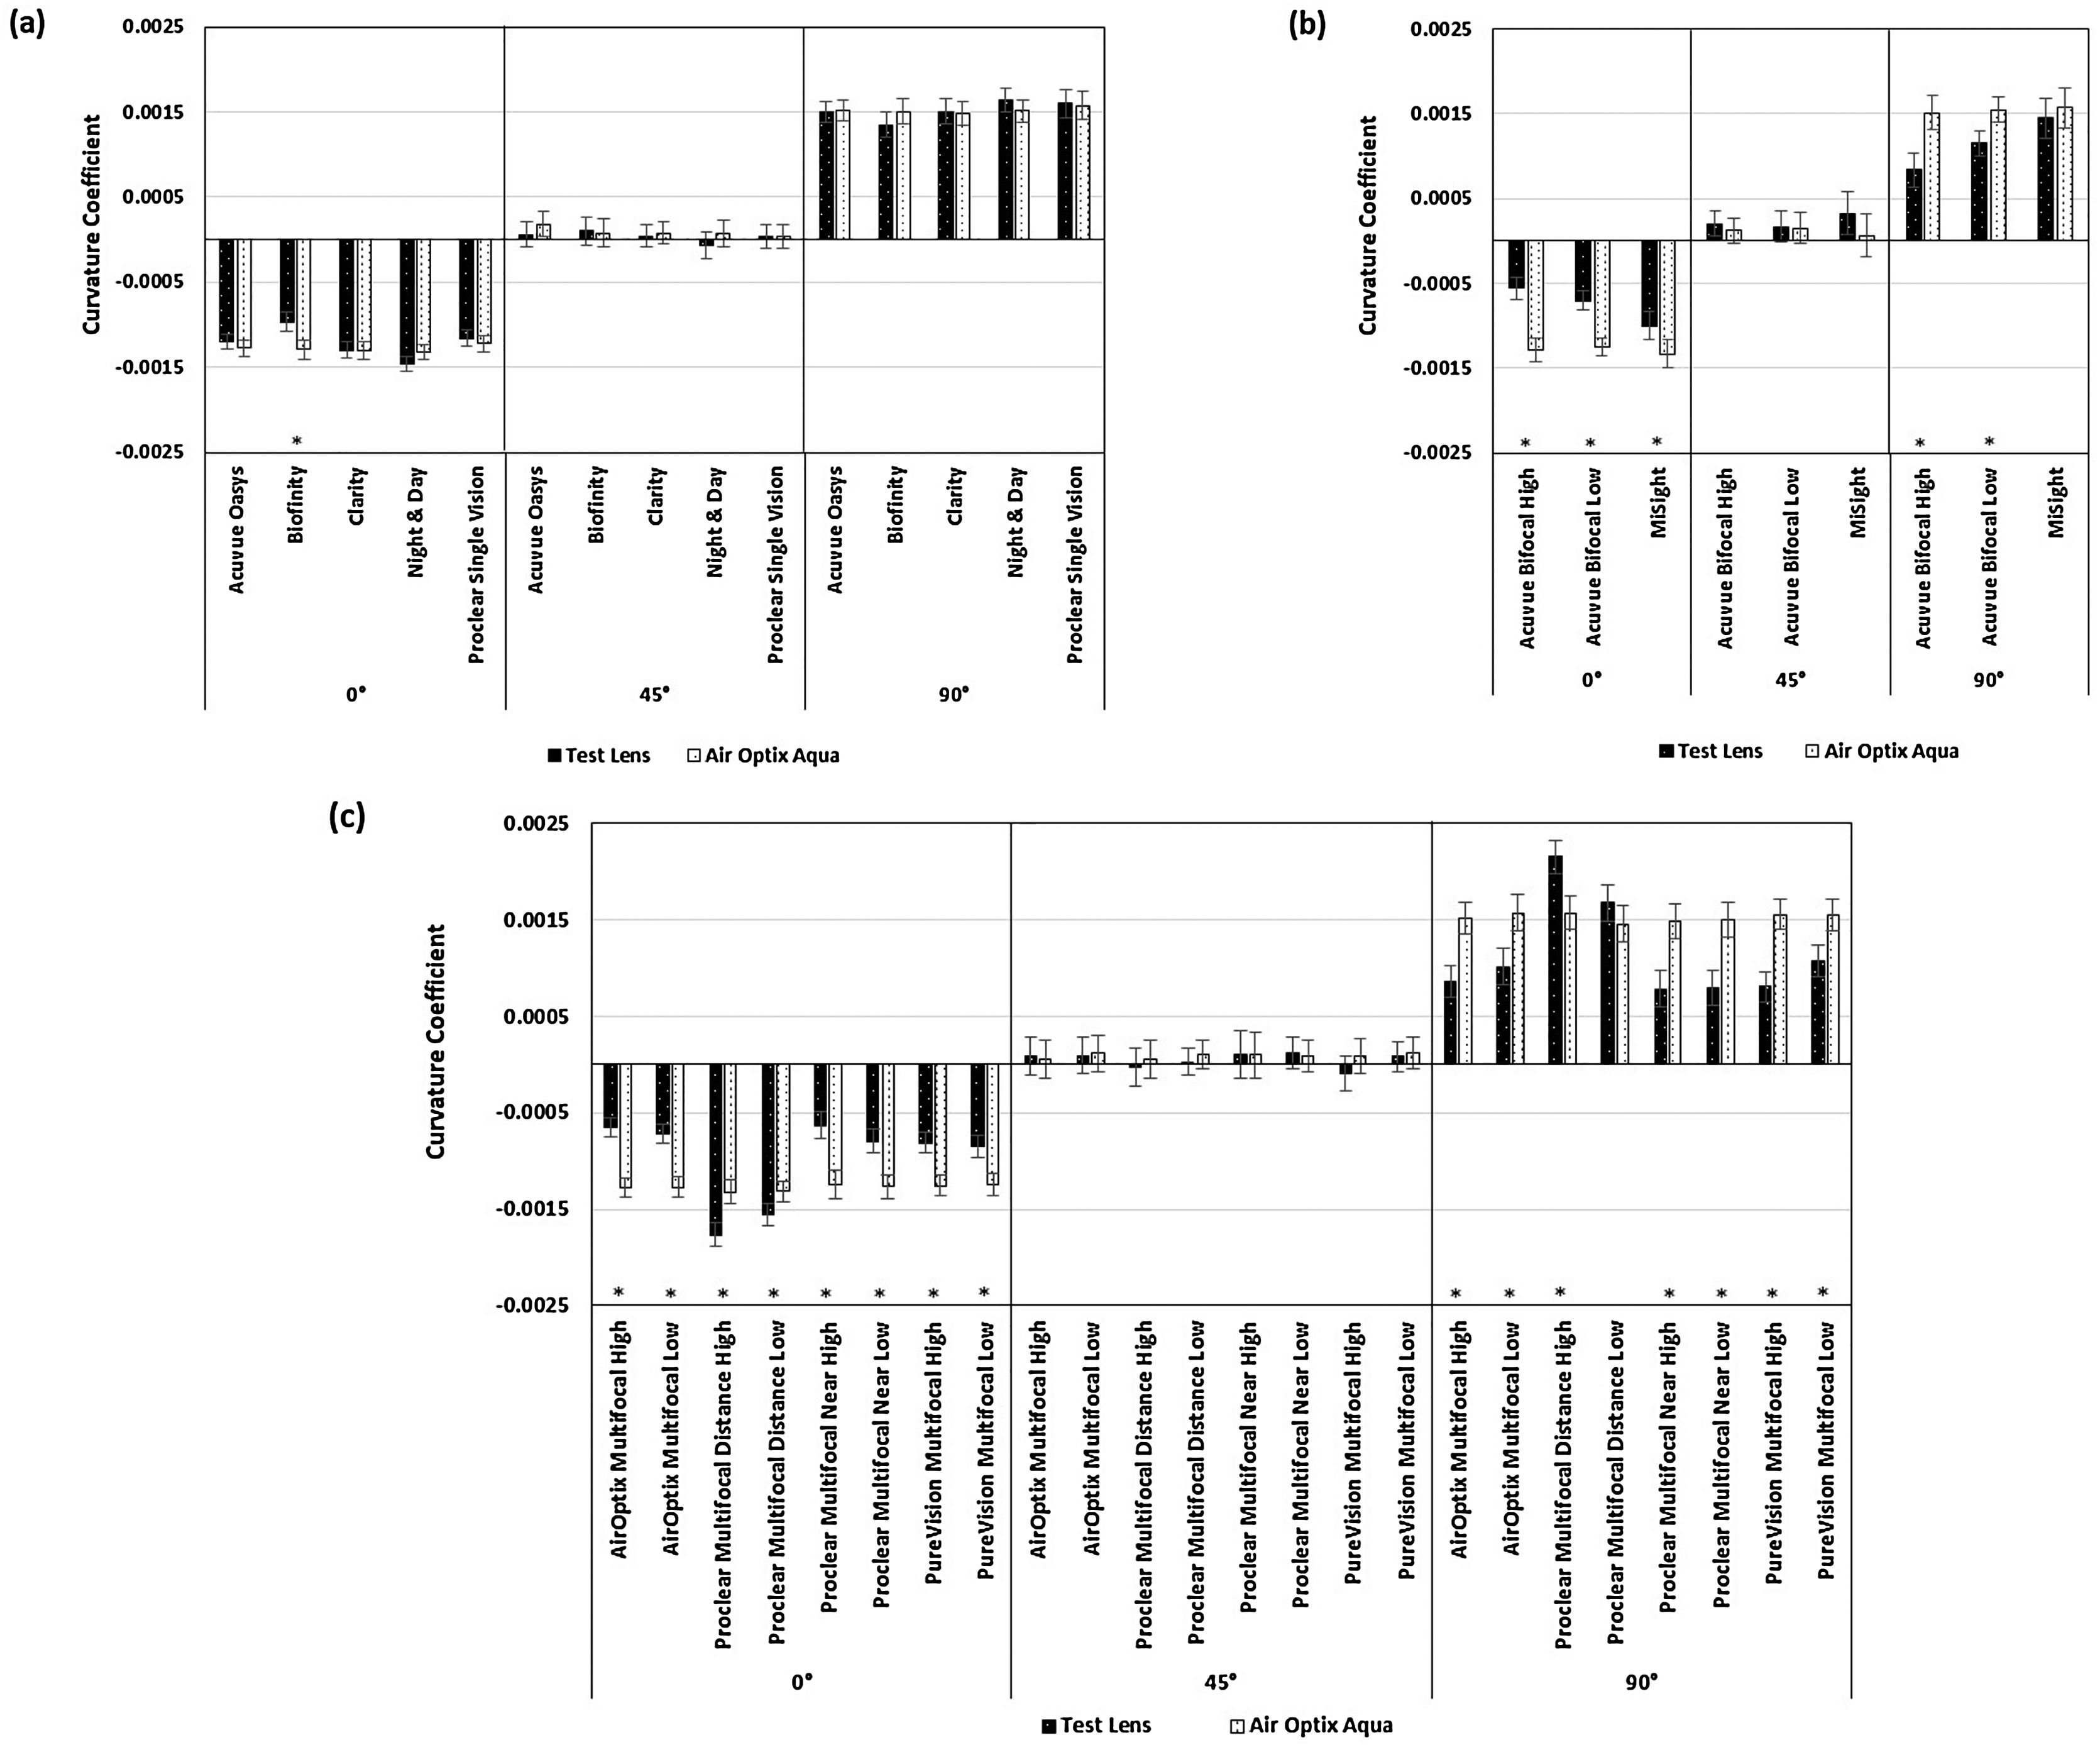
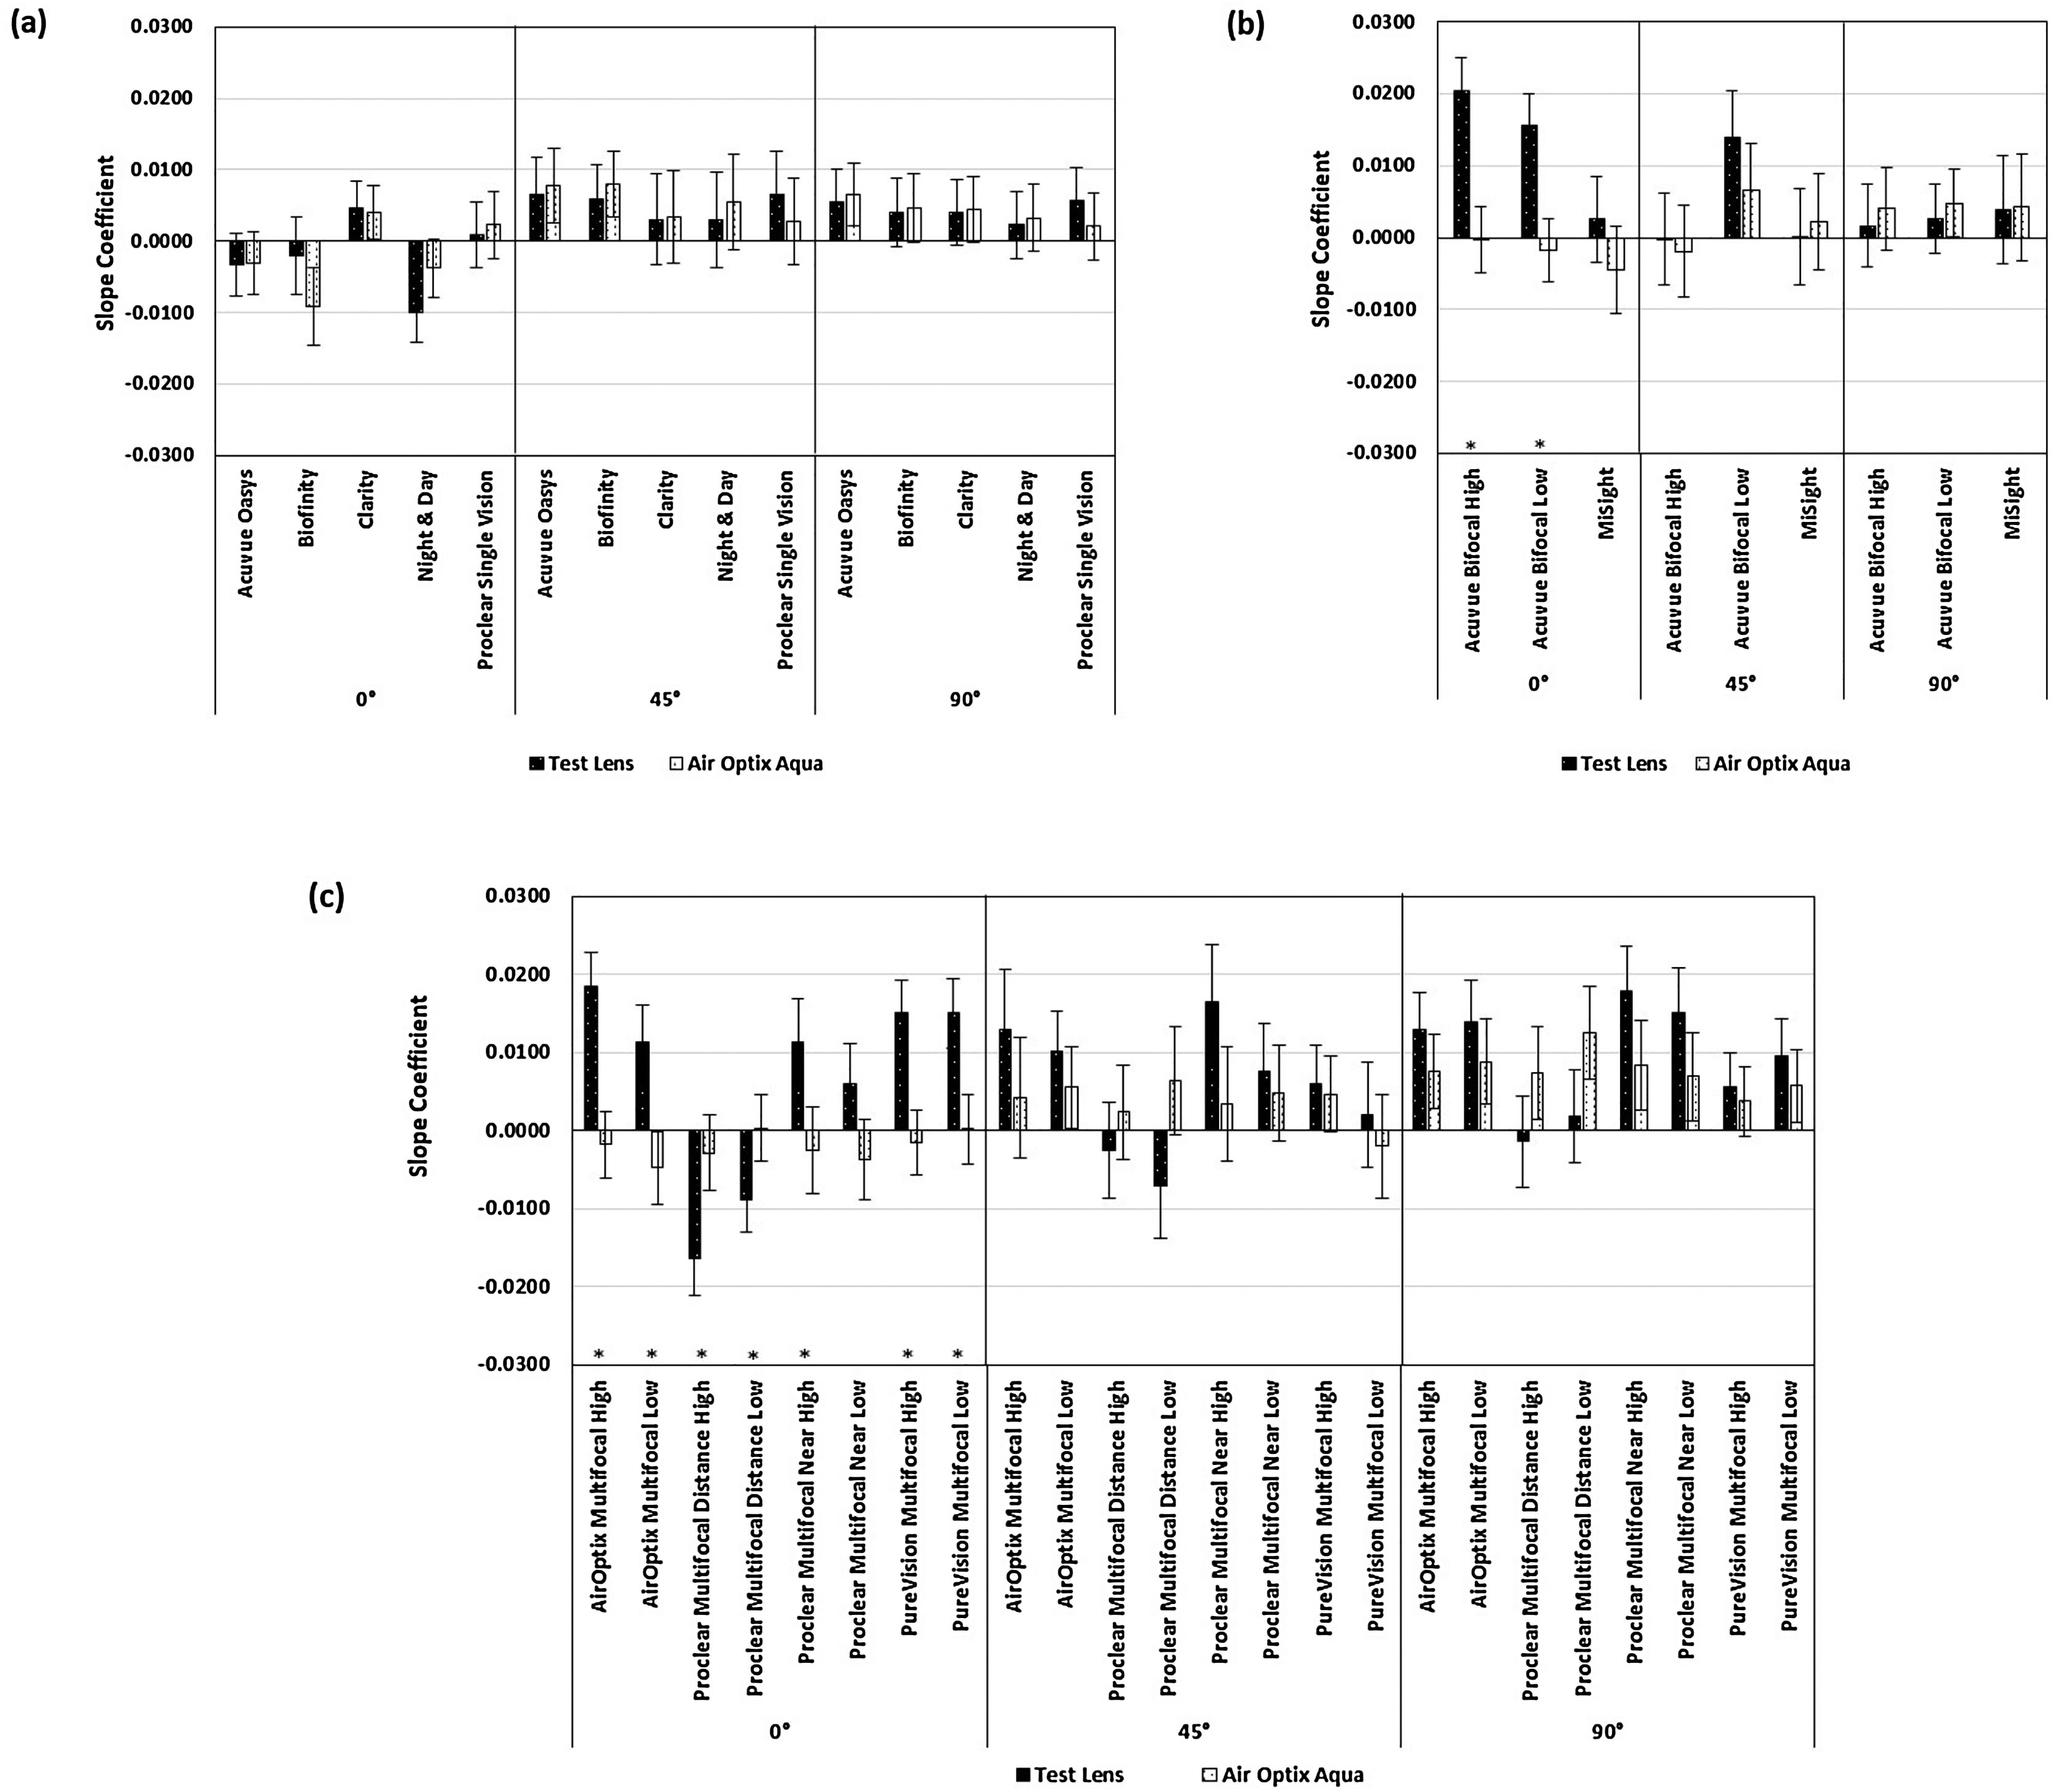
![Comparison of slope coefficients (M) between the test contact lenses [(a) single vision, (b) bifocal and (c) multifocal] and AirOptix Aqua (control) contact lens for all three visual field meridians (i.e. 0°, 45° and 90°). Error bars indicate 95% confidence intervals. * indicates overlapping of 95% confidence intervals.](https://static.elsevier.es/multimedia/18884296/0000001300000001/v2_202002131537/S1888429618300980/v2_202002131537/en/main.assets/gr5.jpeg?xkr=ue/ImdikoIMrsJoerZ+w93meMsSv3kCFu9ka1kgzl/xrK32s3f4YRcWD6Dd7AXaruRxaMFA3yot1zg2gK5/R560TApWqJBJAB9mGd+vqFtBa8v/QE0j6hNsWPCVzD3aQ36KXTVd/bgJHJFWRfBhgJ2sYiVONWHbR8gNQCvjtlw2r4F6PKP8z3uXfKZT0SPaI1ahzNJl8T2TKTg7eke7J75crW50uBEpSZJxz/bkS7ZIhZPB1jsdX9jVkxACW9y5fbuyMkKQw0VNwPrqB98tFRX1/wW0RwLpPD9DMkyMZgls= "Comparison of slope coefficients (M) between the test contact lenses [(a) single vision, (b) bifocal and (c) multifocal] and AirOptix Aqua (control) contact lens for all three visual field meridians (i.e. 0°, 45° and 90°). Error bars indicate 95% confidence intervals. * indicates overlapping of 95% confidence intervals.")
Comparison of slope coefficients (M) between the test contact lenses [(a) single vision, (b) bifocal and (c) multifocal] and AirOptix Aqua (control) contact lens for all three visual field meridians (i.e. 0°, 45° and 90°). Error bars indicate 95% confidence intervals. * indicates overlapping of 95% confidence intervals.
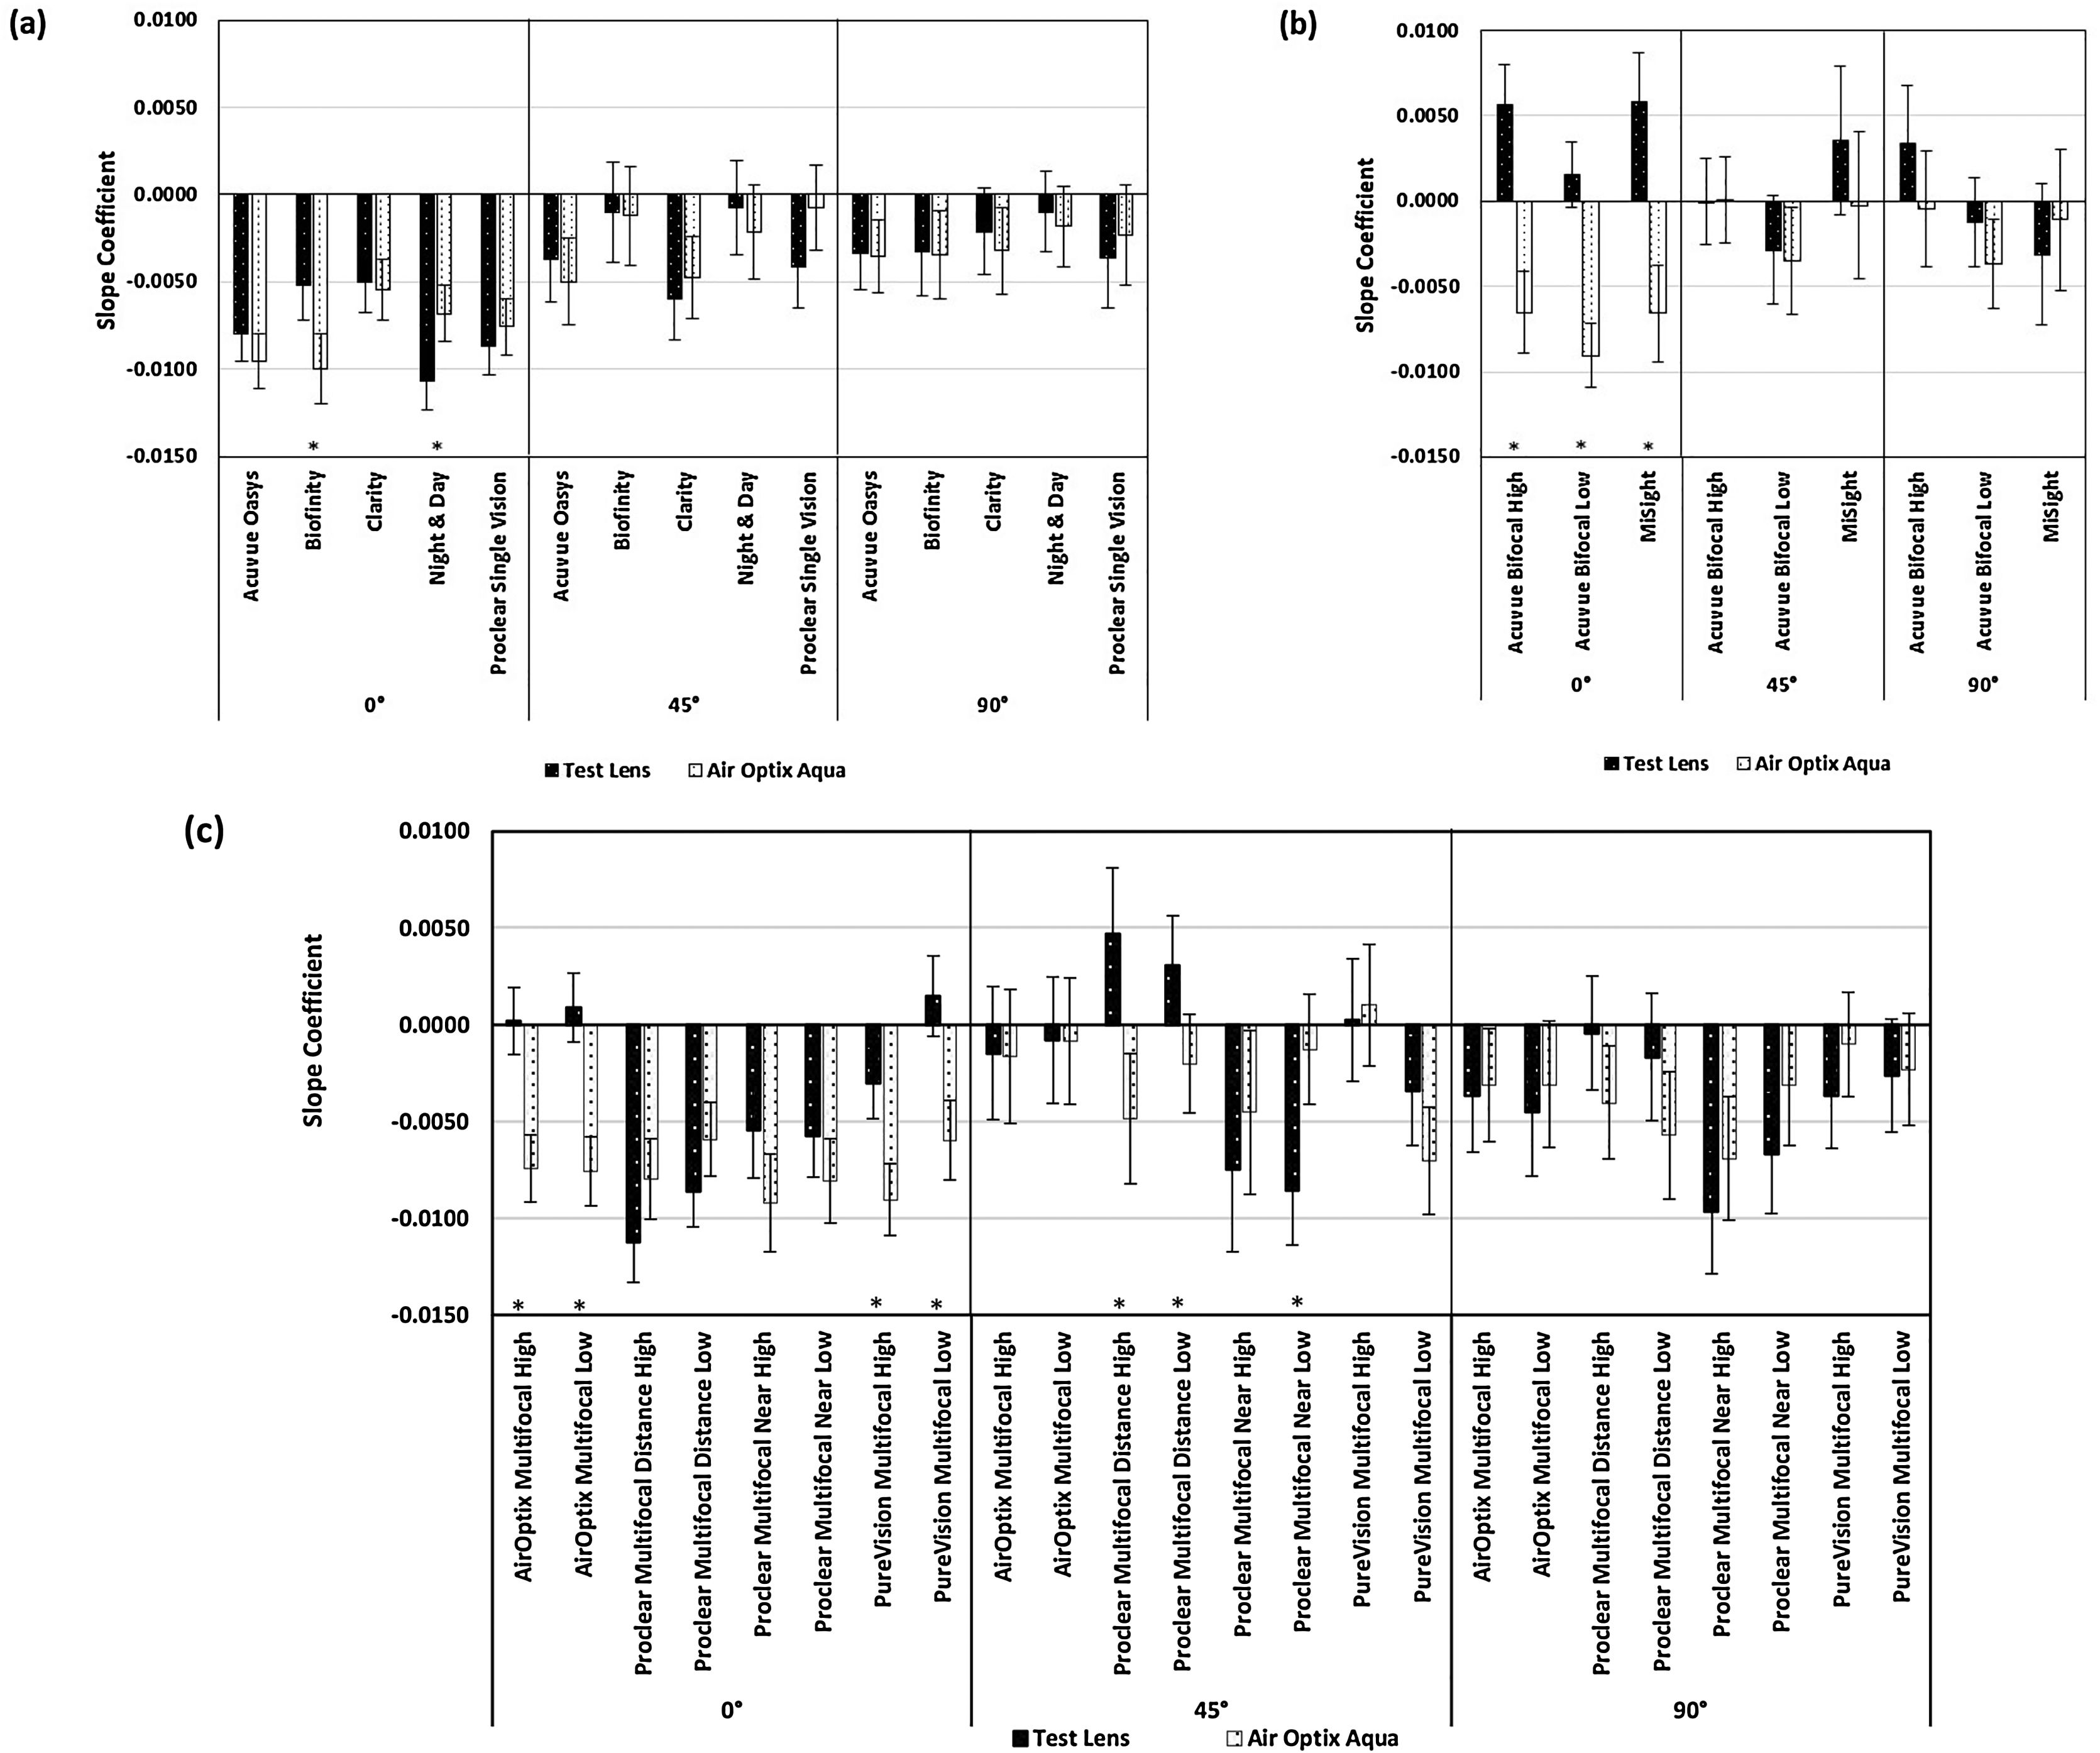
![Comparison of slope coefficients (J0) between the test contact lenses [(a) single vision, (b) bifocal and (c) multifocal] and AirOptix Aqua (control) contact lens for all three visual field meridians (i.e. 0°, 45° and 90°). Error bars indicate 95% confidence intervals. * indicates overlapping of 95% confidence intervals.](https://static.elsevier.es/multimedia/18884296/0000001300000001/v2_202002131537/S1888429618300980/v2_202002131537/en/main.assets/gr6.jpeg?xkr=ue/ImdikoIMrsJoerZ+w93meMsSv3kCFu9ka1kgzl/xrK32s3f4YRcWD6Dd7AXaruRxaMFA3yot1zg2gK5/R560TApWqJBJAB9mGd+vqFtBa8v/QE0j6hNsWPCVzD3aQ36KXTVd/bgJHJFWRfBhgJ2sYiVONWHbR8gNQCvjtlw2r4F6PKP8z3uXfKZT0SPaI1ahzNJl8T2TKTg7eke7J75crW50uBEpSZJxz/bkS7ZIhZPB1jsdX9jVkxACW9y5fbuyMkKQw0VNwPrqB98tFRX1/wW0RwLpPD9DMkyMZgls= "Comparison of slope coefficients (J0) between the test contact lenses [(a) single vision, (b) bifocal and (c) multifocal] and AirOptix Aqua (control) contact lens for all three visual field meridians (i.e. 0°, 45° and 90°). Error bars indicate 95% confidence intervals. * indicates overlapping of 95% confidence intervals.")
Comparison of slope coefficients (J0) between the test contact lenses [(a) single vision, (b) bifocal and (c) multifocal] and AirOptix Aqua (control) contact lens for all three visual field meridians (i.e. 0°, 45° and 90°). Error bars indicate 95% confidence intervals. * indicates overlapping of 95% confidence intervals.
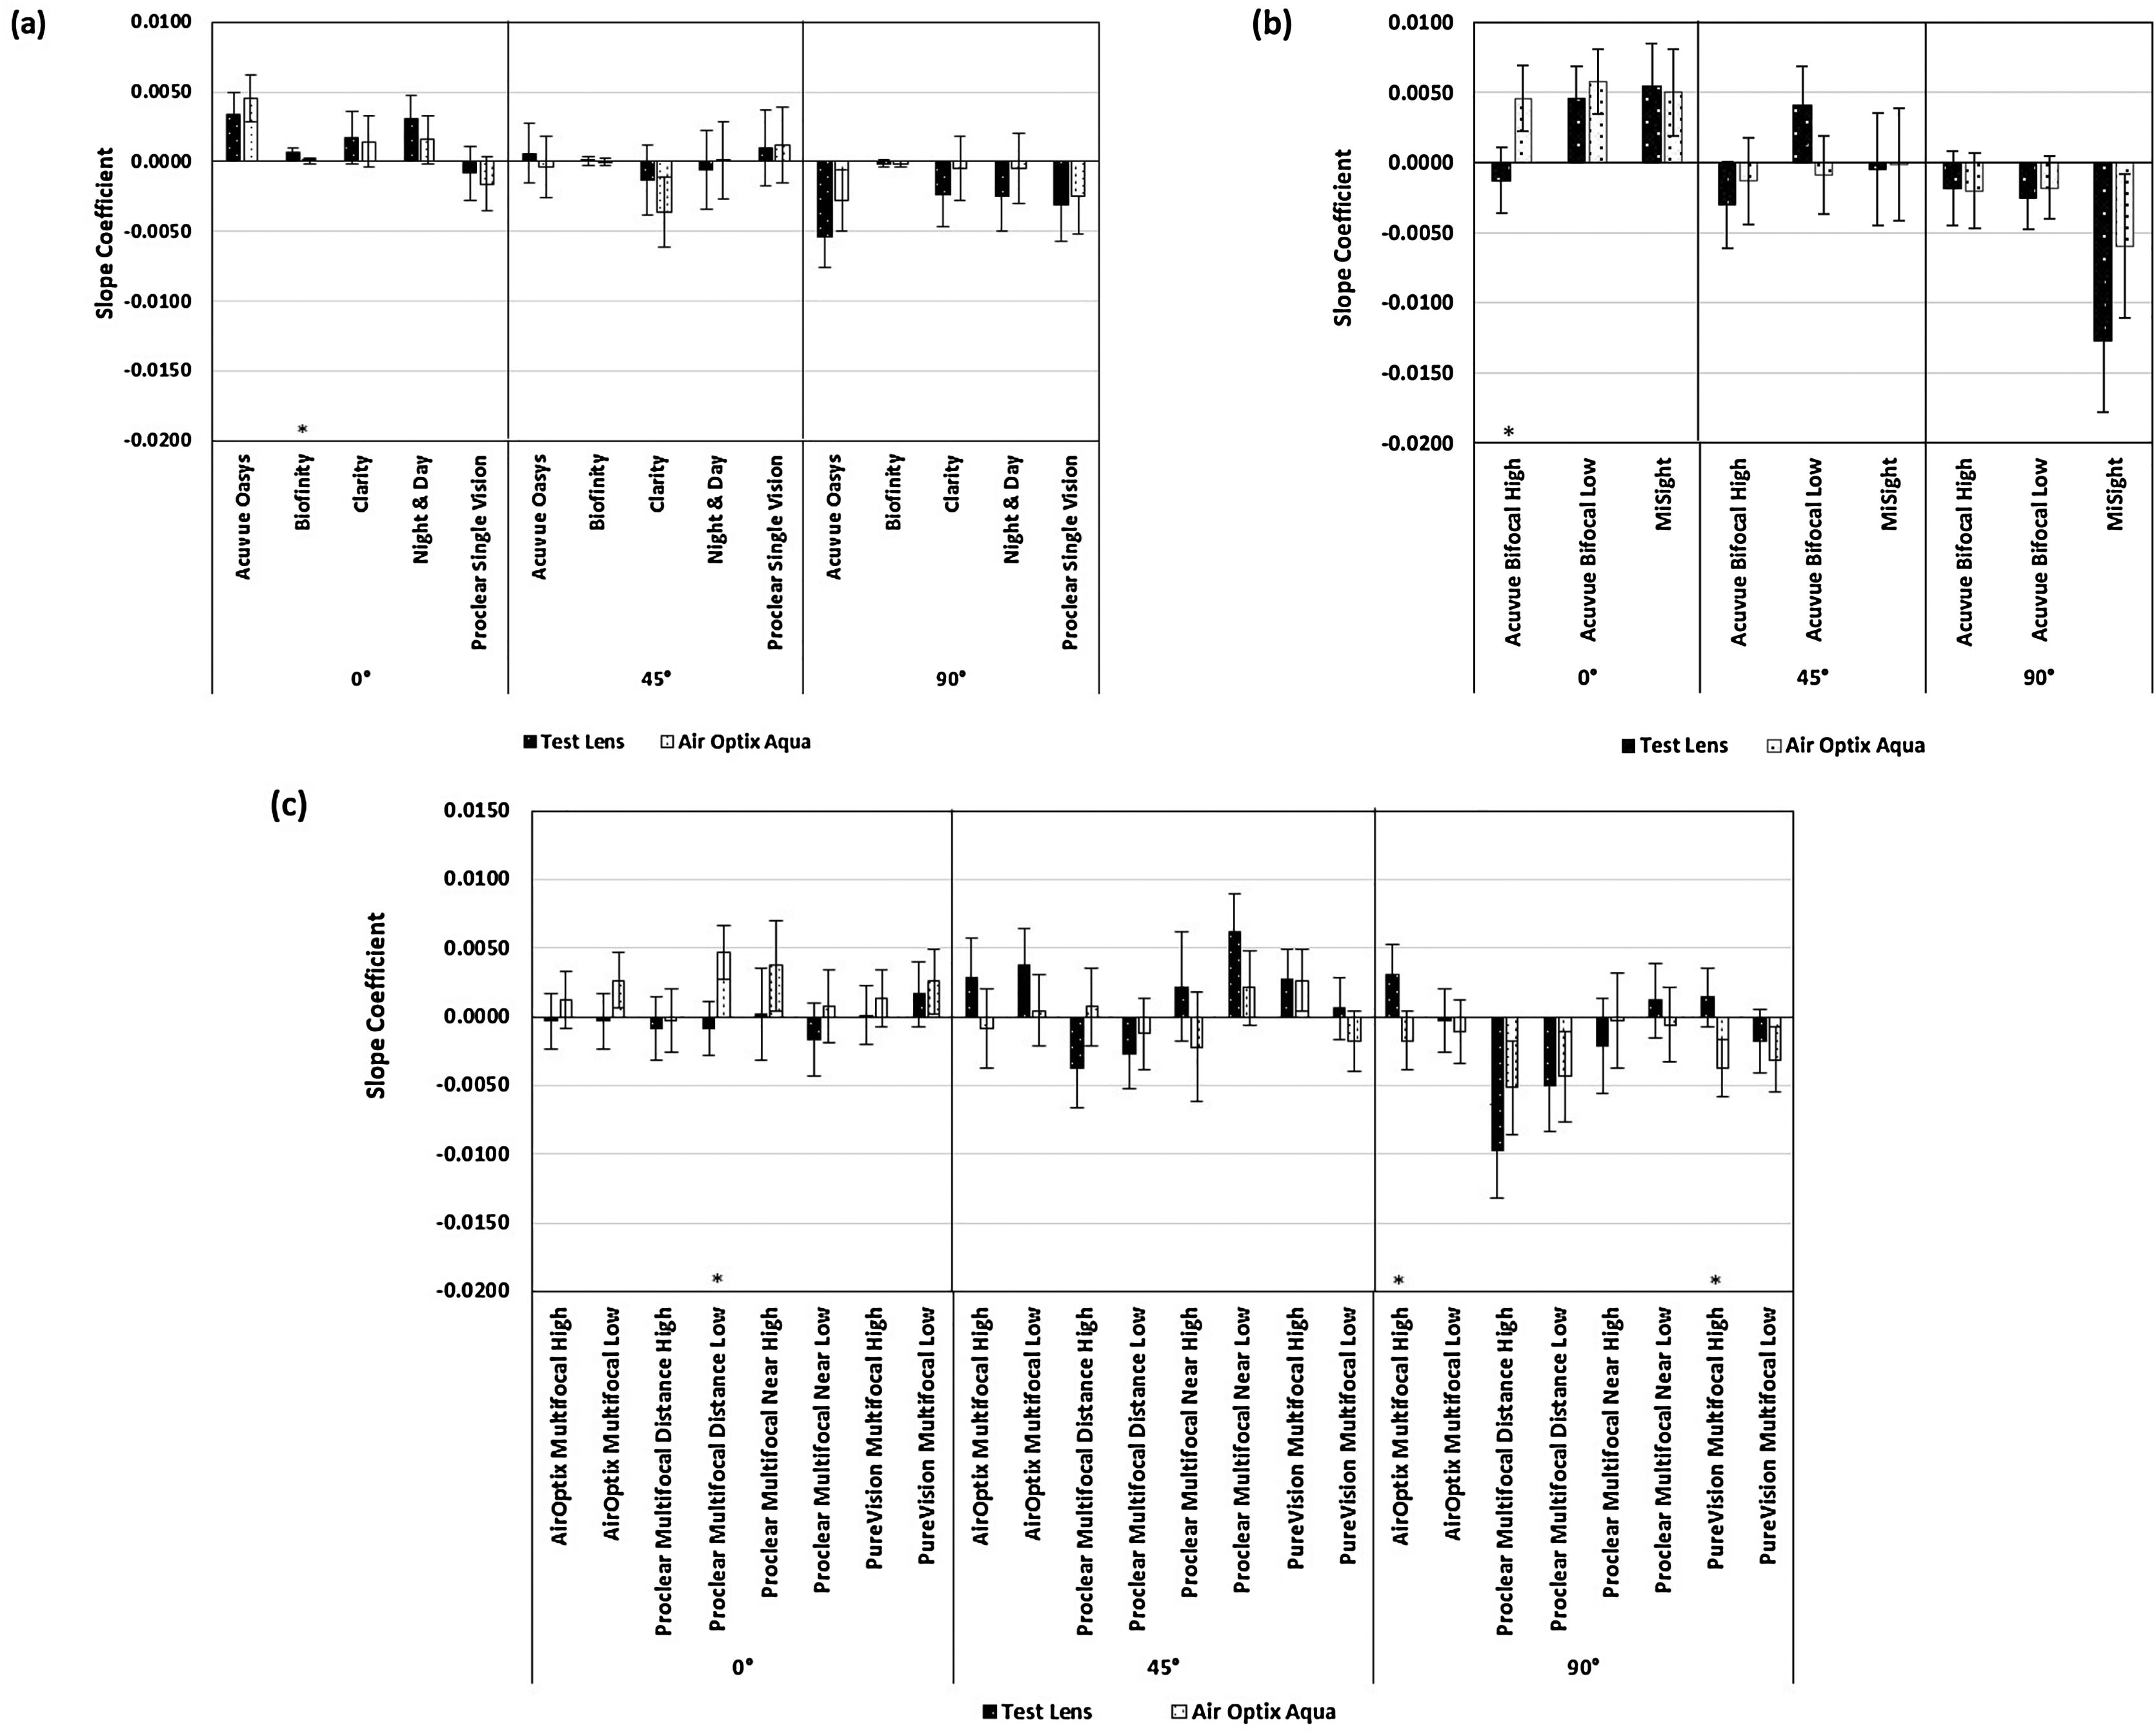
![Comparison of slope coefficients (J45) between the test contact lenses [(a) single vision, (b) bifocal and (c) multifocal] and AirOptix Aqua (control) contact lens for all three visual field meridians (i.e. 0°, 45° and 90°). Error bars indicate 95% confidence intervals. * indicates overlapping of 95% confidence intervals.](https://static.elsevier.es/multimedia/18884296/0000001300000001/v2_202002131537/S1888429618300980/v2_202002131537/en/main.assets/gr7.jpeg?xkr=ue/ImdikoIMrsJoerZ+w93meMsSv3kCFu9ka1kgzl/xrK32s3f4YRcWD6Dd7AXaruRxaMFA3yot1zg2gK5/R560TApWqJBJAB9mGd+vqFtBa8v/QE0j6hNsWPCVzD3aQ36KXTVd/bgJHJFWRfBhgJ2sYiVONWHbR8gNQCvjtlw2r4F6PKP8z3uXfKZT0SPaI1ahzNJl8T2TKTg7eke7J75crW50uBEpSZJxz/bkS7ZIhZPB1jsdX9jVkxACW9y5fbuyMkKQw0VNwPrqB98tFRX1/wW0RwLpPD9DMkyMZgls= "Comparison of slope coefficients (J45) between the test contact lenses [(a) single vision, (b) bifocal and (c) multifocal] and AirOptix Aqua (control) contact lens for all three visual field meridians (i.e. 0°, 45° and 90°). Error bars indicate 95% confidence intervals. * indicates overlapping of 95% confidence intervals.")
Comparison of slope coefficients (J45) between the test contact lenses [(a) single vision, (b) bifocal and (c) multifocal] and AirOptix Aqua (control) contact lens for all three visual field meridians (i.e. 0°, 45° and 90°). Error bars indicate 95% confidence intervals. * indicates overlapping of 95% confidence intervals.
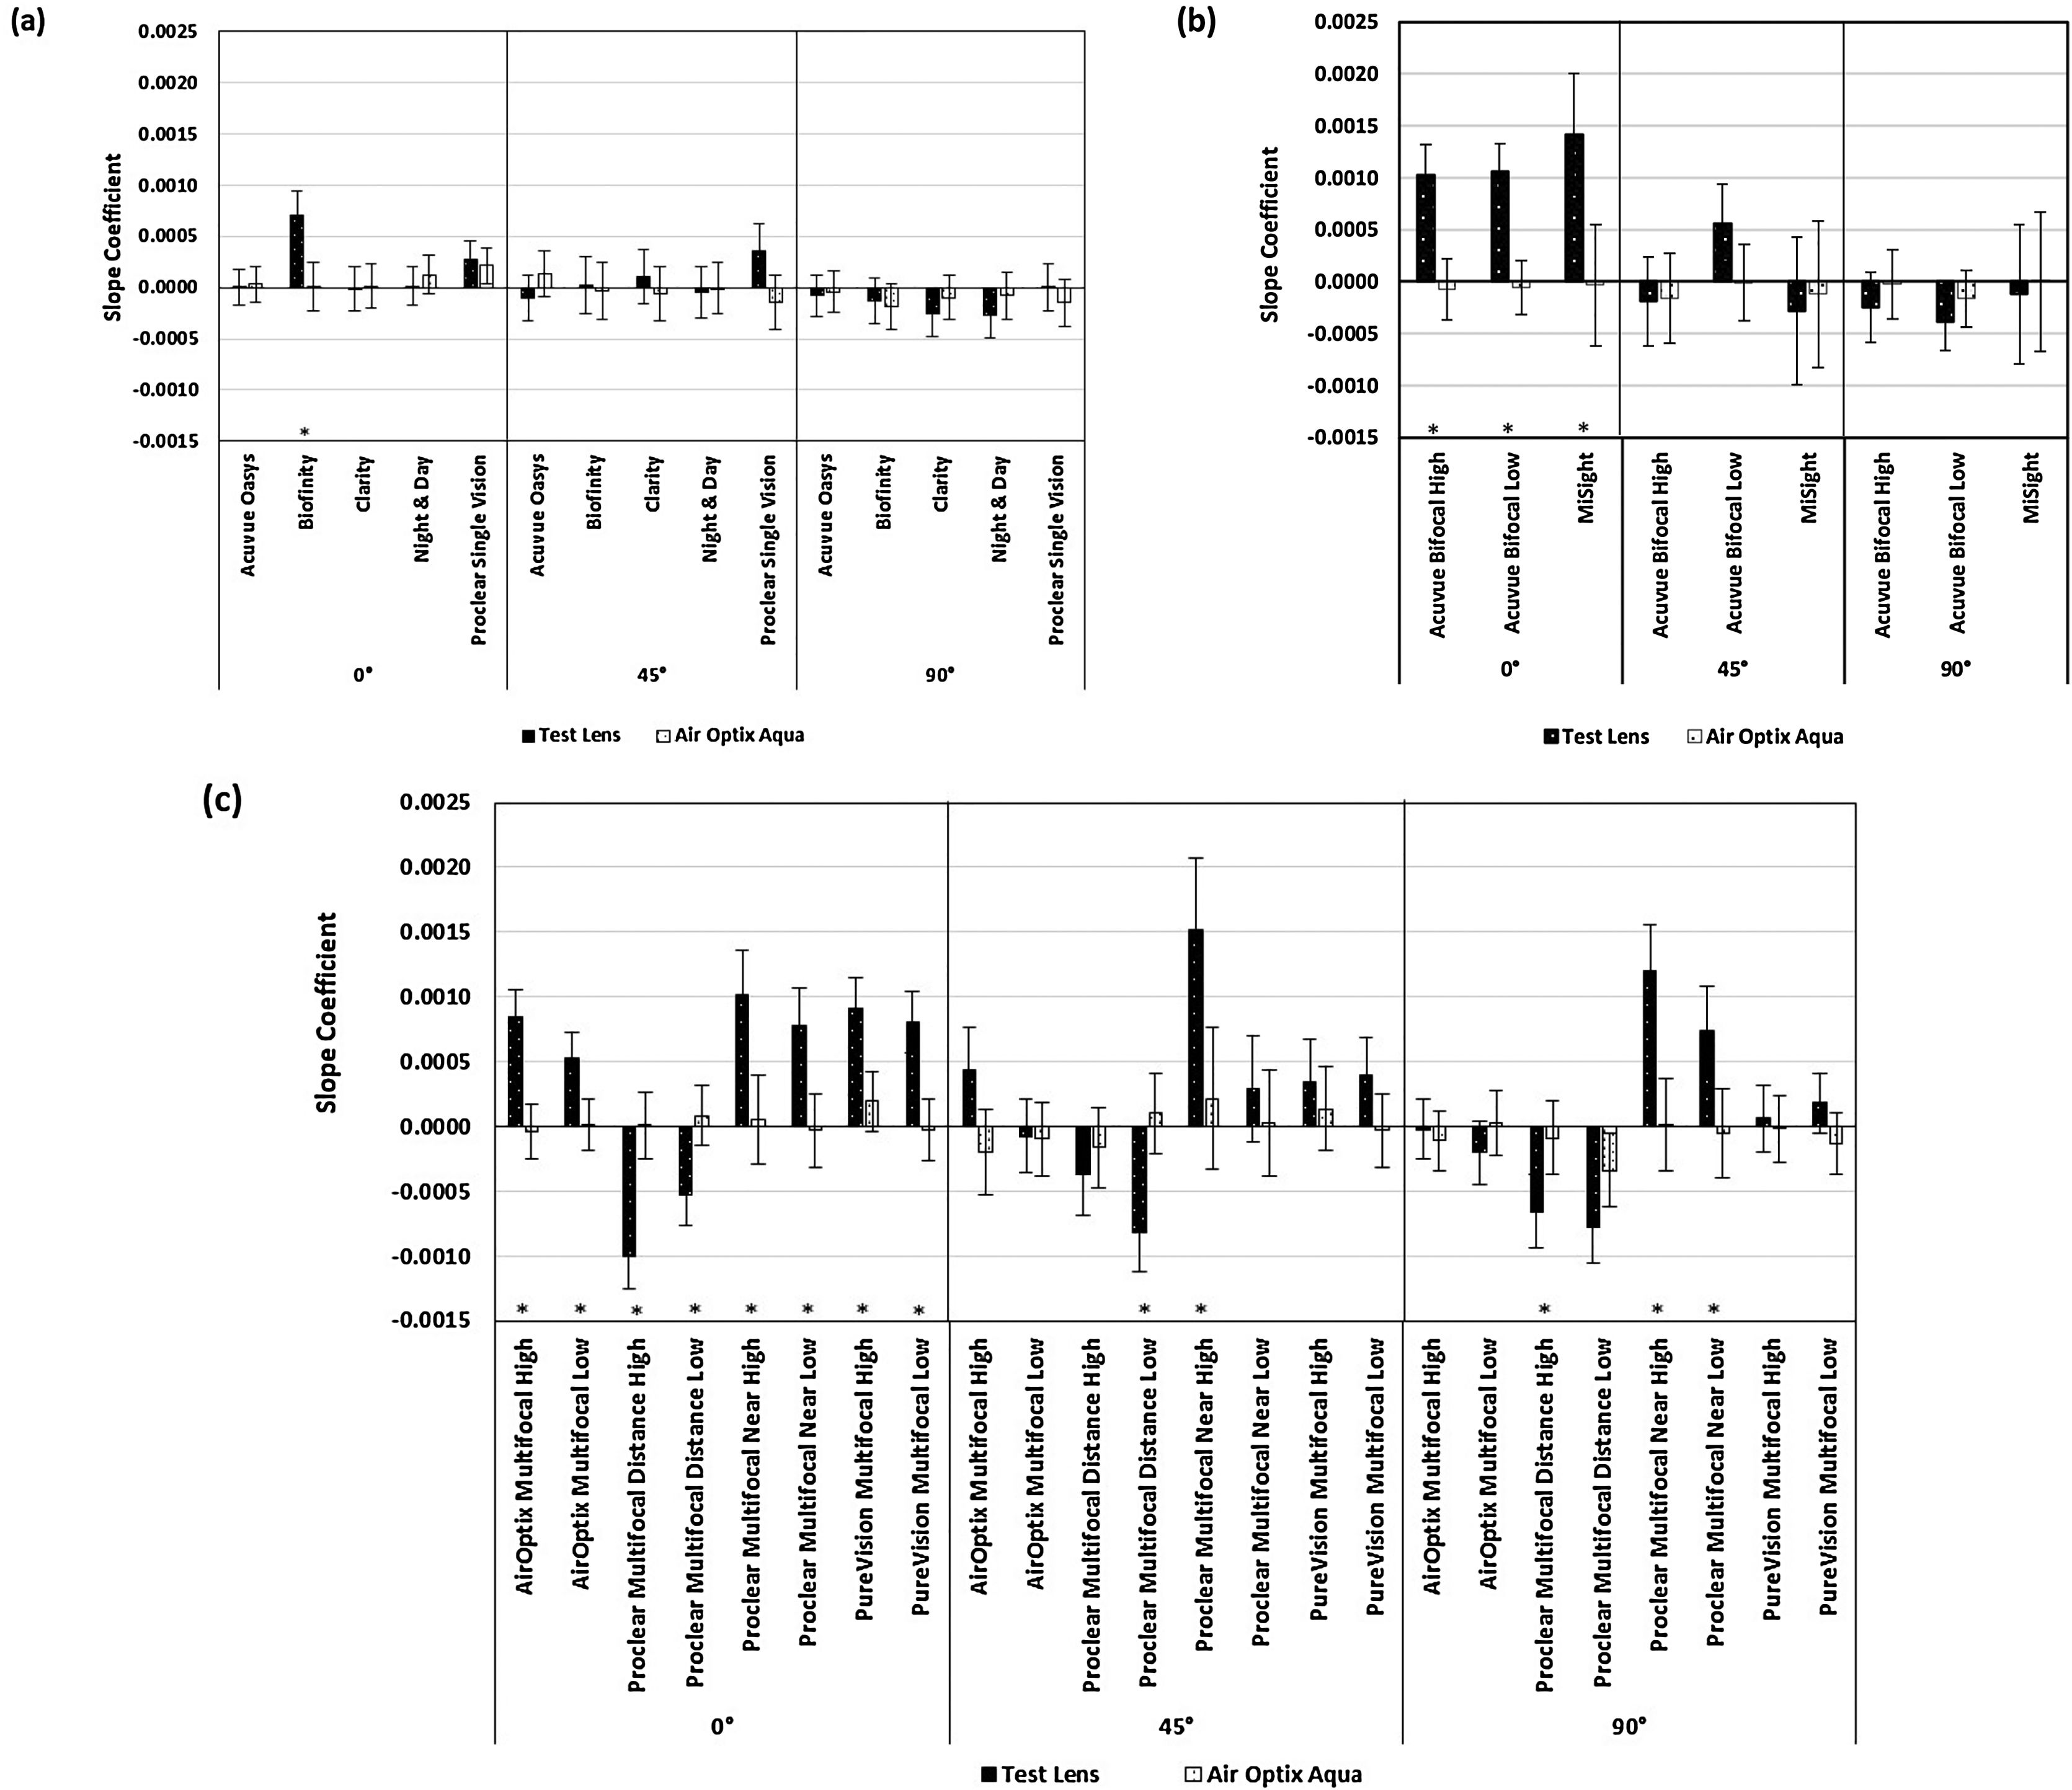
![Comparison of slope coefficients (SA) between the test contact lenses [(a) single vision, (b) bifocal and (c) multifocal] and AirOptix Aqua (control) contact lens for all three visual field meridians (i.e. 0°, 45° and 90°). Error bars indicate 95% confidence intervals. * indicates overlapping of 95% confidence intervals.](https://static.elsevier.es/multimedia/18884296/0000001300000001/v2_202002131537/S1888429618300980/v2_202002131537/en/main.assets/gr8.jpeg?xkr=ue/ImdikoIMrsJoerZ+w93meMsSv3kCFu9ka1kgzl/xrK32s3f4YRcWD6Dd7AXaruRxaMFA3yot1zg2gK5/R560TApWqJBJAB9mGd+vqFtBa8v/QE0j6hNsWPCVzD3aQ36KXTVd/bgJHJFWRfBhgJ2sYiVONWHbR8gNQCvjtlw2r4F6PKP8z3uXfKZT0SPaI1ahzNJl8T2TKTg7eke7J75crW50uBEpSZJxz/bkS7ZIhZPB1jsdX9jVkxACW9y5fbuyMkKQw0VNwPrqB98tFRX1/wW0RwLpPD9DMkyMZgls= "Comparison of slope coefficients (SA) between the test contact lenses [(a) single vision, (b) bifocal and (c) multifocal] and AirOptix Aqua (control) contact lens for all three visual field meridians (i.e. 0°, 45° and 90°). Error bars indicate 95% confidence intervals. * indicates overlapping of 95% confidence intervals.")
Comparison of slope coefficients (SA) between the test contact lenses [(a) single vision, (b) bifocal and (c) multifocal] and AirOptix Aqua (control) contact lens for all three visual field meridians (i.e. 0°, 45° and 90°). Error bars indicate 95% confidence intervals. * indicates overlapping of 95% confidence intervals.
For the single vision test contact lenses (Fig. 1a) no difference in the curvature coefficients was found when compared to the control lens. The curvature coefficients of M for the Acuvue Bifocal high and low add lenses were significantly more positive or less negative (i.e. overlapping of 95% CI intervals) when compared to the control lens (Fig. 1b). This was seen along all three visual field meridians, except the vertical one for the Acuvue Bifocal low add lens. Significantly different curvature coefficients of M were shown for all multifocal contact lenses along all field meridians when compared to the control lens (Fig. 1c). The only exception was the Proclear Multifocal Distance Low Add lens along the 45° visual field meridian, which showed no overlapping of confidence intervals. All center-near multifocal lenses showed a significantly more positive curvature coefficient compared to the control indicating a relatively hyperopic shift along all meridians (also seen in the peripheral ‘red shift’ in the refraction map S1). This hyperopic shift was greatest with the Proclear Multifocal Near High Add lens. The center-distance lenses showed a significantly more negative curvature coefficient compared to the control indicating a relative myopic shift (also seen in the peripheral ‘blue shift’ in the refraction map S1).
Fig. 2a compares the curvature coefficients of J0 between the single vision test lenses and the control lens. Compared to the control lens, the only significant differences were found along the horizontal visual field meridian for the Biofinity lens, which showed a less negative J0 profile. The curvature coefficients of J0 for the bifocal test lenses are shown in Fig. 2b. The Acuvue Bifocal lenses had a significantly less negative and less positive J0 curvature coefficient along the horizontal and vertical visual field meridians, respectively, compared to the control lens. The MiSight lens had also a less negative J0 profile but only along the horizontal field meridian. All center-near multifocal lenses (Fig. 2c) had a significantly less negative curvature coefficient for J0 along the horizontal visual field meridian and a significantly less positive curvature coefficient for J0 along the vertical meridian when compared to the control lens. Both center-distance multifocal lenses had a significantly more negative curvature coefficient for J0 along the horizontal visual field meridian. A more positive curvature coefficient for J0 was also seen for the Proclear Distance High add lens along the vertical meridian.
The curvature coefficients for the J45 profiles are shown in Fig. 3. Out of all single vision test lenses (Fig. 3a) only the Biofinity lens showed a significant difference, i.e. a less negative curvature coefficient than the control lens along the oblique visual field meridian. When compared to the control lens, a significantly less negative J45 curvature coefficient along the oblique meridian was also found for the Acuvue Bifocal High and Low add lenses (Fig. 3b) and for all center-near multifocal contact lenses, except for the Proclear Multifocal Near High Add lens (Fig. 3c). The Proclear Multifocal Distance High add lens had a significantly more negative J45 curvature coefficient along the oblique meridian (Fig. 3c, also seen in the oblique ‘blue shift’ in the refraction map S3).
Fig. 4 compares the curvature coefficients of the spherical aberration profiles between the control and the test lenses. Out of all single vision lenses (Fig. 4a), the Biofinity lens showed a significantly less negative curvature coefficient along the entire horizontal and the oblique meridians. The spherical aberration curvature coefficients of the bifocal lenses are shown in Fig. 4b. Along the horizontal field meridian, the curvature coefficients of both Acuvue Bifocal lenses were significantly more positive and along the vertical meridian, the curvature coefficient of the MiSight lens was significantly more negative. All center-near multifocal lenses (Fig. 4c) showed a significantly more positive spherical aberration curvature coefficient along all three visual meridians compared to the control lens (also seen in the peripheral ‘blue and red shifts’ in the aberration maps S4 of the Proclear Multifocal Near lens), except for the AirOptix Multifocal Low Add lens along the oblique and the vertical meridians. Conversely, all coefficients for the center-distance multifocal lenses (Fig. 4c) were significantly more negative (also seen in the peripheral ‘blue and red shifts’ in the spherical aberration maps S4).
Fig. 5 compares the slope coefficients for M between the entire test and the control contact lenses. Only along the horizontal visual field meridian were significant differences found for the slope coefficients. The slope coefficients for both Acuvue Bifocal lenses (Fig. 5b) and all center-near multifocal contact lenses (Fig. 5c) were significantly more positive (i.e. corresponding to a more positive M in the nasal visual field) than the control. The center-distance lenses had significantly more negative coefficients (i.e. corresponding to a more negative M in the nasal visual field).
The J0 slope coefficients for the single vision contact lenses are shown in Fig. 6c. The only test lenses with significant differences compared to the control were the Biofinity lens, which had a less negative coefficient and the Night and Day lens, which had a more negative coefficient. Compared to the control lens, all three bifocal lenses (Fig. 6b) and all center-near multifocal lenses, except for the Proclear Multifocal lenses (Fig. 6c) had significantly more positive or less negative J0 slope coefficients along the horizontal visual field meridian. Significant differences were also found along the oblique meridian for the two center-distance lenses which had slope coefficients that were more positive than the control and for the Proclear Multifocal near Low add lens which had a more negative slope coefficient.
Fig. 7 compares the J45 slope coefficients between the control and the test lenses. Although some significant differences were found, overall these differences were small. The greatest difference was seen in the Proclear Multifocal Distance Low add lens (Fig. 7c) along the horizontal visual field meridian, which had a significantly more positive slope coefficient than the control.
The spherical aberration slope coefficients of all lenses are shown in Fig. 8. The greatest differences were seen along the horizontal visual field meridian. Whilst for the single vision lenses (Fig. 8a) only the Biofinity lens showed a significant more positive coefficient than the control, all bifocal (Fig. 8b) and all center-near multifocal lenses (Fig. 8c) had a significantly more positive slope coefficient along the horizontal meridian. Conversely, the two center-distance multifocal lenses had a more negative slope coefficient than the control in the horizontal meridian. The Proclear Multifocal Distance Low and High add lenses also had a significantly more negative slope coefficient along the oblique and the vertical meridian, respectively. Conversely, the Proclear Multifocal Near High and Low add lenses had a more positive coefficient along one or both of those meridians.
DiscussionThe present study showed that the differences between contact lens designs, i.e. the power profiles, are also reflected in the peripheral refraction and spherical aberration profiles when the lenses are worn on eye. The curvature and slope coefficients permit a comparison in refraction differences between the different lens designs across the visual field, i.e. the horizontal, vertical and oblique visual field. This information may be helpful for the comparison of current or other potential myopia control products.
The power profile measurements by Wagner et al.,25 compared the same single vision contact lenses as tested in the current study, which showed that out of all lenses only the Focus Night & Day lens featured some positive spherical aberration and the Biofinity lens was the lens with the most negative spherical aberration. Whilst the same trend can be seen in the curvature coefficients of the peripheral refraction and the spherical aberration profiles and maps of this study, significant differences to the control lens in the curvature coefficients were only found for the Biofinity lens and these differences were only with respect to J0, J45 and the spherical aberration coefficient along the horizontal and/or the oblique visual field meridians. Should myopia progression solely be governed by the ‘relative peripheral hyperopia theory’ then a single vision contact lens with sufficient positive spherical aberration might slow eye growth without compromising vision.39 However, further studies are required to assess the amount of positive spherical aberration that is required for such a single vision lens in order to achieve a clinically significant reduction of myopia progression.
The ‘myopia control’ efficacy for center-distance multifocal21 and the MiSight19 contact lenses is known, and the more negative curvature coefficients of M and the spherical aberration coefficient as well as the general ‘blue’ shift in the refraction maps (M), particularly in the periphery, when compared to the control lens supports the theory that reducing relative peripheral hyperopic defocus with such lenses could slow myopia progression. The relative peripheral myopic shift with the Proclear Multifocal Distance lenses, the positive spherical aberration in the center and the negative spherical aberration in the periphery, is in agreement with the previously measured power profiles,25,26 on-axis spherical aberration39 and horizontal peripheral refraction and spherical aberration measurements.33 A few other studies have also measured horizontal peripheral refraction through center-distance multifocal contact lenses using the Shin-Nippon autorefractor.28,30,31,34 The study by Allinjawi et al.34 found no significant changes in peripheral refraction measurements with the low Add Proclear Multifocal Distance lens, however the refraction and spherical aberration profiles in the current study showed a considerable negative shift with this lens when compared to the control. In agreement with our results, Lopes-Ferreira et al.28 compared low and high Add center-distance designs, showing, as anticipated, a greater peripheral myopic shift with the high Add lens, however, the relative myopic shift was greater in the temporal visual field rather than in the nasal visual field, as seen in the current and two other studies.30,31 The peripheral refraction profile and the refraction map of J0 for the Proclear Multifocal Distance lens also agrees well with previous horizontal refraction profile measurements, showing an increase in peripheral J0.30–32 As mentioned before, some of the differences seen between peripheral refraction results with multifocal contact lenses on eye can be attributed to the differences in the instruments used,32 i.e. autorefractor (Shin-Nippon) versus aberrometer (BHVI-EyeMapper), but decentration of contact lenses33 and instrument and/or head/eye alignment40 could also affect peripheral refraction measurements.
All center-near multifocal contact lenses produced a significantly more positive curvature coefficient in the peripheral refraction and spherical aberration profiles when compared to the control, and the refraction maps showed a peripheral 'red shift' and a central ‘blue shift’. To date no studies have published myopia control efficacy using center-near multifocal contact lenses. Whether this central ‘blue shift’ would suffice to send a myopia stop signal warrants further investigation.
Although using an aberrometer for central and peripheral refraction measurements with multifocal contact lenses on eye was found to be more appropriate than using an auto-refraction instrument such as the Shin Nippon,32 there are still some instrument limitations, in particular when measuring through lenses with a non-aspheric profile, such as bifocal contact lenses. Specifically, measurements with an aberrometer, such as the BHVI-EyeMapper, capture the wavefront across the entire pupil through the lens and hence, provide an averaged refraction per visual field angle for a given pupil size. A comparison between the power profiles and refraction maps for bifocal lenses is therefore limited. Nevertheless, when compared to the control lens, the refraction profiles obtained with bifocal lenses provide a good estimate of the relative averaged refraction changes across the visual field.
ConclusionWhen worn on eye, different commercially available lens types produce differences in the direction and magnitude of the peripheral refraction and spherical aberration profiles along different visual field meridians. This information may be relevant to refractive development and myopia control.
FundingThis project was entirely funded by the Brien Holden Vision Institute. The Institute has proprietary interests in the intellectual property governing the BHVI-EyeMapper and devices for myopia control. The Institute receives royalties from the sale of AirOptix Multifocal lenses.
Conflicts of interestRC Bakaraju: None; C Fedtke: AU2011902736; J Chung: None; D Falk: AU2011902736; K Ehrmann: WO 2008/116270 A1, AU2011902736.
The following are the supplementary data to this article:


