


We studied the accuracy and precision of 32 objective wavefront methods for finding the amplitude of accommodation obtained in 180 eyes.
MethodsOcular accommodation was stimulated with 0.5 D steps in target vergence spanning the full range of accommodation for each subject. Subjective monocular amplitude of accommodation was measured using two clinical methods, using negative lenses and with a custom Badal optometer.
ResultsBoth subjective methods gave similar results. Results obtained from the Badal optometer where used to test the accuracy of the objective methods. All objective methods showed lower amplitude of accommodation that the subjective ones by an amount that varied from 0.2 to 1.1 D depending on the method. The precision in this prediction also varied between subjects, with an average standard error of the mean of 0.1 D that decreased with age.
ConclusionsDepth of field increases subjective of amplitude of accommodation overestimating the objective amplitude obtained with all the metrics used. The change in the negative direction of spherical aberration during accommodation increases the amplitude of accommodation by an amount that varies with age.
Estudiamos la exactitud y la precisión de 32 métodos objetivos de calidad de imagen aplicados al frente de onda ocular y utilizados para calcular la amplitud de acomodación en 180 ojos.
MétodosSe estimuló la acomodación ocular modificando la vergencia del estímulo a pasos de 0,5 D, de forma que se cubriese todo el rango de acomodación de cada sujeto. Se midió la amplitud de acomodación monocular subjetiva utilizando dos métodos habituales en la práctica clínica: uno basado en el uso de lentes negativas y otro basado en un optómetro de Badal adaptado.
ResultadosCon ambos métodos subjetivos se obtuvieron resultados parecidos. Los resultados obtenidos con el método basado en el optómetro de Badal se utilizaron para evaluar la exactitud de los métodos objetivos. En todos los casos, con todos los métodos objetivos se obtuvo una menor amplitud de acomodación que con los subjetivos; la diferencia entre ambos tipos osciló entre 0,2 D y 1,1 D, dependiendo de cada sujeto concreto. La precisión de esta estimación también varió entre un sujeto y otro: el error estándar de la media fue, en promedio, igual a 0,1 D, disminuyendo con la edad.
ConclusionesLa profundidad de campo aumenta la amplitud de acomodación subjetiva que sobrestima los valores objetivos encontrados por cualquiera de las métodos objetivos usados. Los resultados indican que la variación, hacia valores más negativos, de la aberración esférica durante el proceso de acomodación hace que aumente la amplitud de acomodación en una cantidad que varía con la edad.
Accommodation in humans is achieved by a change in the dioptric power of the crystalline lens.1 The accommodative system maintains the image plane close to the entrance apertures of the foveal cone photoreceptors, even as the distance of an object changes. For the most part, accommodation and its reduction with age have been measured classically using two subjective methods: the push-up2 and the minus-lens3 techniques. Although a subjective test provides important information about near visual ability, it does not accurately measure the accommodative optical change that occurs in the eye. This is because the eye's depth-of-field causes subjective measurements to overestimate the objectively measured accommodative amplitude4,5 unencumbered by depth-of-field effects. For example, open-field-of-view autorefractors6-9 are commonly used to obtain accurate, objective measurements of accommodation.8-12 One purpose of the present study was to develop a novel method based on wavefront technology.
Recently, largely due to the development of clinical wavefront aberrometers, we are able to apply wavefront technology to measure ocular aberrations when the eye accommodates.13-18 Wavefront aberrometers provide a detailed description of the eye's focusing power at every point in the eye's pupil. Converting these detailed measurements into a clinical prescription for the ideal sphero-cylindrical correction is a process called wavefront refraction.19 One approach to wavefront refraction is to fit the two-dimensional wavefront aberration function with a quadratic surface that represents the wavefront produced by the optimum spherocylindrical lens. The two most common ways to perform this fit are least-squares fitting over the full pupil and paraxial-curvature matching at the pupil center. The least-squares method, also known as a Zernike refraction, takes account of the eye's higher-order aberrations when determining the best correcting lens. By comparison, the paraxial method, also known as Seidel refraction, takes into account only the lower-order aberrations responsible for the curvature of the wavefront at the pupil center. The eye's higher-order aberrations do not affect wavefront curvature and are thus ignored. Paradoxically, the formulas for the parameters of the spherocylindrical lens that optimally corrects the paraxial wavefront involve the higher-order Zernike coefficients; this is necessary to eliminate the impact of higher-order aberrations from the Zernike coefficients for defocus and astigmatism.
A second approach to wavefront refraction is analogous to the process of subjective refraction, in which the clinician finds the combination of spherical and cylindrical lenses that optimize the clarity of the retinal image. The objective version, analogous to this subjective process, is to use a computer to find the particular combination of spherical and cylindrical lenses that optimize a given metric of retinal image quality for an object located at infinity. The mean spherical equivalent of this lens combination is equal to the target vergence required to optimize image quality; thus, this spherical equivalent represents the eye's refractive error. From an optical perspective, we think of the spherical equivalent as the vergence of a plane that is optically conjugate to the retina. In clinical parlance, the spherical equivalent is simply “the refraction”.
Since wavefront refraction determines the plane that is optically conjugate to the retina, it can be used more generally to determine the refractive state of an accommodating eye. Changes in the refractive state thus quantify the accommodative response to a change in accommodative stimulus. The aim of our study was to compare the amplitude of accommodation (AA) determined by means of this wavefront technique with the traditional, subjective methods used in clinical and visual science, and also in clinical practice.
MethodsSubjectsThe study included 180 eyes (88 right ones and 92 left ones) from 98 subjects. All of them were Spaniards and most of the younger ones (less than 24 years old) were students from Murcia's School of Optometry. Age ranged from 20 to 58, with a corresponding mean and standard deviation of 35.6±12.3 and 35.0±12.4 years for eyes and subjects, respectively. Subjects read and signed an informed consent form that had been previously approved by the Ethics Committee of the University of Murcia. They also approved the experiment itself, which followed the tenets of the Declaration of Helsinki.
Subjects who normally wear contact lenses removed their lenses at least 24 (hydrophilic contact lenses) or 48 hours (gas-permeable contact lenses) before the experiment. A preliminary optometric study was performed, which included autorefraction by means of a Canon Tomey TL-1000®, retinoscopy, and subjective refraction by with trial lenses. The results of this preliminary test, together with a questionnaire, provided a basis for exclusion from the experiment. The exclusion criteria were: amblyopia; any kind of accommodative anomaly; continuous pharmacological treatment that could modify the accommodative mechanism; any kind of ocular surgery (including refractive surgery); and any kind of ocular disease that could affect vision or the accommodative mechanism (such us glaucoma, conjunctivitis or cataracts). These criteria were applied after the subject's medical history. Accommodation anomalies in young subjects were detected when the accommodative amplitude measured using negative lenses (see next subsection) was always smaller than the minimum one suggested by the Hofstetter formula22 and the accommodative flexibility was smaller than 11 cycles per minute, under monocular conditions.
From the initial 99 subjects not excluded by these criteria, only one could not accommodate to the visual target used in our experiments, so the data from that subject were removed from the study.
Subjective Measurement of the Amplitude of AccommodationThe subjective measurement of the amplitude of accommodation was performed using a custom-made Badal Optometer which was integrated in the refraction unit. As accommodation stimulus, it used a Bailey-Lovie chart (luminance = 100 cd/m2) located 6m (20 feet) away from the subject. The Badal optometer consisted of two well-aligned achromatic doublets (focal length = 100mm) as described elsewhere.21 One of the lenses was located at a distance of 100mm from the eye's entrance pupil. This distance was fixed for each subject using a focusing camera that displayed a clear image of the subject's iris when the correct distance was achieved. The second doublet was free to be moved axially during the experiment by the observer, by means of a joystick. The precision of the positioning of the lens was 1mm, corresponding to 0.1 D of target vergence. The subject's head was fixed using a chin rest. The subject's astigmatism, if any, was corrected by means of a trial lens placed 1.2cm in front of the eye. The possible refraction changes due to the astigmatism and the distance between the target and the moving achromatic lens was taken into account in the calculations.
The subject's task was to find the two extreme positions of the Badal optometer's mobile lens where the line containing 0.8 VA (20/25) letters was still clear without any perceptible blur. We refer to this dioptric range between near-point and far-point as the subjective AA. For comparison purposes, we also used a standard clinical method for determining the subjective AA, in which minus lenses are used to induce changes in vergence of a target located at a fixed viewing distance. As in the Badal method, astigmatism was corrected using trial lenses.
All the subjective measurements were performed by the same researcher, who was a trained optometrist. Distances between negative lenses and the eye were also taken into account in the calculations. The measurements were performed 3 times for the minus-lens method and 5 times for the Badal method (5 for the far point and another 5 for the near point). Mean and standard deviation of the measurements was similar for both methods, so we adopted the Badal optometer technique as our preferred method because it was more precise due to its superior resolution (0.1 D, compared to 0.25 D for the minus-lens method). Moreover, the Badal-optometer experiment was quicker and simpler than the measurements done with the minus-lenses method.
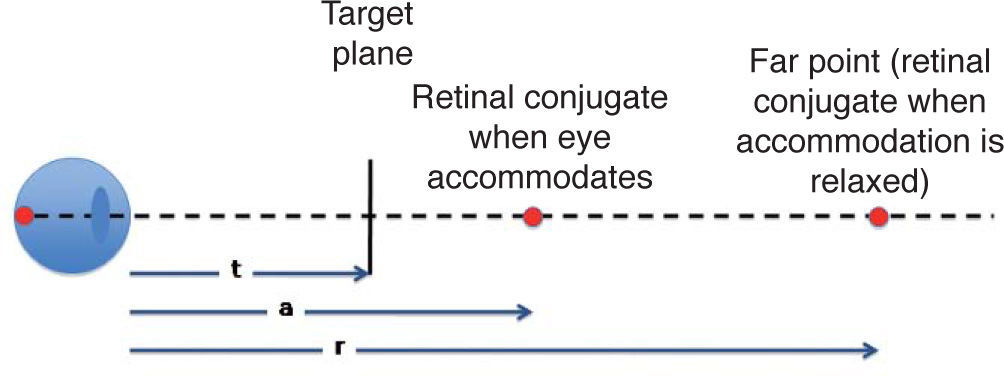
Objective Measurement of the Amplitude of AccommodationWhen a subject views a target intended to stimulate accommodation (seeFigure 1), we anticipate that the eye's refractive state will change in order to clearly focus the target onto the foveal cone apertures. To the extent that this does not happen, the eye exhibits an error of accommodation. Our goal was to measure the maximum change in the refractive state that could be achieved by manipulating target vergence. To quantify this outcome, we used the wavefront aberrometer to determine the eye's refractive state, defined here as the target vergence required to maximize retinal image quality. This definition is based on the fundamental principle that to optimize retinal image quality, the target must be optically conjugate to the cone photoreceptor apertures. Thus, the vergence of the plane that is optically conjugate to the retina determines the eye's refractive state. When accommodation is fully relaxed, the eye's refractive state is also its refractive error, both of which are equal to the vergence of the far point (i.e. the retinal conjugate of the relaxed eye). These various distances and their corresponding vergences are summarized with reference to figure 1 as follows:
- 1.
Target vergence: T = 1/target distance = 1/t
- 2.
Refractive state of accommodated eye: A = 1/a
- 3.
Refractive error of relaxed eye: R = 1/r
 of the far point. The refractive state of the accommodated eye is defined as the vergence (1/a) of the retinal conjugate plane. Wavefront refraction is based on the assumption that the vergence of the retinal conjugate plane is the same as the target vergence required to maximize retinal image quality.")
Definition of terms. Target vergence T is equal to the inverse of the viewing distance “t”. Distance “r” is equal to the axial position of the plane conjugate to the foveal cone apertures when accommodation is relaxed. The axial location of this retinal conjugate plane is called the “far point”. The refractive error of the eye equals the vergence (1/r) of the far point. The refractive state of the accommodated eye is defined as the vergence (1/a) of the retinal conjugate plane. Wavefront refraction is based on the assumption that the vergence of the retinal conjugate plane is the same as the target vergence required to maximize retinal image quality.
All distances are referred to the corneal plane and, according to the standard ophthalmic sign convention, they are negatives if the corresponding points are located in front of the eye, as in figure 1. Values for T, A, and R are equal to the power K of an ideal lens placed in the pupil plane that forms a virtual image at infinity of the target plane, the retinal conjugates when eye accommodates, or far point, respectively. Accommodation stimulus, AS, is defined as the change in target vergence: AS = R-T. Accommodation response, AR, is defined as the change in refractive state of the accommodated eye compared to the relaxed eye: AR = R-A. Thus, to find the accommodation response we have to find the power of two ideal lenses, which correspond to the refraction, R, and to the refractive state of the accommodated eye, A. This is achieved by means of a through-focus calculation described next.
Since the power of the eye varies across the pupil area when higher-order aberrations are present, different conjugate foveal planes would be found depending on the pupil zone used and, therefore, the value of K would change across the pupil. The average K value that produces a “good image” for an ideal point object placed at the fovea and a natural pupil (assumed to have a circular shape), for a particular accommodation state, will depend on the particular definition of “good image” that we use. In this sense, we need to choose a metric that quantifies image quality and then we have to look for the target vergence that maximizes that metric. A variety of optical-quality metrics are available for this purpose, many of which were evaluated by Thibos et al.22 for predicting the refractive state of the relaxed eye. Some metrics quantify the quality of the eye's wavefront aberration function, whereas others quantify the quality of the point spread function or of the optical transfer function associated with the retinal image. For a detailed mathematical description of these metrics see Appendix A in reference Thibos et al.22
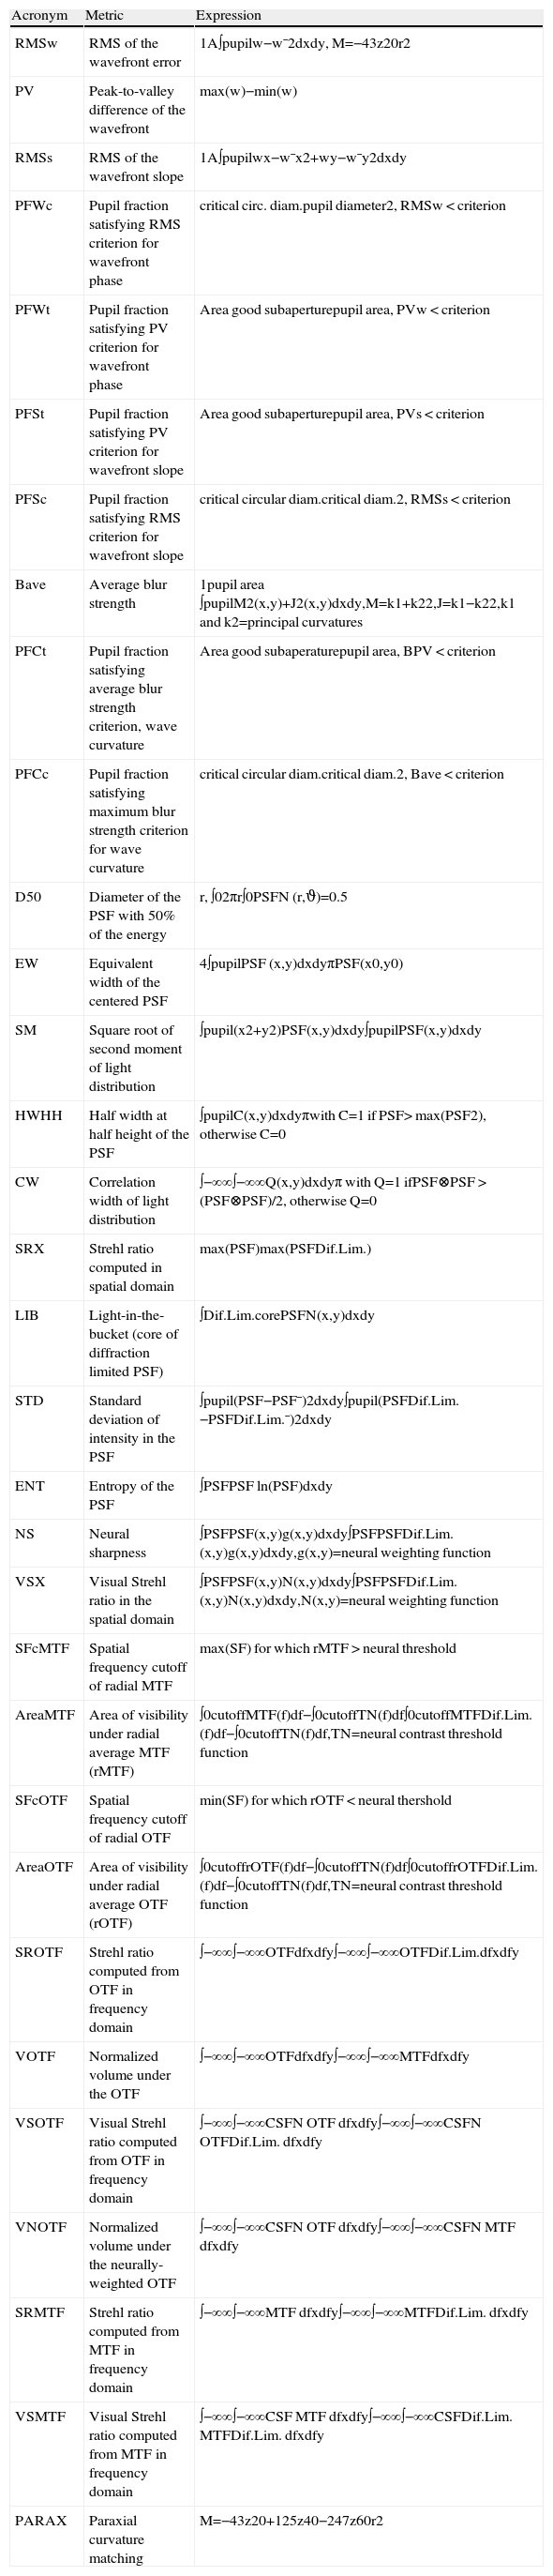
We have applied all 32 independent metrics described by Thibos et al.22 to determine the refractive state of the eye at various levels of accommodative response, including the relaxed eye. Appendix A shows a table with the names and some information of all the metrics used. The procedure followed for each subject consisted of two steps. In the first step, 3 wavefront aberration functions were obtained for the un-accommodated eye using the IRX3 aberrometer (Imagine Eyes, France). To ensure that the eye is unaccommodated, the aberrometer uses a fogging method in which the target distance is increased in 1 D steps while the eye's refractive state is continuously monitored. When the eye fails to change its refractive state in the hyperopic direction in response to the change in target vergence, then accommodation is assumed to be fully relaxed. From three consecutive measurements taken over 10 s in this relaxed state, the more hyperopic one was selected as the reference to be used when computing the accommodative response. In this case, the refraction is obtained from the second-order Zernike coefficient C20 obtained from a least-squares fit of a sphero-cylindrical surface to the wavefront. The wavefront corresponding to the unaccommodated eye is named W0(T0).
In the second step, three repeated sets of wavefronts were recorded for the accommodated eye by using a stimulus vergence that changes automatically in steps of 0.5 D. After each movement of the target, there was a delay of 1.5 s before a wavefront measurement was made, in order to give the subject enough time to accommodate. From the refraction obtained in the first step, we added 0.5 D to the nearest hyperopic vergence multiple of 0.5 D (for instance, if the Zernike refractive error was 2.17 D, we obtained 2.5D + 0.5 D = 3 D; or if was -2.34 D we used -2 D + 0.5 D=-1.5 D). This value became the vergence of the first position of the stimulus in a series of accommodation measurements. Before collecting the data, we ran at least three trials, so that the subject could understand the task well and with the aim of getting an idea about the range of accommodation. This stimulus accommodation range was calculated for each subject according to Hofstetter formula20 and was increased by at least 2.5 D to guarantee that the stimulus would cover the subject's full range of accommodation. For subjects younger than 35 years old, the range used was 10 D. In the few cases where the accommodation response measured by the aberrometer did not show a maximum value (indicating that the target failed to get closer than the near point), the stimulus accommodation range was increased by 2 D, and the set of accommodation measurements was repeated.
At the end of each measurement of the set of accommodation wavefronts, the aberrometer displayed the accommodation response computed using the same procedure that had been previously employed to obtain the initial refraction. Among the three repeated set of measurements, we selected again the one with the largest AA. In general, the differences between all of them were usually smaller than 1 D, although it depends on the particular subject's ability to accommodate (see López-Gil et al.17, for details on the repeatability of the measurement). The set of wavefronts corresponding to the accommodated eye are named Wi(Ti), with i=1 to i≤21.
The Zernike expansion depended on the size of the subject's pupil. For most of subjects it was made up to the 8th order, with the minimum being 5th order (corresponding to small pupils under accommodation of some subjects). To mimic as much as possible natural viewing conditions, no mydriatic drugs were used and wavefronts were obtained under natural pupil size, so the study has taken into account natural accommodative miosis. For most of the subjects, when the target was closer than their near point, a pupil diameter increase was observed due to a relaxation in their accommodation. Prior to the accommodation measurements, the subjects were initially instructed to keep the target as clear as possible all the time as well as to blink frequently (the aberrometer software automatically eliminates Shack-Hartmann images affected by blinks). The visual target was a figure of a balloon at the end of a road. The stimulus had a luminance of 50 cd/m2, was polychromatic and contained multiple spatial frequencies.
Wavefront Determination of the Refractive StateFor each optical quality metric, Mj, we computed the refractive error of the relaxed eye (R0j=Mj[W0(T0)]), and the refractive state of the accommodated eye for each value of stimulus vergence, Ti, (Rij=Mj[Wi(Ti)]). The computation finds the lens power that, when added to the eye's wavefront aberration, maximizes the value of the metric. Then, taking into account that the response of the unaccommodated eye is zero, the accommodation response for a certain normalized stimulus accommodation, Ti-R0j, corresponds to Rij-R0j. AA was then estimated for this same metric as the maximum range of accommodation response, that is, the maximum value of the eye's refractive state minus the minimum value of the refractive state.
All subjective measurements were carried out by the same researcher, who was different from the researcher involved in the objective measurements. Each researcher was aware of the results obtained by his colleague. For each subject, the experiment took about 2 hours including a break in between of about 20’. The whole experiment took about two years and a half.
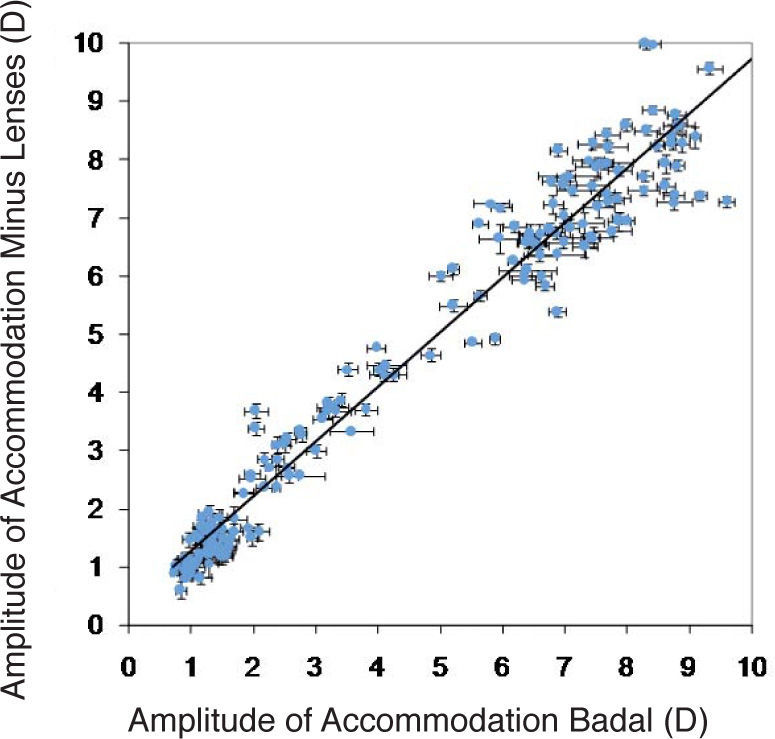
ResultsFigure 2 compares the subjective AA measured with both methods. Least-square fit line shows a slope very close to the expected one due to the fact that both methods assess the same behavior. Although, theoretically, the Badal optometer should be more precise accurate, the SD error bars corresponding to that method (horizontal bars) are usually larger than the bars corresponding to the minus-lens method (vertical bars) probably due to the fact that a 0.25 D precission is acceptable enough, and that usually two out of three measurements corresponding to the far or to the near point gave the same value as the power of the trial lens.

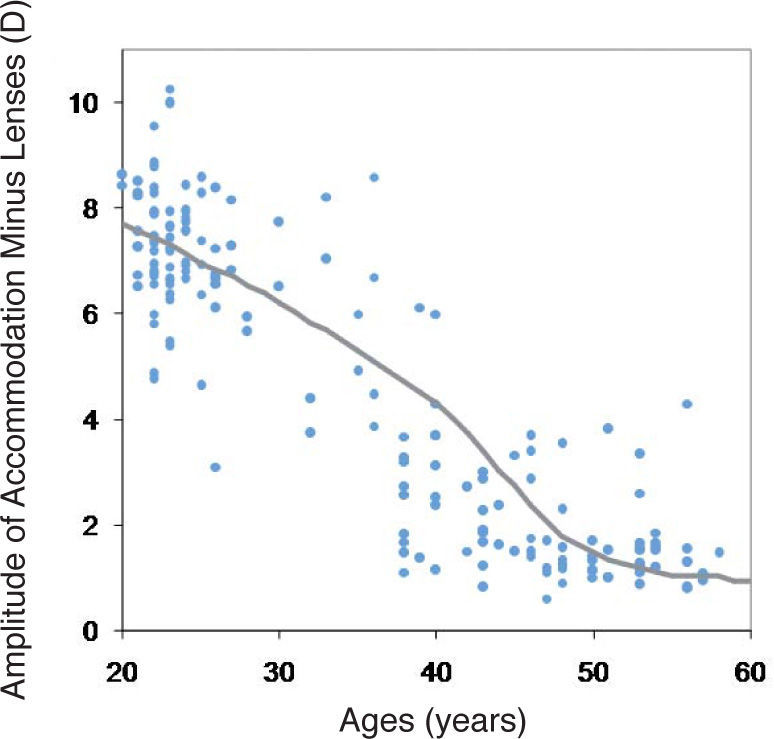
Figure 3 shows the effect of age on the subjective AA values obtained using the Badal optometer. For comparison purposes, we also show the mean AA obtained by Duane.23 Duane's results have been slightly modified because his data were referred to the spectacle plane (placed 12mm in front of the eye) and reduced by 20% due to the overestimated values yielded by the push-up method relative to those yielded by the minus-lenses method.24Figures 2 and 3 indicate that the subjective data collected by two independent methods are internally consistent and in broad agreement with published norms for the human eye.

Subjective amplitude of accommodation values obtained using the Badal optometer as a function of age. The solid line represents the adapted mean amplitude of accommodation obtained by Duane.23
Figure 4 shows an example of the accommodation response curves for each of the 32 metrics, for a 23-year-old subject. Note that although target vergence is independent of the metric of choice, the stimulus to accommodation indicated on the abscissa depends on the metric used because its depends on the vergence of R0j of the far-point, which varies with the metric. The various curves do not converge at the origin because the refraction value (R0j) was obtained in a separate, preliminary experiment. Thus, the refractive state of the eye during the accommodation experiment could be slightly different to the value obtained with the fogging technique (see the Methods section). For this particular subject, response was positive for 0 D of accommodation stimulus according to all the metrics, indicating that the eye was probably more relaxed during the refraction measurements or that, possibly, a small difference in pupil diameter affected the refraction. Nevertheless, our measure of AA was not affected by these non-zero y-intercepts. The form of the stimulus-response curve was similar for most metrics, which is to be expected since they are highly correlated measures of image quality.22 Some of the jumps (such as those observed for 4 or for 7.5 D of stimulus vergence) are probably due to the fact that the target moves by steps.
. A polynomial curve has been fitted (y = 0.0012x4 - 0.0459x3 + 0.4564x2 - 0.7571x + 1.2555, r2 = 0.9715) to the mean average value of the accommodation response of the 32 metrics (blue curve). The 1:1 line intersects the X-axis at the minimum value of the fitted curve (1 D).")
Example of the accommodation-response curves for all the metrics analyzed, for one particular subject (23 years old). A polynomial curve has been fitted (y = 0.0012x4 - 0.0459x3 + 0.4564x2 - 0.7571x + 1.2555, r2 = 0.9715) to the mean average value of the accommodation response of the 32 metrics (blue curve). The 1:1 line intersects the X-axis at the minimum value of the fitted curve (1 D).
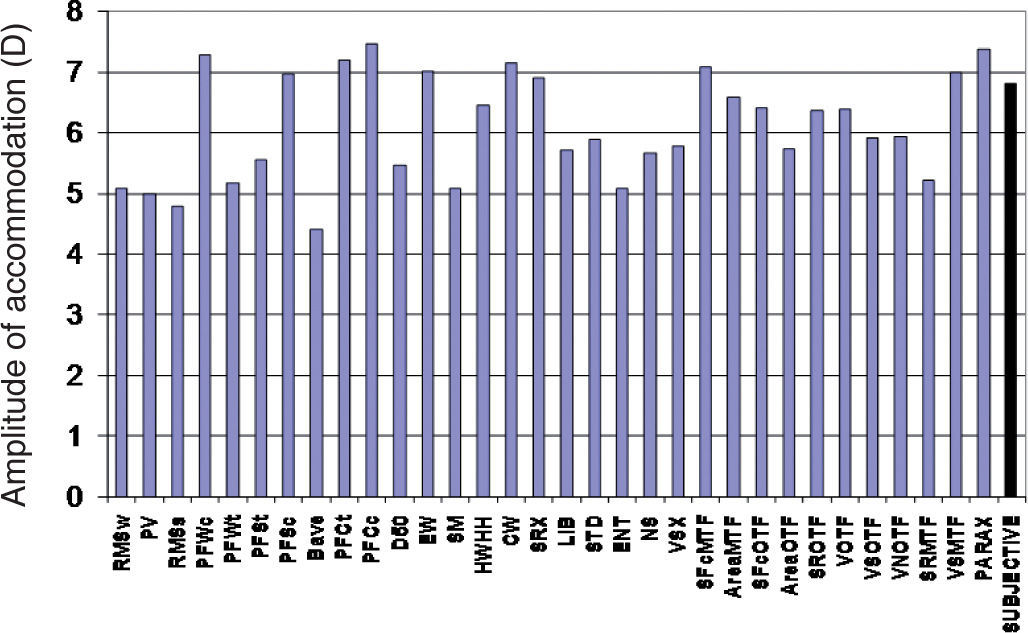
The AA derived from figure 4 (i.e., for that particular 23-year-old subject) varied significantly between metrics, as shown in figure 5. Some metrics, such as PV or VOTF, have larger variations during the accommodation process. The metric that resulted in the maximum AA was PFCc, with a value of 7.5 D, while Bave metric yielded the minimum value: 4.4 D. That is, a difference of 3 D was found for this subject between the AA obtained with these two metrics. The average value of the AA across all the metrics was 6.1 D, with a standard deviation of 0.9 D. For this subject, the subjective measurement of the AA (showed by the last bar of figure 5) gave a value of 6.8 D with a standard deviation of 0.3 D. For this particular subject, SRX was the metric that most accurately predicted the subjective AA, with a value of 6.9 D. Most of the metrics (23 out of 32) yielded AA values than that were lower than the one obtained with the subjective measurement.

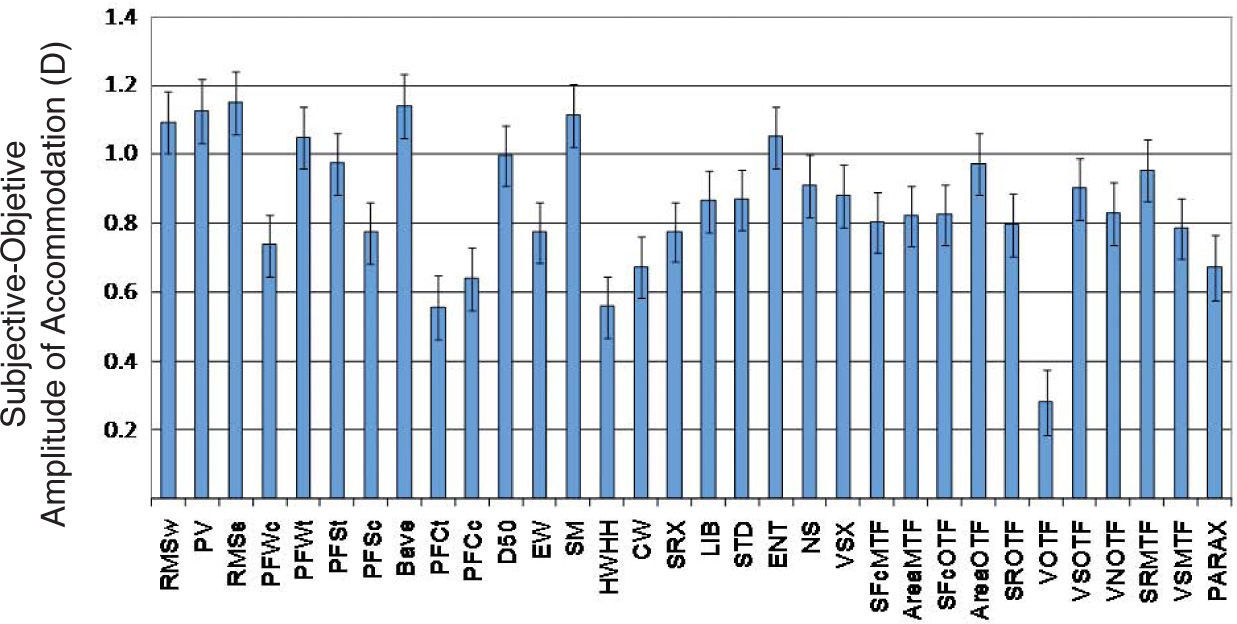
Figure 6 shows the average across subjects of the difference between the subjective AA (obtained with the Badal optometer) and the objective amplitude of accommodation computed using the different metrics. All metrics revealed a similar trend: the subjective AA is higher than the objective AA. The smallest discrepancy (0.19 D) was for the VOTF. The largest discrepancy (1.06 D) was for the RMSs. Error bars in the figure indicate the precision of each metric's prediction of the subjective AA. The minimum SD (1.48 D) was achieved by the EW and the maximum SD (1.82 D) was for the paraxial (Seidel) metric PARAX.
.")
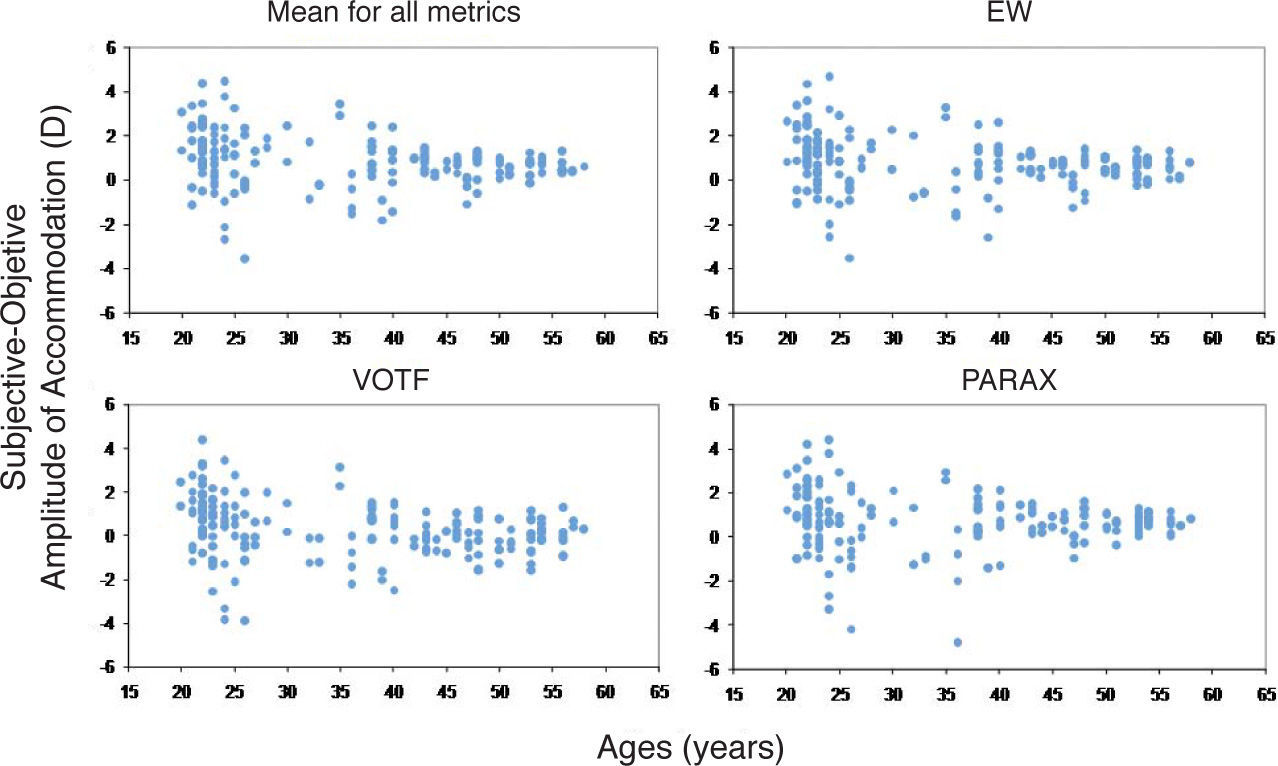
Figure 7 shows the difference between subjective and objective measures of AA as a function of age obtained for two metrics that gave good results when they were used by Thibos and coworkers22 to predict the refractive state of the relaxed eye. The figure also includes the VOTF, which gave the highest accuracy (smallest discrepancy) in our study, as well as the RMS (i.e. Zernike refraction) which is perhaps the most widely used metric nowadays. VOTF clearly showed a best average prediction of the subjective AA, compared with the rest.

Difference in AA between subjective and objective methods as a function of age, computed using two metrics that gave good results when they were used by Thibos and coworkers22 to predict the refraction state of the relaxed eye. VOTF is also included, since it gave the best results in our study, as well as the RMS, which is perhaps the most widely used metric.22
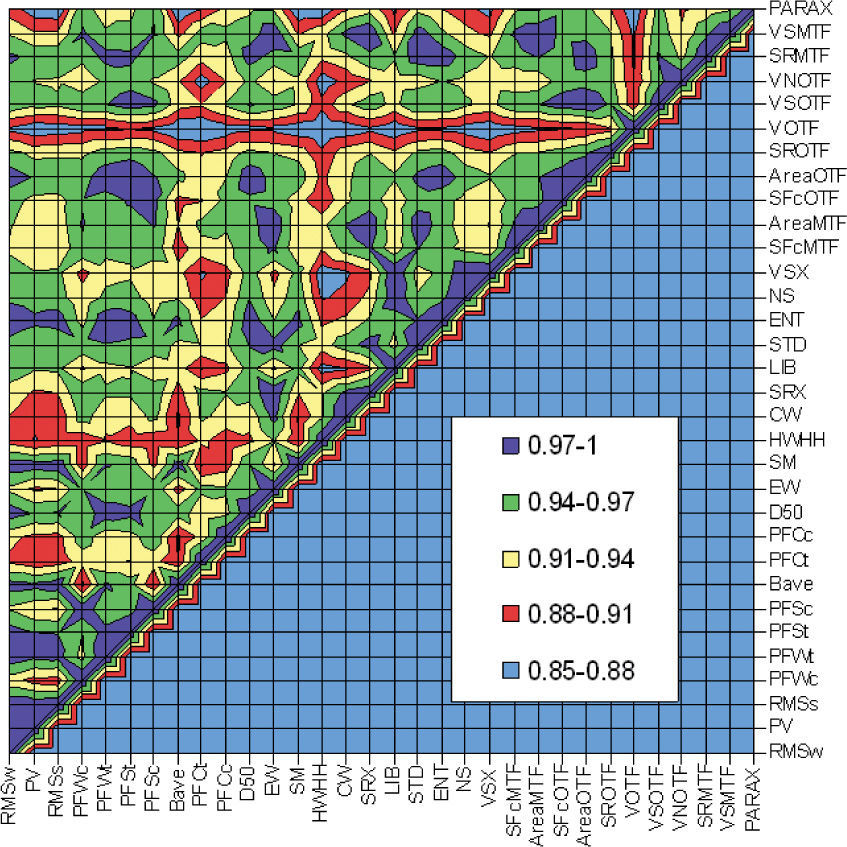
Figure 8 shows the matrix values corresponding to Pearson's correlation between subjective-minus-objective results obtained using different metrics. A maximum theoretical correlation corresponds to 1. From figure 8 it can be seen that the metric VOTF shows the lowest Pearson correlation (values between 0.82 and 0.90) as compared with the rest of the metrics. Metric PFCt and HWHH also showed a Pearson correlation that was lower than that yielded by the other metrics under analysis.
Discussion
Our main finding (Figure 6) is that objective measurement of the accommodation amplitude determined for any of the 32 metrics of optical quality underestimates the subjective AA. The amount of underestimation depends on the maximum AA, which is usually about 1.5-2 D for subjects that are between 20 and 25 years old, and about 0.5-1 D for older eyes (seeFigure 7). One potential explanation for this discrepancy between subjective and objective results is that the measurements are referenced to different planes. Wavefront measurements are referenced to the entrance pupil, whereas subjective measurements are calculated relative to the anterior corneal plane. Wavefront propagation between these two planes might account for the discrepancy. However, we think that this is rather unlikely for two reasons. First, AA is a differential measurement and, therefore, a small offset in the reference plane should have the same effect on measurements of near-point vergence and far-point vergence, hence zero effect on the AA. Second, the two reference planes are only about 3mm apart, for which wavefront propagation has little influence on wavefront vergence even for large amounts of accommodation.25 For example, propagation of a -10.0 D spherical wavefront by 3mm changes its vergence to-9.7 D. This worst-case scenario predicts a 0.3 D discrepancy, which is below the difference found for all but one metric.
Another potential explanation for the difference between subjective and objective amplitudes of accommodation is that the visual target used was not the same. However, we do not believe that accommodation response should be different because of the use of two different targets since both are well contrasted, polychromatic and contain many spatial frequencies.26 Although the target in the objective measurements had a lower luminance than the subjective target, we know after Johnson results27 that differences on accommodation response between a target with 50 and 100 cd/m2 are very small.
Another potential explanation of the difference between subjective and objective amplitudes of accommodation is that objective measurements do not include depth of field (DoF). Although the subject was instructed to maintain clear focus when determining the near and far points, ocular depth of focus would be expected to expand the AA by pushing the subjective far point beyond the retinal conjugate plane and pulling the subjective near point closer than the retinal conjugate plane.28 Assuming DoF accounts for the full discrepancy shown in figure 6, then the DoF will be equal to half the difference between subjective and objective AA. For example, the discrepancy for the metric PFSt is 1 D, of which 0.5 D is due to an error in measuring the far-point vergence and 0.5 D is due to an error in measuring the near-point vergence. Typical pupils used during maximum accommodation effort were around 3-4mm for which a DoF of 0.5 D is consistent with the values found in the literature.28 Objective measures of the AA could be adjusted to take into account the subjective DoF by including an objective DoF in the algorithm for finding the refractive state.29
The largest objective AA and, therefore, the smallest discrepancy with subjective AA, was obtained for VOTF. This metric was designed to capture the effects of spatial phase shifts in the image that arise principally due to defocus. These phase shifts are asymmetric with respect to defocus, in the sense that they occur when spherical aberration and defocus have opposite signs but not when those aberrations have the same sign.30 For example, in determining the far point refraction, stimulus planes beyond the far point will focus in front of the retina (i.e. positive or myopic defocus). When positive defocus is mixed with positive spherical aberration, typically present in the relaxed eye, the result is reduced contrast but a lack of phase reversals. The result could be a determination of the far point that is beyond the retinal conjugate obtained with other metrics. Similarly, the near point could be closer than the retinal conjugate obtained with other metrics, leading to larger objective AA.
Although we used a colored visual target to stimulate accommodation, we did not take ocular chromatic aberration into account in our analysis. Objective wavefront measurements were obtained for monochromatic light having a wavelength of 780 nm. The aberrometer software applies a fixed myopic shift in focus to compensate for ocular longitudinal chromatic aberration. We have implicitly assumed that this focus shift does not change during accommodation; in other words, we assume that longitudinal chromatic aberration does not vary significantly during accommodation. As far as we know, there are few studies regarding this issue (see, for instance, Charman and Tucker31), and all of them indicate that chromatic aberration changes little with accommodation. Since we compute the AA as the difference between maximum and minimum accommodative response, a constant shift of refraction due to chromatic aberration would have no effect on our study. For the same reason, systematic bias of aberrometry due possibly to penetration of the probe beam deeper than the photoreceptor apertures is removed by the differential measurements that the estimation of the AA consists of.
Effect of Spherical Aberration on the Amplitude of AccommodationDuring accommodation there is a well-known decrease in fourth-order spherical aberration (z40) in young subjects, typically resulting in a change in sign, going from positive to negative. It has been pointed out by Collins et al.32 and by López-Gil et al.33 that this change could help the eye to accommodate. In particular, López-Gil et al.33 compared the use of RMSw (which is an image quality metric typically used by ray tracing software for optimization and which only depends on the defocus term, z20) with PARAX (which also takes into account the spherical aberration terms, z40 and z60) for the calculation of the accommodative response in a group of 15 young subjects. Equations 1 and 2 show how the AA is calculated for the RMSw and the PARAX metrics, respectively:
where z_i0, i= 2, 4 or 6, corresponds to the unaccommodated eye, and zi0, i= 2, 4 or 6, corresponds to the fully accommodated eye. Since the first term in Eq. 2 is identical to the only term in Eq. 1, the difference in AA between these two metrics is due entirely to spherical aberration. Thus, we should expect AA to be higher for PARAX than for RMSw. That expectation was confirmed by López-Gil et al.33 who found an average difference of 0.75D.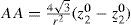

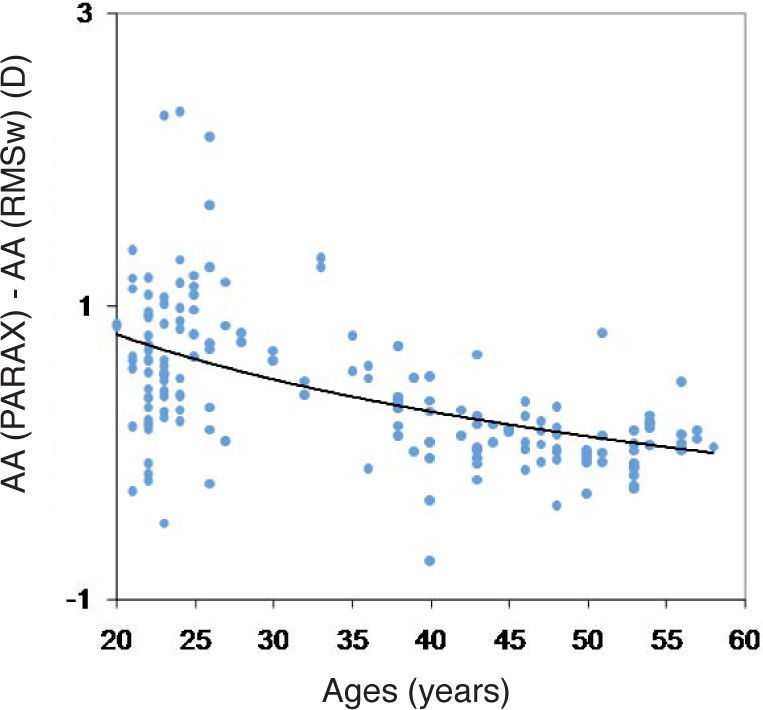
The present results shown in figure 6 add further evidence to the fact that, if it can be assumed that Eq. 2 represents a good metrics to predict the refraction, as have been showed before,22 spherical aberration does extend the eye's AA. For our study population the PARAX metric yielded a larger AA (0.42 D more, on average) than the RMSw metric did. As indicated by Eq. 1,2 the value of this difference will depend on the amount of spherical aberration, which, in turn, depends on the maximum AA. Thus, we would expect the difference in AA (between the value determined by PARAX and the value obtained by means of RMSw) to be greater for younger subjects. This prediction is confirmed in figure 9. The data have been fitted using a logarithmic function which approaches a zero value for the older subjects:

 + 3.0878; r2 = 0.224.")
Although the regression coefficient of the fit was not high (R2= 0.22), it can be seen that for subjects under 25 years old, an average increase of 0.75 D in the AA was obtained when the effect of spherical aberration was included in the calculation. Figure 9 shows that for most of our subjects the use of PARAX metric gave a larger AA than RMSw, this difference being in some cases as high as 2.3 D. This can be explained by taking a look at Eq. 1, 2 and by taking into account the fact that during accommodation, Z40 decreases and eventually changes sign, while Z60 usually increases.33
It is worth stressing that these two metrics, RMSw and PARAX, are the only metrics used in this article that gave, in a very direct way (Eq. 1 and 2), the accommodation state of the eye from the Zernike coefficients and the associated pupil radius. Both are metrics applied at the pupil plane directly to wavefront error functions and, therefore, are indirect measures of the retinal image quality.
ConclusionsThe main conclusion of our study is that objective measurements of the AA show lower values than subjective estimations of the AA, with a discrepancy that ranges from 0.2 to 1.1 D, depending on the metric used for wavefront refraction. This result can be interpreted as an underestimation of the objective data with respect to the subjective one, or as an overestimation of the subjective values with respect to the objective ones. It would depend on whether in the definition of amplitude of accommodation we only include the change of dioptric power or we include as well the pseudo-accommodation procured by the DoF.
There is a significant individual variation in this result, with an average standard deviation across metrics of 1.2 D and a standard error of the mean of 0.1 D, which decreases with age. Despite intersubject variability, the decrease of the fourth-order spherical aberration during accommodation increases the objective AA in the young eye. This increase could even exceed two diopters.
This work has been supported in part by several grants from the Fundación SENECA, Comunidad Autónoma de la Región de Murcia to Norberto López-Gil (#00702/PPC/04l# and #0583/PI/07#)and from the Ministerio de Ciencia e Innovación Research Grants to Robert Montés-Micó (#SAF2008-01114# and #SAF2009-13342#). Development of wavefront refraction methodologies has been supported by a grant from the US National Institutes of Health (#R01-EY05109) to Larry Thibos.
Financial Disclosure: Thibos has a proprietary interest in the development of optical metrics predictive of visual performance.
| Acronym | Metric | Expression |
| RMSw | RMS of the wavefront error | 1A∫pupilw−w¯2dxdy, M=−43z20r2 |
| PV | Peak-to-valley difference of the wavefront | max(w)−min(w) |
| RMSs | RMS of the wavefront slope | 1A∫pupilwx−w¯x2+wy−w¯y2dxdy |
| PFWc | Pupil fraction satisfying RMS criterion for wavefront phase | critical circ. diam.pupil diameter2, RMSw < criterion |
| PFWt | Pupil fraction satisfying PV criterion for wavefront phase | Area good subaperturepupil area, PVw < criterion |
| PFSt | Pupil fraction satisfying PV criterion for wavefront slope | Area good subaperturepupil area, PVs < criterion |
| PFSc | Pupil fraction satisfying RMS criterion for wavefront slope | critical circular diam.critical diam.2, RMSs < criterion |
| Bave | Average blur strength | 1pupil area ∫pupilM2(x,y)+J2(x,y)dxdy,M=k1+k22,J=k1−k22,k1 and k2=principal curvatures |
| PFCt | Pupil fraction satisfying average blur strength criterion, wave curvature | Area good subaperaturepupil area, BPV < criterion |
| PFCc | Pupil fraction satisfying maximum blur strength criterion for wave curvature | critical circular diam.critical diam.2, Bave < criterion |
| D50 | Diameter of the PSF with 50% of the energy | r, ∫02πr∫0PSFN (r,ϑ)=0.5 |
| EW | Equivalent width of the centered PSF | 4∫pupilPSF (x,y)dxdyπPSF(x0,y0) |
| SM | Square root of second moment of light distribution | ∫pupil(x2+y2)PSF(x,y)dxdy∫pupilPSF(x,y)dxdy |
| HWHH | Half width at half height of the PSF | ∫pupilC(x,y)dxdyπwith C=1 if PSF> max(PSF2), otherwise C=0 |
| CW | Correlation width of light distribution | ∫−∞∞∫−∞∞Q(x,y)dxdyπ with Q=1 ifPSF⊗PSF > (PSF⊗PSF)/2, otherwise Q=0 |
| SRX | Strehl ratio computed in spatial domain | max(PSF)max(PSFDif.Lim.) |
| LIB | Light-in-the-bucket (core of diffraction limited PSF) | ∫Dif.Lim.corePSFN(x,y)dxdy |
| STD | Standard deviation of intensity in the PSF | ∫pupil(PSF−PSF¯)2dxdy∫pupil(PSFDif.Lim.−PSFDif.Lim.¯)2dxdy |
| ENT | Entropy of the PSF | ∫PSFPSF ln(PSF)dxdy |
| NS | Neural sharpness | ∫PSFPSF(x,y)g(x,y)dxdy∫PSFPSFDif.Lim.(x,y)g(x,y)dxdy,g(x,y)=neural weighting function |
| VSX | Visual Strehl ratio in the spatial domain | ∫PSFPSF(x,y)N(x,y)dxdy∫PSFPSFDif.Lim.(x,y)N(x,y)dxdy,N(x,y)=neural weighting function |
| SFcMTF | Spatial frequency cutoff of radial MTF | max(SF) for which rMTF > neural threshold |
| AreaMTF | Area of visibility under radial average MTF (rMTF) | ∫0cutoffMTF(f)df−∫0cutoffTN(f)df∫0cutoffMTFDif.Lim.(f)df−∫0cutoffTN(f)df,TN=neural contrast threshold function |
| SFcOTF | Spatial frequency cutoff of radial OTF | min(SF) for which rOTF < neural thershold |
| AreaOTF | Area of visibility under radial average OTF (rOTF) | ∫0cutoffrOTF(f)df−∫0cutoffTN(f)df∫0cutoffrOTFDif.Lim.(f)df−∫0cutoffTN(f)df,TN=neural contrast threshold function |
| SROTF | Strehl ratio computed from OTF in frequency domain | ∫−∞∞∫−∞∞OTFdfxdfy∫−∞∞∫−∞∞OTFDif.Lim.dfxdfy |
| VOTF | Normalized volume under the OTF | ∫−∞∞∫−∞∞OTFdfxdfy∫−∞∞∫−∞∞MTFdfxdfy |
| VSOTF | Visual Strehl ratio computed from OTF in frequency domain | ∫−∞∞∫−∞∞CSFN OTF dfxdfy∫−∞∞∫−∞∞CSFN OTFDif.Lim. dfxdfy |
| VNOTF | Normalized volume under the neurally-weighted OTF | ∫−∞∞∫−∞∞CSFN OTF dfxdfy∫−∞∞∫−∞∞CSFN MTF dfxdfy |
| SRMTF | Strehl ratio computed from MTF in frequency domain | ∫−∞∞∫−∞∞MTF dfxdfy∫−∞∞∫−∞∞MTFDif.Lim. dfxdfy |
| VSMTF | Visual Strehl ratio computed from MTF in frequency domain | ∫−∞∞∫−∞∞CSF MTF dfxdfy∫−∞∞∫−∞∞CSFDif.Lim. MTFDif.Lim. dfxdfy |
| PARAX | Paraxial curvature matching | M=−43z20+125z40−247z60r2 |


