

This study investigated the correlation between the relative afferent pupillary defect (RAPD) and retinal nerve fiber layer thickness (RNFLT) in optic neuropathy.
MethodsRAPD assessment was performed using a log unit neutral density filter bar. Spectral domain optical coherence tomography RTVue-100 (Optovue) was used to examine the subjects. The optic nerve head pattern (ONH) was subdivided and identified for the purpose of the study into circumpapillary RNFLT (cpRNFLT) and peripheral circumpapillary RNFLT (pcpRNFLT). The cpRNFLT, pcpRNFLT and ganglion cell complex (GCC) parameters were analyzed.
ResultsEighteen females and twenty three males with asymmetric optic neuropathy and a RAPD participated. Thirty-three subjects had glaucoma and eight had optic neuropathy other than glaucoma. Significant correlations (p<0.02) were obtained for the RAPD and the percentage difference loss of the GCC and RNFLT parameters. The grouped mean percentage difference loss for RNFLT was significantly different from that of the GCC (p<0.001). At a 0.6log unit RAPD, the average mean percentage difference loss was 23% for the CRNFLT, 15% for the GCC, 12% for the global loss volume percentage and 6% for the focal loss volume percentage (FLV%).
ConclusionsSignificant correlations between RNFLT loss for cpRNFLT, pcpRNFLT and GCC parameters with RAPD were observed. Approximately a 35% higher sensitivity was obtained using GCC compared to CRNFL parameters. The expected change in GCC average for every 0.3log unit increment was approximately 8.49μm. The FLV% corresponded more sensitively to a RAPD but appeared to be influenced by disease severity.
Este estudio investigó la correlación entre el defecto pupilar aferente relativo (DPAR) y el grosor de la capa de fibras nerviosas de la retina (RNFLT) en la neuropatía óptica.
MétodosLa valoración del DPAR se realizó utilizando una barra de filtro de densidad neutra de unidades logarítmicas. Para examinar a los sujetos se utilizó tomografía de coherencia óptica de dominio espectral RTVue-100 (Optovue). A los fines del estudio, se subdividió e identificó el patrón de la cabeza del nervio óptico (ONH) en RNFLT circumpapilar (cpRNFLT) y RNFLT circumpapilar periférico (pcpRNFLT). Se analizaron los parámetros de cpRNFLT, pcpRNFLT y del complejo de células ganglionares (GCC).
ResultadosSe incluyó en el estudio a dieciocho mujeres y treinta y tres varones con neuropatía óptica asimétrica y DPAR. Treinta y tres sujetos tenían glaucoma y ocho neuropatía óptica diferente a glaucoma. Se obtuvieron correlaciones significativas (p<0,02) para DPAR y pérdida de diferencia porcentual de los parámetros GCC y RNFLT. La pérdida de diferencia porcentual media agrupada para RNFLT fue considerablemente diferente a la de GCC (p<0,001). Para una unidad log de 0,6 de DPAR, la pérdida de diferencia porcentual media fue del 23% para CRNFLT, del 15% para GCC, del 12% para el porcentaje de volumen de pérdida global, y del 6% para el porcentaje de pérdida focal de volumen (FLV%).
ConclusionesSe observaron correlaciones significativas entre la pérdida de RNFLT para los parámetros cpRNFLT, pcpRNFLT y GCC con DPAR. Se obtuvo aproximadamente un 35% de mayor sensibilidad utilizando los parámetros GCC en comparación a CRNFL. El cambio previsto en la media de GCC para cada incremento de unidad log de 0,3 fue de aproximadamente 8,49 um. El FLV% se correspondió de manera más sensible con DPAR, pero pareció verse influenciado por la severidad de la enfermedad.
A relative afferent pupillary defect (RAPD) results from an afferent conduction deficit of the pupil light reflex yielding a relatively weaker efferent stimulation and pupil reactivity in the affected eye.1,2 Optical coherence tomography (OCT) can quantify retinal nerve fiber layer thickness (RNFLT) and consequently provide a structural measurement estimate of retinal ganglion cell loss.3–7 Results from time domain OCT (TD-OCT) studies have documented that approximately 25–27% RNFLT loss was associated with the presence of a RAPD and 23% at a 0.6log unit RAPD compared to the contralateral unaffected eye.3,7 Histological analysis in primates however, has documented similar percentage loss (25%) but composed exclusively of ganglion cells.8,9 Studies using spectral domain OCT (SD-OCT) which allows for a higher scan rate and axial resolution of the retinal layers,10,11 have also been used to establish a correlation with a RAPD.8
One brand of SD-OCT, the RTVue-100, Optovue combines the measurement of the RNFLT with that of the optic nerve head (ONH) by obtaining these values during a single probe. This SD-OCT feature improves the instrument's diagnostic potential compared to measuring each single parameter separately at a different time interval. The RTVue-100, Optovue also generates assessments of a quadrant area with a center located close to 1mm temporal to the fovea. Within this area the instrument can more exclusively discriminate the ganglion cell from the total retinal layer using the protocol known as ganglion cell complex (GCC). The GCC measures the retinal thickness from the inner limiting membrane to the outer plexiform layer of the retina. The RNFLT at this retinal area is composed of the nerve fiber layer (NFL), the ganglion cell layer (GCL) and the inner plexiform layer (IPL). In this perifoveal region analyzed by the GCC, the NFL is very thin compared to the GCL and IPL. In addition, the GCC provides two calculated parameters; the global loss volume percentage (GLV%) and the focal loss volume percentage (FLV%). The GLV% provides an indication of average ganglion cell loss while the FLV% determines a pattern of focal loss of the retinal area measured by the GCC.10,11 The GCC parameters have also been documented to be superior to RNFLT and other RTVue-100, Optovue values at detecting early structural glaucomatous changes.12 The papillomacular bundle is mostly composed of parvocellular ganglion cell axons whose function primarily involves visual acuity, and also contributes to chromatic input and pattern stimuli processing. It is also considered that these fibers are mainly responsible for the pupillary reflex.3–7,13 Consequently, the GCC protocol may contribute to a more specific assessment of the ganglion cell layer at this retinal quadrant and may assist in establishing a more accurate description of structural correlation with RAPD.
We investigated the correlation between the RAPD and RNFLT loss in patients with asymmetric optic neuropathy. We used the RTVue-100, Optovue to assess the RNFLT and the swinging flash light technique using a neutral density filter bar to determine the RAPD. To the best of our knowledge no other studies have used the RTVue-100, Optovue to analyze and compare the correlation of the RAPD with GCC in contrast to RNFL parameters.
MethodsParticipants in this study were recruited from the clinical population attending the Nova Southeastern University Eye Care Institute at North Miami Beach, Davie and Broward Optometry clinics. Informed consent (via an institutional derived review-board approved protocol) was obtained for all subjects. Forty-one subjects were enrolled in the study. The inclusion criteria specified the following guidelines: (1) asymmetric or unilateral optic neuropathy, (2) presence of a RAPD, (3) absence of retinopathy, (4) absence of significant asymmetric cataracts and, (5) absence of pupil anomalies other than RAPD or use of unilateral ocular medications that may affect pupil size. All volunteers had a comprehensive eye exam (no more than one year prior to participation in the study) that included review of medical history and blood pressure measurement prior to participation. Glaucoma subjects have been diagnosed based on presence of glaucomatous visual field loss, SD-OCT RNFL loss consistent with glaucoma, and or glaucomatous cupping of the optic nerve. Participant glaucoma subjects were managed medically but not surgically. Non-glaucoma optic neuropathy subjects were selected based on presence of non-glaucomatous optic nerve pallor and past diagnostic history that included non-arteritic ischemic optic neuropathy (NAION), traumatic optic neuropathy, multiple sclerosis, benign intracranial tumor and undefined optic neuropathy. All data were collected during a single encounter visit.
Out of the 41 subjects that participated, 18 were females and 23 were males. The average age of the subjects was approximately 58 (7.52) and ranged from 41 to 71. According to self-reported ethnicity, 20 subjects were Afro-Caribbean, 13 African Americans, 5 Hispanics, 2 Whites and 1 Asian. Thirty-three subjects had glaucomatous optic neuropathy and eight subjects had optic neuropathy other than glaucoma. The varied diagnosis of non-glaucomatous optic neuropathy included NAION, traumatic optic neuropathy, multiple sclerosis, benign intracranial tumor and undefined optic neuropathy.
Examination instruments used in the study included a neutral density (ND) filter bar (Richmond Products) and SD-OCT (RTVue-100, Optovue). Quantification of a RAPD was accomplished by similar methods previously documented.1,2,14–18 A ND filter bar was positioned in front of the eye without the RAPD. A binocular indirect ophthalmoscope set at maximum light intensity was held approximately 30cm away and directly positioned in front of the face of the subject during the testing. Examination room lighting was kept consistent at a mesopic level illumination. The subjects were given an adaptation period of approximately 60s at the mesopic illumination level before commencing testing. The swinging flashlight test technique protocol was followed. The light source was held at a constant pause time of 3s for each eye while the patient fixated at a dim light at the end of the examining room. Increased magnitude of ND filters was added as necessary. After 4–5 swings the test was stopped and both pupils were illuminated with the light source to reduce retinal light adaptation and asymmetric retinal bleaching. The endpoint was established and recorded when a stall or weak constriction was observed in the eye affected by a RAPD. Neutralization measurements were obtained by two independent trained observers each masked to the results of the other. The average of the RAPD measurements from the two observers was used as one of the study variables. A resting time between observers’ measurements of approximately 60s was given to the subject.
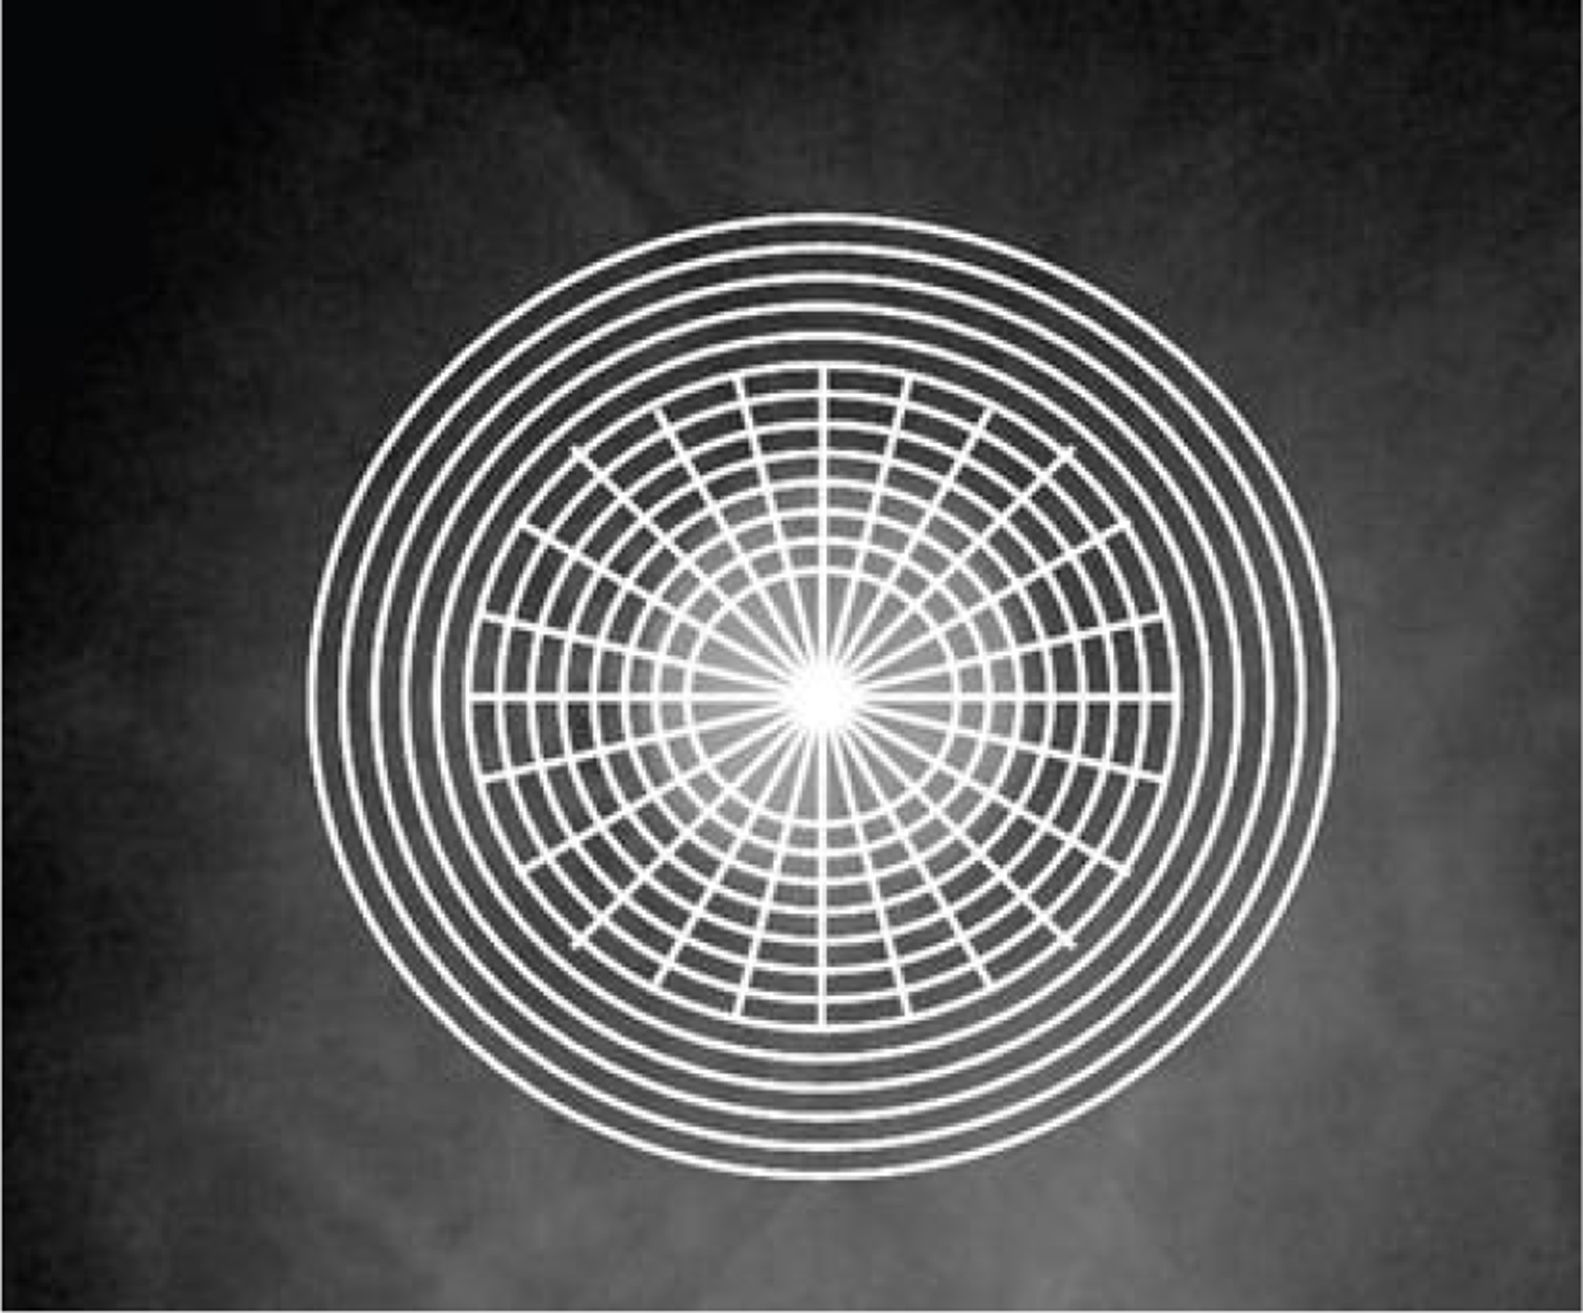
SD-OCT measurements were obtained with the RTVue-100. The optic nerve head (ONH) pattern combines the circumpapillary RNFLT and ONH shape parameters both measured from a common center point. The SD-OCT generates thirteen circumpapillary circle scans with a diameter range from 1.3 to 4.9mm and twelve 3.7mm long radial scans to acquire the ONH pattern.11,19 This region was identified for the purpose of this study as circumpapillary RNFLT (cpRNFLT). The five outlying eccentric circles of the ONH pattern were separately analyzed and was identified for the purpose of this study as peripheral circumpapillary RNFLT (pcpRNFLT). The average (cpRNFLTA), superior (cpRNFLTS) and inferior (cpRNFLTI) parameters of cpRNFLT were examined. Similarly, the average (pcpRNFLTA), superior (pcpRNFLTS) and inferior (pcpRNFLTI) parameters of pcpRNFLT were analyzed (Fig. 1). The GCC scanning pattern covers a 7mm square area centered 1mm temporal to the fovea. It acquires 15 vertical linear scans and a single horizontal line scan at the midpoint of the vertical lines.11 The GCC average (GCCA), GCC superior (GCCS), GCC inferior (GCCI), focal loss volume percentage (FLV%) and global loss volume percentage (GLV%) parameters were analyzed. The percentage difference between the subjects’ two eyes measurements was used in the correlation analysis with the RAPD. The SD-OCT measurements were obtained by a trained technician or an Optometric Physician. Percentage difference of RNFLT loss was calculated relative to the non-RAPD eye. Statistical analysis was performed using Pearson's pairwise correlations with a Bonferroni adjustment, ANOVA and ANCOVA models with a Tukey pairwise comparisons. A random coefficient model was created to examine the individual changes.
 in this study. The five outlying eccentric circles of the ONH pattern were separately analyzed and were identified as peripheral circumpapillary RNFLT (pcpRNFLT).")
RTVue scan pattern. Thirteen peripapillary circle scans with a diameter range from 1.3 to 4.9mm and twelve 3.7mm long radial scans are used to acquire the ONH pattern. This region was identified as circumpapillary RNFLT (cpRNFLT) in this study. The five outlying eccentric circles of the ONH pattern were separately analyzed and were identified as peripheral circumpapillary RNFLT (pcpRNFLT).
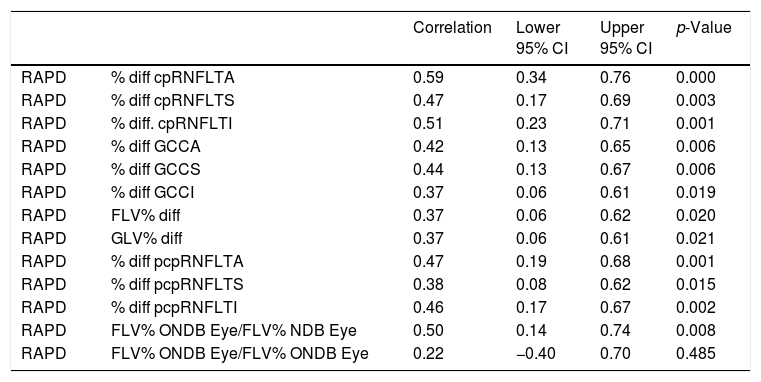
There was a 15% one log unit disagreement between observer's RAPD measurements using ND filters. In such cases the lower RAPD value was used in the correlation analysis. Using Pearson's pairwise correlations with a Bonferroni adjustment the percentage difference loss of all cpRNFLT parameters significantly correlated with a RAPD. The pcpRNFLT percentage difference loss was significant for all quadrants as well. The percentage difference loss of all GCC parameters showed significant correlations (Table 1). Using ANCOVA, the FLV% difference loss when the FLV% of the eye with the RAPD fell outside the RTVue-100, Optovue normative database but the FLV% of the contralateral eye did not fall outside the RTVue-100, Optovue normative database correlated significantly with the RAPD. The FLV% difference loss when the FLV% of the RAPD and the FLV% of the contralateral fell outside the RTVue-100, Optovue normative database did not correlate significantly with the RAPD (Table 1).
Pearson's pairwise correlations with a Bonferroni adjustment for relative afferent pupillary defect (RAPD) with spectral domain optical coherence tomography (SD-OCT) parameters.
| Correlation | Lower 95% CI | Upper 95% CI | p-Value | ||
|---|---|---|---|---|---|
| RAPD | % diff cpRNFLTA | 0.59 | 0.34 | 0.76 | 0.000 |
| RAPD | % diff cpRNFLTS | 0.47 | 0.17 | 0.69 | 0.003 |
| RAPD | % diff. cpRNFLTI | 0.51 | 0.23 | 0.71 | 0.001 |
| RAPD | % diff GCCA | 0.42 | 0.13 | 0.65 | 0.006 |
| RAPD | % diff GCCS | 0.44 | 0.13 | 0.67 | 0.006 |
| RAPD | % diff GCCI | 0.37 | 0.06 | 0.61 | 0.019 |
| RAPD | FLV% diff | 0.37 | 0.06 | 0.62 | 0.020 |
| RAPD | GLV% diff | 0.37 | 0.06 | 0.61 | 0.021 |
| RAPD | % diff pcpRNFLTA | 0.47 | 0.19 | 0.68 | 0.001 |
| RAPD | % diff pcpRNFLTS | 0.38 | 0.08 | 0.62 | 0.015 |
| RAPD | % diff pcpRNFLTI | 0.46 | 0.17 | 0.67 | 0.002 |
| RAPD | FLV% ONDB Eye/FLV% NDB Eye | 0.50 | 0.14 | 0.74 | 0.008 |
| RAPD | FLV% ONDB Eye/FLV% ONDB Eye | 0.22 | −0.40 | 0.70 | 0.485 |
Circumpapillary retinal nerve fiber layer average (cpRNFLTA), circumpapillary retinal nerve fiber layer superior (cpRNFTLS), circumpapillary retinal nerve fiber layer inferior (cpRNFLTI), ganglion cell complex average (GCCA), ganglion cell complex superior (GCCS), ganglion cell complex inferior (GCCI), peripheral circumpapillary retinal nerve fiber layer average (pcpRNFLTA), peripheral circumpapillary retinal nerve fiber layer superior (pcpRNFLTS), peripheral circumpapillary retinal nerve fiber layer inferior (pcpRNFLTI), focal loss volume percentage (FLV%), global loss volume percentage (GLV%), FLV% values outside normative data base (ONDB), FLV% values on normative data base (NDB), confidence interval (CI), probability (p).
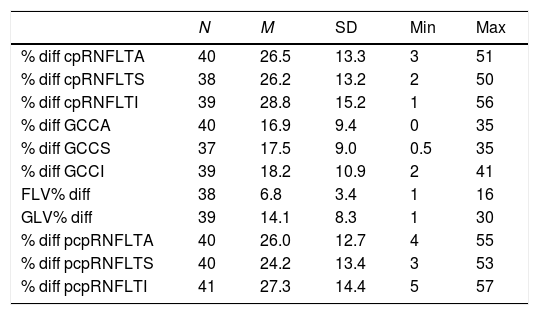
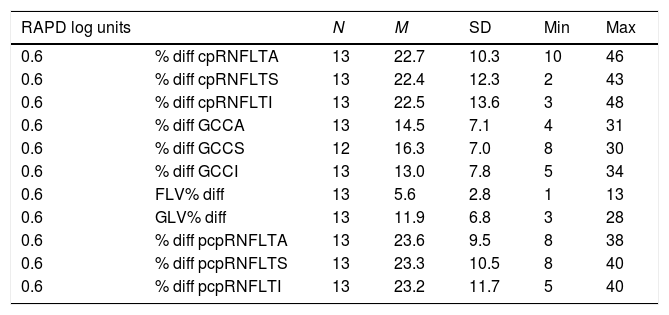
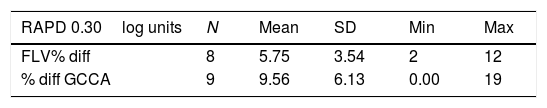
The mean percentage difference loss associated with the RAPD for the cpRNFLT parameters was approximately 27%. For the pcpRNFLT parameters, the mean percentage difference loss associated with the RAPD was approximately 26%. Corresponding mean percentage difference loss associated with the RAPD for the GCC parameters was just about 17%. For the GLV% and FLV% values, the mean percentage difference loss associated with the RAPD was close to 14% and 7% respectively (Table 2). At 0.6log unit RAPD, the mean percentage difference loss for both cpRNFLT and pcpRNFLT parameters was approximately 23%. The mean percentage difference loss at 0.6log unit RAPD for the GCC values was just about 15%. For the GLV% and FLV% at 0.6log unit RAPD, the mean percentage difference loss was approximately 12% and 6% respectively (Table 3). At 0.3log unit RAPD, the mean percentage difference loss for the GCCA and FLV% was close to 10% and 6% respectively (Table 4). Using a random coefficient model, the expected RAPD for all subjects with an average FLV% difference loss (6.8μm±3.4) was 0.5±0.2. The mean GCCA inter-eye thickness difference in our study was approximately 12.8μm±7.1 at 0.6log unit RAPD and 8.4μm±6.1 at 0.3log unit RAPD. Using a random coefficient model, the expected percent change in RNFLT for all subjects per unit of RAPD was 4.61%±0.46 (13.83% change for 0.3log unit increment). The expected percent change in GCCA for all subjects per unit of RAPD was 3.14% (9.42% change in GCCA percentage for 0.3log unit increment, or approximately 8.5μm change in GCCA for every 0.3log unit increment). Using a random coefficient model, the expected percent change in RAPD for all subjects per unit μm of FLV% difference loss was 0.07±0.5 (4.3% change in FLV% for every 0.3log unit RAPD increment).
The mean percentage difference loss and standard deviation (SD) for spectral domain optical coherence tomography (SD-OCT) parameters associated with a relative afferent pupillary defect (RAPD).
| N | M | SD | Min | Max | |
|---|---|---|---|---|---|
| % diff cpRNFLTA | 40 | 26.5 | 13.3 | 3 | 51 |
| % diff cpRNFLTS | 38 | 26.2 | 13.2 | 2 | 50 |
| % diff cpRNFLTI | 39 | 28.8 | 15.2 | 1 | 56 |
| % diff GCCA | 40 | 16.9 | 9.4 | 0 | 35 |
| % diff GCCS | 37 | 17.5 | 9.0 | 0.5 | 35 |
| % diff GCCI | 39 | 18.2 | 10.9 | 2 | 41 |
| FLV% diff | 38 | 6.8 | 3.4 | 1 | 16 |
| GLV% diff | 39 | 14.1 | 8.3 | 1 | 30 |
| % diff pcpRNFLTA | 40 | 26.0 | 12.7 | 4 | 55 |
| % diff pcpRNFLTS | 40 | 24.2 | 13.4 | 3 | 53 |
| % diff pcpRNFLTI | 41 | 27.3 | 14.4 | 5 | 57 |
Circumpapillary retinal nerve fiber layer average (cpRNFLTA), circumpapillary retinal nerve fiber layer superior (cpRNFLTS), circumpapillary retinal nerve fiber layer inferior (cpRNFLTI), ganglion cell complex average (GCCA), ganglion cell complex superior (GCCS), ganglion cell complex inferior (GCCI), peripheral circumpapillary retinal nerve fiber layer average (pcpRNFLTA), peripheral circumpapillary retinal nerve fiber layer superior (pcpRNFLTS), peripheral circumpapillary retinal nerve fiber layer inferior (pcpRNFLTI), focal loss volume percentage (FLV%), global loss volume percentage (GLV%).
The mean percentage difference loss and standard deviation (SD) for spectral domain optical coherence tomography (SD-OCT) parameters associated with a 0.6log unit relative afferent pupillary defect (RAPD).
| RAPD log units | N | M | SD | Min | Max | |
|---|---|---|---|---|---|---|
| 0.6 | % diff cpRNFLTA | 13 | 22.7 | 10.3 | 10 | 46 |
| 0.6 | % diff cpRNFLTS | 13 | 22.4 | 12.3 | 2 | 43 |
| 0.6 | % diff cpRNFLTI | 13 | 22.5 | 13.6 | 3 | 48 |
| 0.6 | % diff GCCA | 13 | 14.5 | 7.1 | 4 | 31 |
| 0.6 | % diff GCCS | 12 | 16.3 | 7.0 | 8 | 30 |
| 0.6 | % diff GCCI | 13 | 13.0 | 7.8 | 5 | 34 |
| 0.6 | FLV% diff | 13 | 5.6 | 2.8 | 1 | 13 |
| 0.6 | GLV% diff | 13 | 11.9 | 6.8 | 3 | 28 |
| 0.6 | % diff pcpRNFLTA | 13 | 23.6 | 9.5 | 8 | 38 |
| 0.6 | % diff pcpRNFLTS | 13 | 23.3 | 10.5 | 8 | 40 |
| 0.6 | % diff pcpRNFLTI | 13 | 23.2 | 11.7 | 5 | 40 |
Circumpapillary retinal nerve fiber layer average (cpRNFLA), circumpapillary retinal nerve fiber layer superior (cpRNFLS), circumpapillary retinal nerve fiber layer inferior (cpRNFLI), ganglion cell complex average (GCCA), ganglion cell complex superior (GCCS), ganglion cell complex inferior (GCCI), peripheral circumpapillary retinal nerve fiber layer average (pcpRNFLA), peripheral circumpapillary retinal nerve fiber layer superior (pcpRNFLS), peripheral circumpapillary retinal nerve fiber layer inferior (pcpRNFLI), focal loss volume percentage (FLV%), global loss volume percentage (GLV%). N=13 reflects numbers of subjects having a 0.6log unit RAPD. One of the GCCS measurements was excluded from the analysis and N=12 in that group.
The mean percentage difference loss and standard deviation (SD) for spectral domain optical coherence tomography (SD-OCT) parameters associated with a 0.3log unit relative afferent pupillary defect (RAPD).
| RAPD 0.30log units | N | Mean | SD | Min | Max |
|---|---|---|---|---|---|
| FLV% diff | 8 | 5.75 | 3.54 | 2 | 12 |
| % diff GCCA | 9 | 9.56 | 6.13 | 0.00 | 19 |
Focal loss volume percentage (FLV%), ganglion cell complex average (GCCA). The difference in number of subjects (n) reflects subjects pertaining to each respective category.
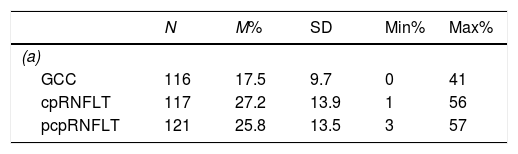
Using pairwise comparison, the percentage difference loss of the grouped cpRNFLT parameters and the percentage difference loss of the grouped GCC parameters were significantly different. Similarly, the percentage difference loss of the grouped pcpRNFLT parameters and the percentage difference loss of the grouped GCC parameters were also significantly different. No significant difference was observed between the grouped cpRNFLT parameters percentage difference loss and the grouped pcpRNFLT parameters percentage difference loss. Using one-way ANOVA with a Tukey HSD post hoc test, there was a significant difference among the means of the percentage difference loss for all three parameters (grouped cpRNFLT, grouped pcpRNFLT, grouped GCC). The mean of the grouped GCC parameters percentage difference loss was thus significantly different from the mean of the grouped cpRNFLT parameters percentage difference loss and from the mean of the grouped pcpRNFLT parameters percentage difference loss. However, the mean of the grouped cpRNFLT parameters percentage difference loss and the mean of the grouped pcpRNFLT parameters percentage difference loss were not significantly different. The mean of the grouped GCC parameters percentage difference loss was approximately 10μm thinner than the mean of the grouped cpRNFLT parameters percentage difference loss. The mean of the grouped GCC parameters percentage difference loss was 8μm thinner than the mean of the grouped pcpRNFLT parameters percentage difference loss (Table 5a and b).
(a and b) Descriptive statistic comparison of the percentage difference loss of the grouped circumpapillary retinal nerve fiber layer (cpRNFLT), grouped peripheral circumpapillary retinal nerve fiber layer (pcpRNFLT) parameters and grouped ganglion cell complex (GCC) parameters, confidence interval (CI), probability (p), standard deviation (SD). One-way ANOVA with a Tukey HSD post hoc test, there is a significant difference by measurement, F (2, 351)=20.38, p<0.001, η2=0.10. Pairwise comparisons show grouped GCC parameters are significantly different from that of the grouped cpRNFLT and grouped pcpRNFLT (p=0.000), grouped cpRNFLT and grouped pcpRNFLT parameters are not significantly different (p=0.673). The mean of the grouped GCC percentage difference loss is significantly different from that of the mean of the grouped cpRNFLT and the mean of the grouped pcpRNFLT percentage difference loss. The mean of the grouped cpRNFLT and the mean of the grouped pcpRNFLT percentage difference loss are not significantly different.
| N | M% | SD | Min% | Max% | |
|---|---|---|---|---|---|
| (a) | |||||
| GCC | 116 | 17.5 | 9.7 | 0 | 41 |
| cpRNFLT | 117 | 27.2 | 13.9 | 1 | 56 |
| pcpRNFLT | 121 | 25.8 | 13.5 | 3 | 57 |
| Diff | Lower 95% CI | Upper 95% CI | p-Adjusted | |
|---|---|---|---|---|
| (b) | ||||
| cpRNFLT vs. GCC | 9.7 | 5.8 | 13.5 | 0.000 |
| pcpRNFLT vs. GCC | 8.3 | 4.5 | 12.1 | 0.000 |
| pcpRNFLT vs. cpRNFLT | −1.4 | −5.2 | 2.4 | 0.673 |
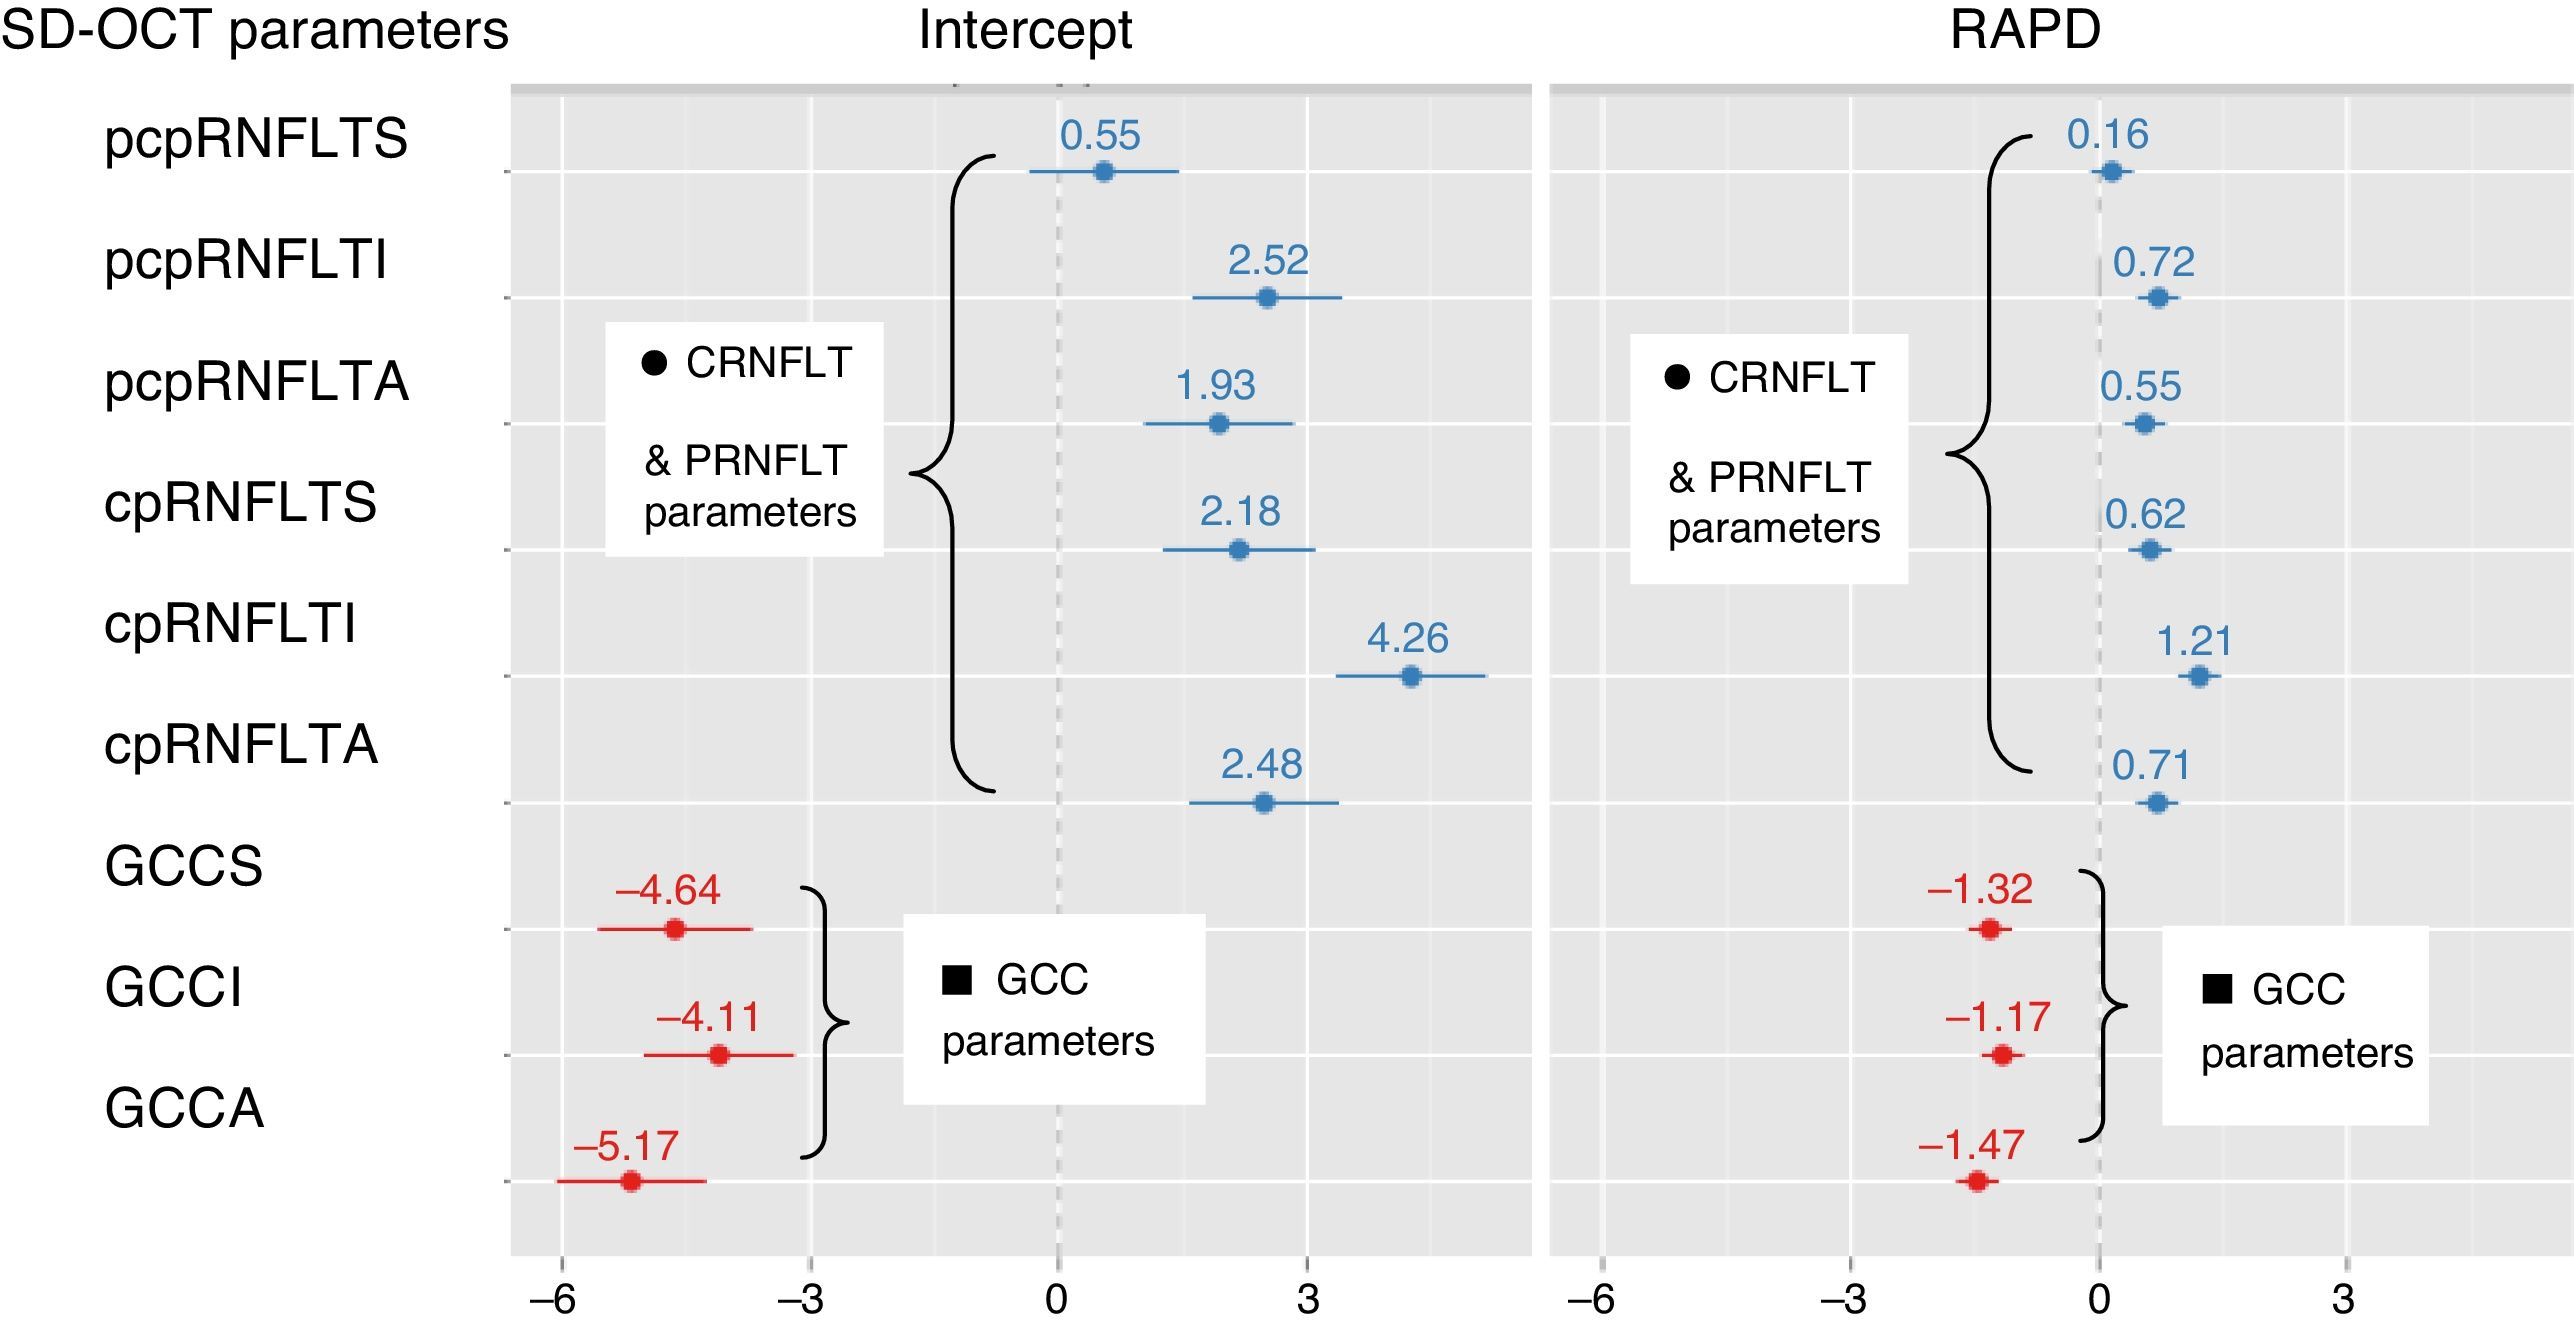
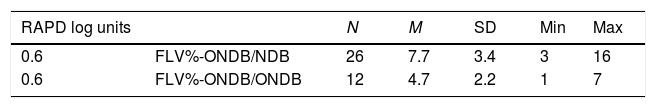
The means of FLV% difference loss for when the FLV% of the RAPD eye and the FLV% of the contralateral eye fell outside the RTVue-100, Optovue normative database, and for when the FLV% of the eye with the RAPD fell outside the RTVue-100, Optovue normative database but the FLV% of the contralateral eye did not, were significantly different. The slopes of the correlations of RAPD and FLV% difference loss, for when the FLV% of the RAPD eye and the FLV% of the contralateral eye fell outside the normative database, and for when only the FLV% of the eye with the RAPD fell outside the normative database, were not significantly different from each other (Table 6). The slopes of the RAPD vs. the percentage difference loss of GCC parameters were significantly different from that of the RAPD vs. percentage difference loss of cpRNFLT parameters and pcpRNFLT parameters. Using a random coefficient model there was a significant difference between the slopes (Table 7 and Fig. 2).
Analysis of the correlation (ANCOVA) of relative afferent pupillary defect (RAPD) and focal loss volume percentage (FLV%) difference loss, when the FLV% of eye with the RAPD and that of the contralateral eye fell outside the normative database (ONDB) compared to when the FLV% of the eye with a RAPD fell outside the normative database but not that of the contralateral (NDB), confidence interval (CI), standard error (Se). Using analysis of covariance (ANCOVA) there is no difference between the slopes: F (1, 34)=0.12, p=0.724. There is a significant difference in the mean of the FLV% difference loss between FLV% ONDB/NDB (7.7±3.4) and FLV% ONDB/ONDB (4.7±2.2), t(36)=2.87, p≤0.006.
| RAPD log units | N | M | SD | Min | Max | |
|---|---|---|---|---|---|---|
| 0.6 | FLV%-ONDB/NDB | 26 | 7.7 | 3.4 | 3 | 16 |
| 0.6 | FLV%-ONDB/ONDB | 12 | 4.7 | 2.2 | 1 | 7 |
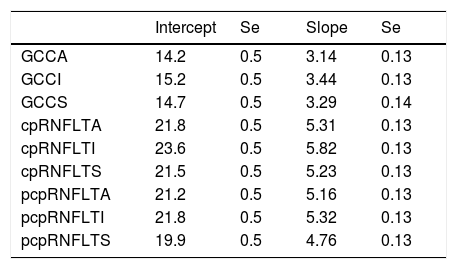
Slope analysis of relative afferent pupillary defect (RAPD) with the percentage difference of spectral domain optical coherence tomography (SD-OCT) parameters.
| Intercept | Se | Slope | Se | |
|---|---|---|---|---|
| GCCA | 14.2 | 0.5 | 3.14 | 0.13 |
| GCCI | 15.2 | 0.5 | 3.44 | 0.13 |
| GCCS | 14.7 | 0.5 | 3.29 | 0.14 |
| cpRNFLTA | 21.8 | 0.5 | 5.31 | 0.13 |
| cpRNFLTI | 23.6 | 0.5 | 5.82 | 0.13 |
| cpRNFLTS | 21.5 | 0.5 | 5.23 | 0.13 |
| pcpRNFLTA | 21.2 | 0.5 | 5.16 | 0.13 |
| pcpRNFLTI | 21.8 | 0.5 | 5.32 | 0.13 |
| pcpRNFLTS | 19.9 | 0.5 | 4.76 | 0.13 |
Circumpapillary retinal nerve fiber layer average (cpRNFLTA), circumpapillary retinal nerve fiber layer superior (cpRNFLTS), circumpapillary retinal nerve fiber layer inferior (cpRNFLTI), ganglion cell complex average (GCCA), ganglion cell complex superior (GCCS), ganglion cell complex inferior (GCCI), peripheral circumpapillary retinal nerve fiber layer average (pcpRNFLTA), peripheral circumpapillary retinal nerve fiber layer superior (pcpRNFLTS), peripheral circumpapillary retinal nerve fiber layer inferior (pcpRNFLTI). Using a random coefficient model, which calculates random intercepts and random slopes there is a significant difference between the slopes [c2=(2)=7.02, p=0.03]. The slopes of the RAPD vs. the percentage difference of ganglion cell complex are significantly different from the percentage difference of circumpapillary and peripheral circumpapillary retinal nerve fiber layer thickness parameters. The expected RNFLT percentage loss for all subjects with an average RAPD (0.88±0.54) is 19.34 with a standard deviation of 3.64. The expected percent change in RNFLT for all subjects per unit of RAPD is 4.61%, with a standard deviation of 0.46. For the GCCA the expected percentage change per 0.3log unit is approximately 9.42% (slope of GCCA per .1log unit=3.14). At 0.6log unit the GCCA difference was approximately 12.8μm. Thus, (12.8μm)×(9.42%)/14.18%=8.5μm the expected approximate GCCA change for every 0.3log unit increment.
![Random intercept and slope analysis of relative afferent pupillary defect (RAPD) with the percentage difference of spectral domain optical coherence tomography (SD-OCT) parameters; circumpapillary retinal nerve fiber layer thickness (cpRNFLT) and peripheral circumpapillary retinal nerve fiber layer thickness (pcpRNFLT) parameters (dark circle ●). Ganglion cell complex (GCC) parameters (dark square ■). The slopes of the RAPD vs. the percentage difference loss of GCC are significantly different [c2=(2)=7.02, p=0.03] from the percentage difference loss of cpRNFLT and pcpRNFLT.](https://static.elsevier.es/multimedia/18884296/0000001100000002/v1_201804030419/S1888429617300390/v1_201804030419/en/main.assets/gr2.jpeg?xkr=ue/ImdikoIMrsJoerZ+w93meMsSv3kCFu9ka1kgzl/xrK32s3f4YRcWD6Dd7AXard722iOneS35VmWKK99mmCdwIm0ywc0MoY9mrVwnZ/n6B6UJiTDk0I05q/6vNRT7MxvEk0ggcvadyRI7i04L+KUC0wIYClcMwyIgSjRnBGcLKCLNVTZQorP/77UX8nyXvTcbLHaCo+bvxhadotjrBjtYbVqJvTX+PSqVBX2uw/z6r1Xs5hFwGuRUuQwUTE02NaUkazEctcBb+qbVDXw0KoKOW1wGIW2Thn/E/KDqPkI8= "Random intercept and slope analysis of relative afferent pupillary defect (RAPD) with the percentage difference of spectral domain optical coherence tomography (SD-OCT) parameters; circumpapillary retinal nerve fiber layer thickness (cpRNFLT) and peripheral circumpapillary retinal nerve fiber layer thickness (pcpRNFLT) parameters (dark circle ●). Ganglion cell complex (GCC) parameters (dark square ■). The slopes of the RAPD vs. the percentage difference loss of GCC are significantly different [c2=(2)=7.02, p=0.03] from the percentage difference loss of cpRNFLT and pcpRNFLT.")
Random intercept and slope analysis of relative afferent pupillary defect (RAPD) with the percentage difference of spectral domain optical coherence tomography (SD-OCT) parameters; circumpapillary retinal nerve fiber layer thickness (cpRNFLT) and peripheral circumpapillary retinal nerve fiber layer thickness (pcpRNFLT) parameters (dark circle ●). Ganglion cell complex (GCC) parameters (dark square ■). The slopes of the RAPD vs. the percentage difference loss of GCC are significantly different [c2=(2)=7.02, p=0.03] from the percentage difference loss of cpRNFLT and pcpRNFLT.
In some subjects, some of the RNFLT and GCC values of the eyes with RAPD were thicker than those of their corresponding contralateral non-RAPD eyes. This discrepancy was observed in 2.5–9.8% of some parameters. This was not consistent across all parameters within the same subject. Furthermore, it was observed only in subjects with glaucoma. This discrepancy was noticed in some eyes with values falling outside the RTVue-100, Optovue normative database, some eyes having close value magnitudes between both eyes and also in some eyes with values within the normative database. All of these values were excluded from the correlation analysis. In addition, the FLV% mean difference loss for one subject having the value of the two eyes outside the RTVue-100, Optovue normative database, was considered to be an outlier when compared to other subjects whose values were also outside the RTVue-100, Optovue normative database in both eyes, and was excluded from the correlation analysis. The differences in the numbers of subjects analyzed (n) in our data reflect this fact.
DiscussionFindings from our investigation to the best of our knowledge have not been previously documented. There was a more sensitive correlation of GCC parameters with RAPD compared to cRNFL. The FLV% was the most sensitive of all parameters that correlated with the RAPD. The GCC NFL loss associated with a RAPD measured by ND filters was comparable to the SD-OCT RNFL loss documented using an automated pupilometer. In addition the cRNFL loss associated with a RAPD was analogous to those reported for other TD-OCT based studies.
TD-OCT studies have documented RNFLT loss associated with a clinically detectable RAPD using the swinging flash light test and ND filters.3–7 Tatsumi et al. documented approximately 27% RNFLT loss associated with a 0.6log unit in patients with glaucoma.3 In glaucoma patients, Chew et al. described the presence of RNFLT loss of 17% associated with a RAPD range from 0.3 to 0.9log units.5 Nakanishi and co-investigators documented 25% loss associated with a clinically detectable RAPD and 23% loss at 0.6log unit in patients with optic neuropathy of diverse etiologies.7 Younis and Eggenberger recognized the presence of a RAPD when the mean difference in total RNFLT was 6.15μm in patients with demyelinating optic neuropathy.4 The superior and inferior quadrants showed stronger correlation with the RAPD. Paradoxically, they also noticed approximately 30% of subjects having thicker RNFLT in the affected eye. Cettomai et al. noticed a 11.7μm difference when comparing the mean RNFL of eyes having a RAPD to eyes without.6
We found a stronger correlation between the RAPD and the cpRNFLTA and pcpRNFLTA loss followed by the inferior and superior quadrants of both parameters. Similar to our results, Tatsumi et al. and Chew et al. observed stronger correlation in the inferior vs. the superior quadrant.3,5 In our study, the mean difference of cpRNFLT across all of the quadrants at 0.6log unit RAPD was approximately 23%. This is similar to what has been documented by the TD-OCT studies of Tatsumi et al. with glaucoma patients, and those of Nakanishi et al. with subjects having diverse optic neuropathies. Our values ranging below those of Tatsumi et al. and that of Nakanishi et al. may be related to the combination of glaucoma and other types of optic neuropathy in our study.3,7 Chew et al. indicated that when the RNFLT loss was 17%, a percentage amount similar to our study, the sensitivity and specificity of a RAPD being present was 72% and 100% respectively.5
The significant difference between the mean of the grouped GCC parameters percentage difference loss and the means of both the grouped cpRNFLT parameters percentage difference loss and the grouped pcpRNFLT parameters percentage difference loss suggests that the GCC may measure ganglion cell loss more precisely than RNFL parameters. At 0.6log unit RAPD, the GCCA mean inter-eye difference (GCCA 12.8μm±7.1) in our study was comparable to that described by Chew et al. at the temporal quadrant (13.24μm±2.97), although they indicated that this quadrant was not significantly predictive of a RAPD in their study.5 Interestingly, in our study, at 0.6log unit RAPD, the mean FLV% difference loss was 5.6±2.8. Similarly, at an expected RAPD of 0.45±0.17 for all subjects, the average FLV% difference loss was 6.8±3.4 using a random coefficient model. For the GCCA, the mean percentage difference loss at 0.3log unit RAPD was 9.6±6.1. These values are comparable to the approximate 7% total RNFLT loss associated with the presence of a RAPD in patients with demyelinating optic neuropathy reported by Younis and Eggenberger and the 11.7% loss for eyes with optic atrophy and a RAPD vs. eyes without by Cettomai et al.4,6
Some investigators have suggested that different ganglion cell types may be affected unequally in different optic neuropathies or during their pathological course.3–5 Tatsumi et al. observed an association of a RAPD with the RNFL thickness ratio of the more advanced eyes relative to less advanced eyes that was closer in the vertical quadrants compared to the temporal quadrant. They pointed out that this observation possibly indicated selective vulnerability of magnocellular compared to parvocellular ganglion cells in glaucoma.3 Chew et al. did not find a significant difference of the macular OCT values between the affected subjects and those of controls. Similarly, the temporal RNFL quadrant parameters did not significantly predict the presence of a RAPD. Chew et al. indicated that rather than being indicative of a selective ganglion cell loss, the temporal quadrant RNFL's lack of RAPD prediction could be explained by the fact that visual field loss in glaucoma occurs more eccentrically than other optic neuropathies.5 In our study, all tested GCC parameters significantly correlated with the RAPD. Although the correlation with the RAPD was more sensitive for the GCC compared to cRNFL parameters the correlation was respectively less strong and specific for the GCC parameters. It is possible that only the subjects with non-glaucomatous optic neuropathy had loss in the locality measured by the GCC, which resulted in a less strong correlation for the GCC parameters. However, in glaucoma, peripheral macular thickness parameters correlate more with glaucomatous RNFL loss than central ones.20,21 Also, as indicated by Sihota et al., as the glaucoma severity increases at the macula, the retinal thickness may progressively decrease temporally toward the fovea. Consequently, the significant correlation between the GCC parameters and RAPD could be similarly attributed to our glaucoma subjects.20 We did not compare the findings of the glaucoma subjects with those having non-glaucomatous optic neuropathy since the latter were relatively few and had different varieties of optic neuropathy. An alternative possibility is that while the RTVue-100, Optovue method of assessing the GCC area may have accounted for a more sensitive correlation with the RAPD for the GCC compared to the cpRNFLT parameters, it yielded a less strong and specific correlation for the GCC compared to the cpRNFLT parameters instead. Irrespectively, we consider that these findings do not indicate ganglion cells selective vulnerability.
Since the papillomacular bundle is mostly composed of parvocellular ganglion cell axons, while the magnocellular ganglion cells are mainly distributed at the remaining retinal quadrants,3–7 the significant difference of the slopes of the correlations of RAPD/RNFLT difference loss vs. RAPD/GCC difference loss may suggest a different level of attrition for magnocellular and parvocellular ganglion cells. However, this is not necessarily so, as it may also be attributed to the dissimilar anatomical arrangement of the retinal elements at the zone measured by the GCC compared to that analyzed by RNFLT parameters and a better detection capability of ganglion cells loss by the RTVue-100, Optovue GCC protocol.11,12 For example, intrinsically photosensitive retinal ganglion cells (ipRGCs) known to be involved in triggering the pupillary light reflex are not distributed in homogenous fashion in the retina. These ganglion cells are more concentrated in the superior temporal quadrant. Similarly, although not well understood, ganglion cells have been documented to express a particular resistance to injury.22,23 The area scanned by the GCC may correspond to a less abundant zone of ipRGCs. Due to a less redundancy of ipRGCs in this zone, if damaged to some degree, it may affect the correlation of RNFLT loss to RAPD. Consequently the correlation and its slope at the GCC zone may vary from that at the cpRNFLT. This will not be indicative of a distinct attrition between magonocellular or parvocellular ganglion cells. However, it may also explain the observed higher sensitivity and less specificity of the GCC compared to RNFLT parameters as well as the highest sensitivity of the pattern deviation parameter FLV%. Disease severity in the subjects may similarly have influenced the correlations of each slope since it has been documented that disease severity affects the diagnostic accuracy of the RTVue scanning protocol.10
Few studies have documented correlations of RNFLT loss in subjects with a RAPD using SD-OCT. To the best of our knowledge none have been documented using the RTVue-100, Optovue, nor have compared the correlation of RAPD with GCC and RNFL parameters. Tatham et al. correlated retinal ganglion cells loss using Cirrus SD-OCT with the RAPD measured by a binocular indirect computerized pupilometer in patients with glaucoma and in normal subjects.8 They used the parapapillary RNFLT measurements from a 3.46mm diameter circular scan around the optic nerve calculated by the Cirrus SDCOT. The pupilometer generates a measurement of the RAPD by calculating a RAPD score. Although RAPD log units determined by using ND filters is not transposable to a RAPD score, both quantify the RAPD. Tatham et al. obtained significant correlation between the RAPD score and the RNFLT inter-eye difference. To be able to compare their findings with our results, using their data we calculated their mean percentage RNFLT difference loss compared to the better eye at their stated range of absolute RAPD score (0.08–0.30). This was approximately 8%. At 0.3log unit RAPD, the GCCA mean percentage difference loss in our study (9.6±6.1) was comparable to that of Tatham et al. While we did not analyze the mean percentage difference loss for central RNFLT values at 0.3log unit RAPD, at 0.6log unit RAPD, the mean percentage difference loss for the GCCA (14.5±7.1) and for the cpRNFLT parameters (approximately 23%) were comparably thicker. Since the mean percentage difference loss for the cpRNFLT was thicker than that of the GCCA, we envisage that at 0.6log unit RAPD, the cpRNFLT mean percentage difference loss should be thicker than what was obtained for the GCCA (8.4±5.8) at 0.3log unit RAPD. The lower mean percentage RNFLT difference loss (approximately 8%) documented by Tatham et al. compared to the RFNLT measured in our study (approximately 23%) can be attributed to the use of the automated pupillometers that estimates RAPD with greater sensitivity than ND filters.8,24,25 Using ND filters however, we obtained similar sensitivity to Tatham et al. by measuring the GCC parameters. This may be due to a better ability of GCC parameters to specifically assess tangible ganglion cells loss compared to RNFL parameters.12
Tatham et al. calculated estimates of retinal ganglion cell counts based on a model contributed by Medeiros et al. and Harwerth et al.8,26–29 Tatham et al. also provided a combined structure function index (CSFI). They calculated the CSFI using a percentage ratio which was obtained from the difference of the age-correlated estimated number of RGC in healthy eyes and the number of RGC in the affected individuals, and dividing that difference by the age-correlated estimated number of RGC in healthy eyes.8 They then estimated the differences of the expected RNFLT average, RCG cell number, and CSFI for a range of RAPD scores. At a RAPD of 0.6, their predicted inter-eye RNFLT difference (12μm) corresponded to a RGC difference of 211,963 cells and a CSFI difference of approximately 24%. They mentioned that this CSFI difference was extremely similar to the 25% RGC loss associated with a ND 0.6log unit RAPD, reported in histological studies in primates by Kerrison et al.8,9 The GCCA thickness difference at a ND 0.6log unit RAPD in our study (12.8μm) was also comparable to the RNFLT difference observed by Tatham et al. Thus using Tatham et al. data, the 12.8μm GCCA thickness difference in our study extrapolates to approximately 26% CSFI difference. This is also similar to the 25% RGC loss reported by Kerrison et al.,8,9 At a RAPD score of 0.3, the inter-eye estimated RNFLT, RGC number, and CSFI differences cited by Tatham et al. were 6μm, 105,982 and 12% respectively. In our study, the average GCCA thickness difference (8.4μm±6.1) at a ND 0.3log unit RAPD extrapolates to approximately 16% CSFI difference, which corresponds to the results of Tatham et al. Although a pattern deviation-derived parameter, the mean FLV% difference loss at a ND 0.3log unit RAPD, and 0.6log unit RAPD, were both approximately 6%. This is also comparably close to the 8% RNFLT difference loss observed by Tatham et al. at the stated range of absolute RAPD score (0.08–0.30).
Using Spectralis SD-OCT and automated pupilometer, Chang et al. documented a difference of 3.2μm in RNFLT for every 0.3log unit increment.30 At an absolute RAPD score of 0.50, the mean inter-eye RNFL difference in their glaucoma subjects was 12.5μm. The GCCA difference in our study at 0.6log unit RAPD (12.8μm) was also comparable to that documented by Chang et al. Similarly, extrapolating from the data of Tatham et al., for every 0.3log unit change there would be a 6μm increased RNFLT difference.8 In our calculations for the GCCA percentage difference, the expected unit loss was approximately 9.4% for every 0.3log unit RAPD increment (approximately 8.5μm change in GCCA for every 0.3log unit RAPD increment). For the FLV% percentage difference, the expected loss was approximately 4.3% for every 0.3log unit RAPD increment. This is comparable to the values obtained by both Tatham et al. and Chang et al.8,30
Tatham et al. also analyzed the correlation of RAPD with standard automated perimetry (SAP) results in their subjects.8 They observed that disease severity influenced the inter-eye difference in mean deviation (MD) at a particular RAPD score. They indicated that since SAP threshold corresponds to a logarithmic scale, the resulting MD differences between eyes associated with a RAPD may be influenced by the severity of the optic neuropathy. They highlighted that early in the disease small inter-eye MD differences may correspond to large RGC counts disparities. On the contrary, in advanced stages, smaller inter-eye MD differences may result from small variations in RCG counts. However, they stressed that the inter-eye differences in RGC counts and RNFLT loss associated with a RAPD score were not significantly affected by the severity of optic neuropathy. Thus, absolute differences in RGC counts also tended to decrease as the RGC decreased. Interestingly, we observe an analogous relationship influenced by disease severity for the correlation of FLV% difference loss and RAPD. The correlation was only significant when the optic neuropathy was less advanced in the contralateral eye (FLV% of the eye with the RAPD outside the RTVue-100, Optovue normative database but not that of the contralateral eye). However, the slope of the FLV% difference loss/RAPD correlations, when the FLV% of both eyes were outside the RTVue-100, Optovue normative database and when only that of the RAPD eye was outside the RTVue-100, Optovue normative database, were not significantly different. In addition, the mean of FLV% difference loss was significantly less when the optic neuropathy was advanced in both eyes evidenced by both eyes having FLV% outside the RTVue-100, Optovue normative database values. Although the inter-eye differences in RGC counts and RNFLT associated with the RAPD score and RNFLT loss rate may not be affected by severity of the optic neuropathy,8 the inter-eye difference of the FLV% seems to be affected at a corresponding RAPD value. Thus a larger FLV% inter-eye difference is required to obtain a similar RAPD value when the disease is less advanced. At a certain level of advanced disease, an inter-eye difference of pattern deviation loss no longer correlates to a definite RAPD. Analogously, Rao et al. reported that disease severity affects the diagnostic accuracy of the RTVue-100, Optovue scanning protocol.10
Although noticed in relatively few subjects, the RNFL and GCC values of the eyes with RAPD appeared thicker than those of their corresponding contralateral non-RAPD. Interestingly, the discrepancy was observed only in our subjects with glaucoma. The discrepancy may be due to technical limitations. For instance, reports of localized zones within retinal areas imaged by SD-OCT that have variations in RNFL reflectivity but that appears to have similar RNFLT with en-face OCT, may contribute to an inaccurate measurement of RNFLT.31 The computed segmented algorithms used to identify RNFL boundaries calculations likewise may give rise to anomalous readings.31 Pathophysiological characteristics of the optic neuropathies may also contribute to the incongruity. In advanced glaucoma stages for example, significant RNFLT loss or RNFL hypo-reflectivity may confound the accurate assessment the RNFL.31–33 Likewise, in acute anterior optic neuritis for example, a significant increase in RNFLT has been reported,4,34 but RNFL thinning tends to ensue 3–6 months following the acute episode.34 Similarly, occurrence of inner nuclear layer (ILN) cyst has been documented to increase the volume the RNFL on optic neuropathies including glaucoma.35,36 This may also lead to a misleading quantification of RNFLT. The presentation of non-glaucomatous optic neuropathy in the subjects of our study was chronic however. Since we did not look for INL cysts as part of our study, the contribution of this etiology to the observed discrepancy could not be excluded.
One of the limitations in our study was the relatively small sample size that constrained the analysis involving partial samples of subjects. Nonetheless our statistical analysis provided remarkably similar results to those reported in literature. Similarly, measurements using an automated pupilometer would have possibly provided a more sensitive assessment of the RAPD. However, results in our study using ND filters to determine the RAPD suggest that the GCC protocol may provide similar sensitive correlation as documented by Tatham et al. and Chang et al. using a pupilometer.8,30
ConclusionIn conclusion, significant correlations were observed between RNFLT parameters and RAPD measured with ND filters. At a 0.6log unit RAPD, the average mean percentage difference loss for the cpRNFLT was 22.5 while for the GCC the percentage difference loss was 14.6. The GCC protocol appeared to be 35% more sensitive in contrast to cpRNFLT measurements. The pupillary signal neural network loss that gives rise to a RAPD in glaucomatous and other types of optic neuropathy may follow a pattern of attrition that may be more sensitively determined by FLV%. However, this FLV% sensitivity is likely affected by disease severity. Additional studies utilizing an automated pupilometer may be warranted to determine if a higher correlation sensitivity with the GCC parameters may be attained.
FundingThis project was funded by an internal Nova Southeastern University, Health Profession Division grant number 035684.
Conflicts of interestThe authors have no conflicts of interest to declare.


