


This study compared the measurements of intraocular pressure (IOP) and ocular pulse amplitude (OPA) using the Dynamic Contour Tonometry (DCT) over silicone hydrogel contact lenses of different modulus. Corneal biomechanics were also measured using the Ocular Response Analyzer (ORA).
MethodsForty-seven young (mean age 22.3 years, standard deviation 1.2 years) subjects had IOP, OPA, corneal hysteresis (CH) and corneal resistance factor (CRF) measured without lens and with two brands of silicone hydrogel contact lenses. Each eye wore one brand followed by another, randomly assigned, and then the lenses switched over. Difference and agreement of IOP and OPA with and without silicone hydrogel contact lens were studied.
ResultsThe right and left eyes had similar corneal curvatures, central corneal thicknesses, IOP, OPA and corneal biomechanics at baseline. No significant difference was found in CH and CRF when they were measured over different contact lenses. IOP demonstrated a greater difference (95% limits of agreement: 2.73mmHg) compared with no lens when it was measured over high modulus silicone hydrogel lenses. Agreement improved over low lens modulus silicone hydrogel lenses (95% limits of agreement: 2.2–2.4mmHg). 95% limits of agreement were within 1.0mmHg for OPA.
ConclusionsThis study demonstrated the feasibility of DCT over silicone hydrogel lenses. Low lens modulus silicone hydrogel contact lens in situ has no clinical effect on DCT.
Este estudio comparó las mediciones de la presión intraocular (PIO) y la amplitud del pulso ocular (APO) utilizando la tonometría de contorno dinámico (TCD) en lentes de contacto de hidrogel de silicona con módulos diferentes. También se midió la biomecánica corneal utilizando el analizador de respuesta ocular (ORA).
MétodosSe midieron la PIO, APO, histéresis corneal (HC) y factor de resistencia corneal (FRC) de cuarenta y siete jóvenes pacientes sin y con dos marcas diferentes de lentes de contacto de hidrogel de silicona. A cada ojo se le colocó una lente seguida de la otra marca, elegida al azar, intercambiándose posteriormente las lentes. Se estudiaron la diferencia y la concordancia de la PIO y la APO con y sin lentes de contacto de hidrogel de silicona.
ResultadosLos ojos derechos e izquierdos tenían similares curvaturas, espesores corneales centrales, PIO, APO y biomecánica corneal como punto de partida. No se observó una diferencia significativa en cuanto a HC y FRC al medirse en las diferentes lentes de contacto. La PIO mostró una mayor diferencia (límites de concordancia al 95%: 2,73mmHg) en comparación a la no utilización de lentes, al medirse en las lentes de hidrogel de silicona con elevado módulo de rigidez. La concordancia mejoró en las lentes de hidrogel de silicona con bajo módulo (límites de concordancia al 95%: de 2,2 a 2,4mmHg). Los límites de concordancia al 95% se situaron dentro de un valor de 1,0mmHg para la PAO.
ConclusionesEste estudio demostró la viabilidad de la TCD en las lentes de hidrogel de silicona. Las lentes de contacto de hidrogel de silicona con bajo módulo in situ no tienen un efecto clínico significativo sobre la TCD.
Dynamic contour tonometry (DCT) is a contact procedure where the tonometer probe has a concave surface contour. There is a miniaturized pressure sensor integrated into the center of the contact surface so not only the intraocular pressure (IOP) can be measured, but also the changes in IOP, termed ocular pulse amplitude (OPA) can be obtained. With its special probe design, IOP measured by it has been found not to be affected by central corneal thickness (CCT),1–5 corneal curvature 1–4 and corneal astigmatism.1,3 IOP measurement from DCT showed good concordance with intracameral IOP.6
To prevent cross contamination in contact tonometry, Goldmann applanation tonometry (GAT) can be performed with soft hydrogel7 or silicone hydrogel8 contact lens in situ. There is no effect on the accuracy of GAT from contact lens wear. Nosch et al.9 reported that accurate IOP could be obtained from DCT over a thin soft hydrogel contact lens. However, OPA was measured about 5% lower. Since IOP (around 18mmHg) has a magnitude nearly 5 times higher than OPA (around 3mmHg), OPA measurement could be more sensitively affected with contact lens in situ. Recently, Gogniat et al.10 found that OPA was not affected by contact lens materials or lens power. Interestingly, a significant difference in IOP was observed when it was measured with hydrogel lens but not with silicone hydrogel lens of the same power. They postulated that the stiffness of the silicone hydrogel material may provide a more stable surface for the DCT sensor tip to rest on. Silicone hydrogel lens comes with different stiffness, in terms of lens modulus. Effect of lens material on DCT is unknown.
Applanation tonometry over a contact lens in situ could eliminate topical anesthesia. This would be useful in some European countries as well as in some Asian countries such as Singapore, Taiwan, Malaysia and Korea where optometrists are not allowed to use topical anesthetics. Nowadays, silicone hydrogel contact lens is very popular in particular to be used as a bandage contact lens.11–14 Accurate IOP measurement over silicone hydrogel contact lens will be beneficial to these patients. Newer silicone hydrogel materials have lower modulus (or less stiff). This study aimed at investigating the effect of silicone hydrogel contact lenses of different modulus on IOP and OPA measurements.
Ocular Response Analyser (ORA) is a non-contact tonometer (NCT) which can measure corneal biomechanical properties.15,16 The corneal biomechanical properties measured are corneal hysteresis (CH) and corneal resistance factor (CRF). Both CH and CRF have been found to be reduced after refractive surgeries.17–20 This study also included corneal biomechanics measurement to see if CH and CRF were affected when they were measured over different silicone hydrogel contact lenses.
MethodsNormal young healthy subjects were recruited. Exclusion criteria included subjects with rigid contact lens wear, corneal astigmatism more than 2D, and history of any ocular diseases. Soft contact lens wearers were required to stop contact lens wear for at least 24hours. This study was approved by the ethics committee of the University and was carried out with due regard to the tenets of the Declaration of Helsinki. Details of the study were given to subjects before informed consent was obtained.
Two brands of silicone hydrogel contact lenses with different modulus were used. They were Ciba Vision Air Optix® Focus Night & Day® Aqua (N&D) and Acuvue® Advance® (AA). All the lenses used had back vertex power of −3.00D. These lenses shared similar lens overall diameter (13.8mm versus 14.0mm), center thickness (0.08mm versus 0.07mm) and base cure (8.4mm versus 8.3mm). Their lens modulus values were different (1.5MPa versus 0.43MPa, respectively).
After informed consent, each subject had CH and CRF measured by ORA (Reichert Ophthalmic Instruments, Buffalo, NY), corneal topography and central corneal thickness (CCT) measured by Pentacam Classic (Oculus Inc, Germany) on both eyes. All these procedures were non-contact. In ORA, three measurements were obtained each with a waveform score of at least 3.50.16 In corneal topography, three images were captured using the 50-scan mode and all scans were registered as “OK” for quality assurance.21 The corneal power, in terms of SimK, was converted to its vector form (M, J0 and J45) for analysis.22
After the above baseline measurements, one eye was randomly selected to be fitted with N&D and the fellow eye with AA. After 10min of lens stabilization, CH and CRF were measured by ORA followed by DCT (Ziemer Ophthalmic Systems, Port, Switzerland). Although the latter is a contact procedure, no topical anesthetic was used with the contact lens in situ.7 After the ORA and DCT measurements, lenses were removed and rinsed. The subject had a 5-min rest with no contact lens wear. The same lenses were then re-inserted again for the other eye, followed by ORA and DCT measurements in the same manner. After lens removal and another 5min of rest, one drop of 0.5% proparacaine was instilled in each eye. IOP and OPA were measured again “without lens”. In DCT, three readings of quality score between Q1 and Q3 were obtained, with readings at Q4 or Q5 being discarded.23
Statistical analysisThe standard deviation of IOP difference without lens and with low minus power silicone hydrogel lens was 0.92mmHg (personal communication with Dr. Daniela Nosch). A sample size of 40 has a 80% power to detect a difference of 0.41mmHg without and with contact lens wear.9 Kolmogorov–Smirnov test was used to check for normality. Paired t-tests were used to compare the baseline measurement results between the two eyes. Pearson correlations were studied between CCT and CH, CRF as well as DCT results for each eye. CH and CRF were compared “without lens” and with different contact lenses in situ. DCT measurements (IOP and OPA) were also compared. Repeated measures analysis of variance (ANOVA) was used. Whenever significant difference was found, paired t-tests were performed to find out any pair difference. Alpha was maintained at 0.05 without any Bonferroni adjustment.24 Agreements in DCT without and with lens were compared using the Bland and Altman plots.25
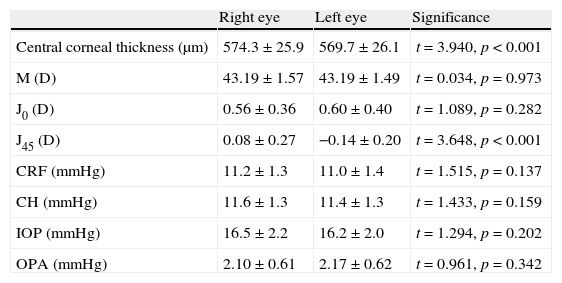
ResultsWe had 47 subjects (21 males) with a mean age of 22.3 years, standard deviation 1.2 years (19–26 years). There were no significant differences between the two eyes at baseline, except the corneal J45 component and CCT (Table 1). The mean difference was 0.23 D for J45 (standard deviation, SD, of 0.42 D) and 4.7μm for CCT (SD of 8.1μm). There were no significant correlations between CCT and DCT parameters in both the right and left eyes. Significant positive correlations were found between CCT and CRF (right eye: r2=0.59, p<0.01; left eye: r2=0.29, p<0.01), and between CCT and CH (right eye: r2=0.37, p<0.01; left eye: r2=0.14, p<0.01).
Summary of Ocular Response Analyzer and dynamic contour tonometry results between the two eyes.
| Right eye | Left eye | Significance | |
| Central corneal thickness (μm) | 574.3±25.9 | 569.7±26.1 | t=3.940, p<0.001 |
| M (D) | 43.19±1.57 | 43.19±1.49 | t=0.034, p=0.973 |
| J0 (D) | 0.56±0.36 | 0.60±0.40 | t=1.089, p=0.282 |
| J45 (D) | 0.08±0.27 | −0.14±0.20 | t=3.648, p<0.001 |
| CRF (mmHg) | 11.2±1.3 | 11.0±1.4 | t=1.515, p=0.137 |
| CH (mmHg) | 11.6±1.3 | 11.4±1.3 | t=1.433, p=0.159 |
| IOP (mmHg) | 16.5±2.2 | 16.2±2.0 | t=1.294, p=0.202 |
| OPA (mmHg) | 2.10±0.61 | 2.17±0.62 | t=0.961, p=0.342 |
M, J0 and J45: corneal curvature vectors; CRF: corneal resistance factor; CH: corneal hysteresis; IOP: intraocular pressure; OPA: ocular pulse amplitude
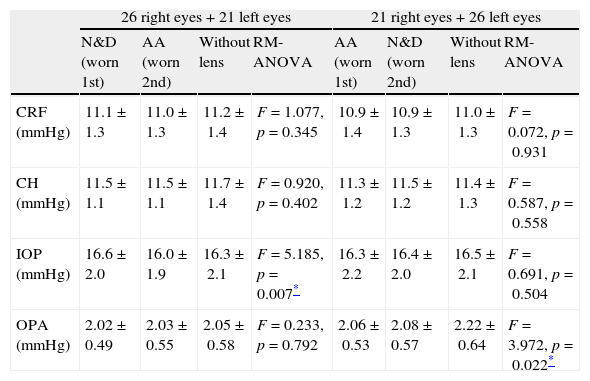
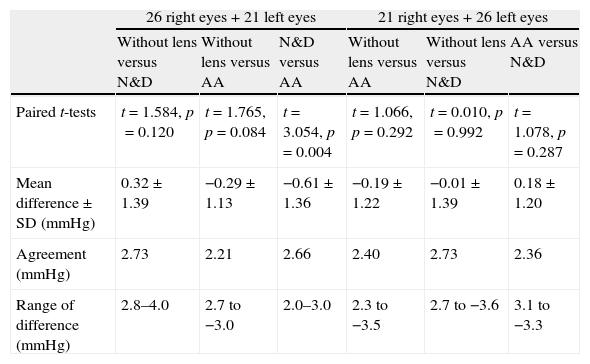
Twenty-six subjects had their right eyes fitted with N&D first followed by AA. The remaining subjects had a reverse wearing sequence. All lens fitting had good centration with adequate lens movement. Table 2 shows the ORA and DCT results with lenses and “without lens”. No significant difference was found in CH and CRF with and without lens (repeated measures ANOVA: p>0.05 in all cases). Comparing with the “without lens” condition, significant difference was found in IOP (repeated measures ANOVA: F=5.185, p=0.007) when it was measured with N&D followed by AA, but not in the reverse sequence of lens wear. Paired t-tests did not identify any significant pair difference comparing with the “without lens” condition. The difference between N&D and AA was significant (Paired t-test: t=3.054, p=0.004) (Table 3).
The Ocular Response Analyzer and dynamic contour tonometry results from different lens wearing sequences.
| 26 right eyes+21 left eyes | 21 right eyes+26 left eyes | |||||||
| N&D (worn 1st) | AA (worn 2nd) | Without lens | RM-ANOVA | AA (worn 1st) | N&D (worn 2nd) | Without lens | RM-ANOVA | |
| CRF (mmHg) | 11.1±1.3 | 11.0±1.3 | 11.2±1.4 | F=1.077, p=0.345 | 10.9±1.4 | 10.9±1.3 | 11.0±1.3 | F=0.072, p=0.931 |
| CH (mmHg) | 11.5±1.1 | 11.5±1.1 | 11.7±1.4 | F=0.920, p=0.402 | 11.3±1.2 | 11.5±1.2 | 11.4±1.3 | F=0.587, p=0.558 |
| IOP (mmHg) | 16.6±2.0 | 16.0±1.9 | 16.3±2.1 | F=5.185, p=0.007* | 16.3±2.2 | 16.4±2.0 | 16.5±2.1 | F=0.691, p=0.504 |
| OPA (mmHg) | 2.02±0.49 | 2.03±0.55 | 2.05±0.58 | F=0.233, p=0.792 | 2.06±0.53 | 2.08±0.57 | 2.22±0.64 | F=3.972, p=0.022* |
N&D: Ciba Vision Air Optix® Focus Night & Day® Aqua. AA: Acuvue® Advance®. RM-ANOVA: repeated measures analysis of variance. CRF: corneal resistance factor; CH: corneal hysteresis; IOP: intraocular pressure; OPA: ocular pulse amplitude.
Paired t-tests and agreement analyses in intraocular pressure from different lens wearing sequences.
| 26 right eyes+21 left eyes | 21 right eyes+26 left eyes | |||||
| Without lens versus N&D | Without lens versus AA | N&D versus AA | Without lens versus AA | Without lens versus N&D | AA versus N&D | |
| Paired t-tests | t=1.584, p=0.120 | t=1.765, p=0.084 | t=3.054, p=0.004 | t=1.066, p=0.292 | t=0.010, p=0.992 | t=1.078, p=0.287 |
| Mean difference±SD (mmHg) | 0.32±1.39 | −0.29±1.13 | −0.61±1.36 | −0.19±1.22 | −0.01±1.39 | 0.18±1.20 |
| Agreement (mmHg) | 2.73 | 2.21 | 2.66 | 2.40 | 2.73 | 2.36 |
| Range of difference (mmHg) | 2.8–4.0 | 2.7 to −3.0 | 2.0–3.0 | 2.3 to −3.5 | 2.7 to −3.6 | 3.1 to −3.3 |
Agreement: 1.96×standard deviation of the difference.
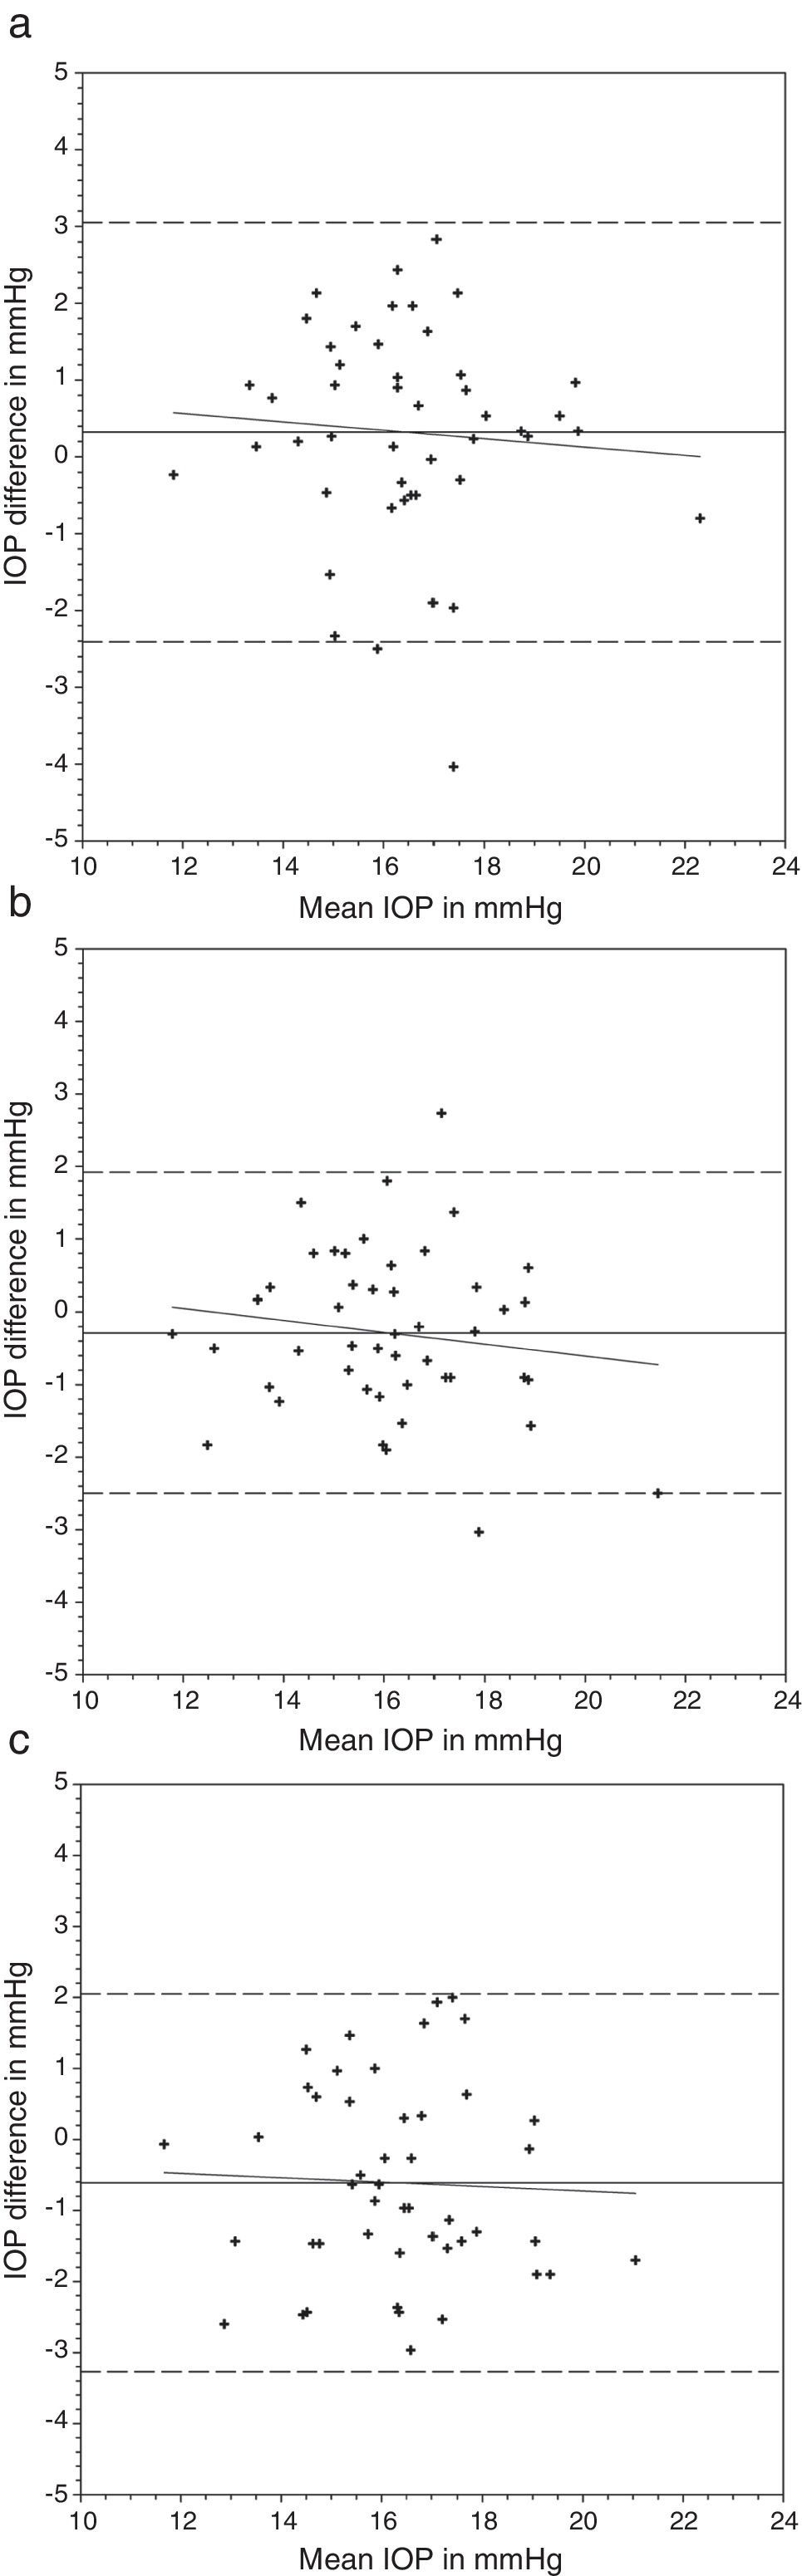
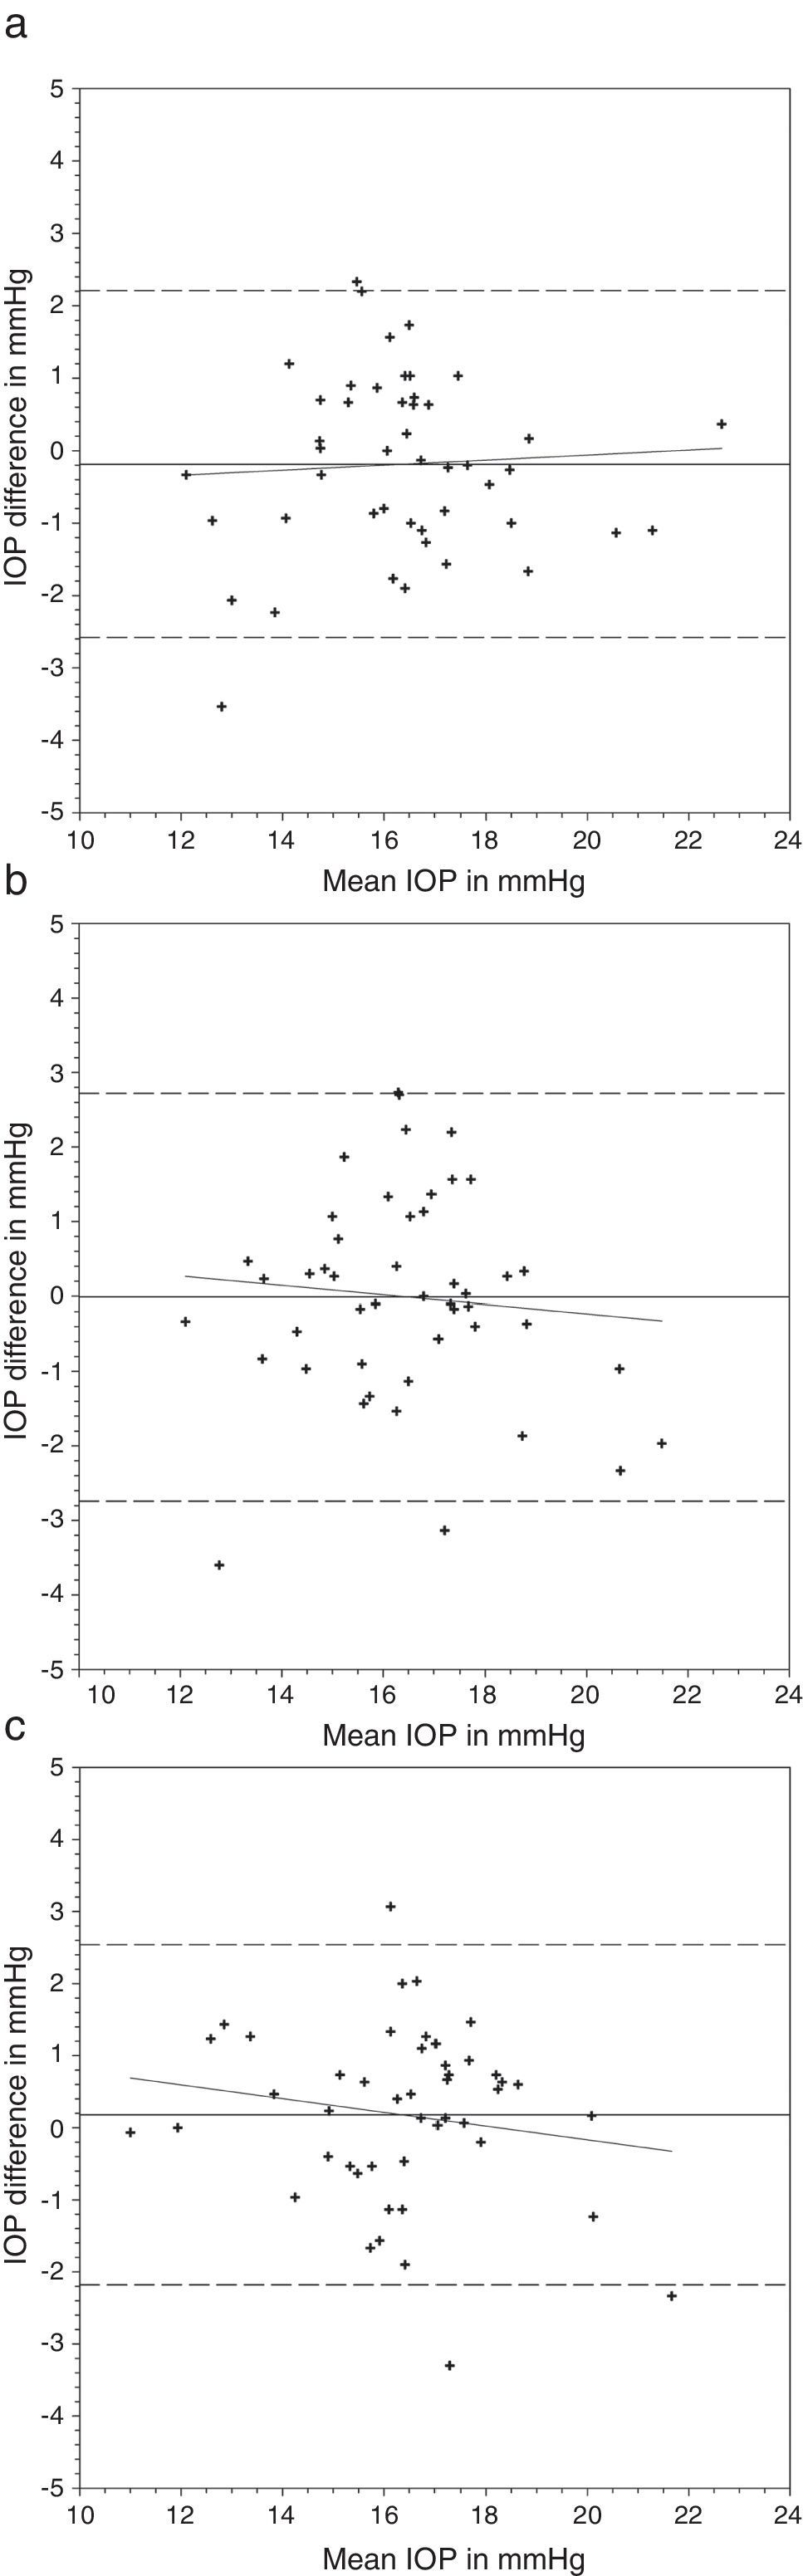
Comparing the IOP obtained with and without lens, a greater difference was found with the N&D lenses in situ (Table 3) (Figs. 1 and 2). Regression analyses could not demonstrate any significant trends. The 95% limits of agreement (1.96×standard deviation of the difference) were greater over N&D lenses.
 from contact lens wear and no lens. Night & Day® was inserted first followed by Acuvue® Advance®. The solid line represents the mean difference, whereas the dotted lines represent the upper and lower limits of agreement. The correlation coefficients (r) are reported. (a) Night & Day® versus no lens (r=−0.074, p=0.62). (b) Acuvue® Advance® versus no lens (r=−0.147, p=0.32). (c) Night & Day® versus Acuvue® Advance® (r=−0.037, p=0.80).")
Bland and Altman plots of agreement between intraocular pressure (IOP) from contact lens wear and no lens. Night & Day® was inserted first followed by Acuvue® Advance®. The solid line represents the mean difference, whereas the dotted lines represent the upper and lower limits of agreement. The correlation coefficients (r) are reported. (a) Night & Day® versus no lens (r=−0.074, p=0.62). (b) Acuvue® Advance® versus no lens (r=−0.147, p=0.32). (c) Night & Day® versus Acuvue® Advance® (r=−0.037, p=0.80).
 from contact lens wear and no lens. Acuvue® Advance® was inserted first followed by Night & Day®. The solid line represents the mean difference, whereas the dotted lines represent the upper and lower limits of agreement. The correlation coefficients (r) are reported. (a) Acuvue® Advance® versus no lens (r=0.062, p=0.68). (b) Night & Day® versus no lens (r=−0.094, p=0.53). (c) Acuvue® Advance® versus Night & Day® (r=−0.155, p=0.30).")
Bland and Altman plots of agreement between intraocular pressure (IOP) from contact lens wear and no lens. Acuvue® Advance® was inserted first followed by Night & Day®. The solid line represents the mean difference, whereas the dotted lines represent the upper and lower limits of agreement. The correlation coefficients (r) are reported. (a) Acuvue® Advance® versus no lens (r=0.062, p=0.68). (b) Night & Day® versus no lens (r=−0.094, p=0.53). (c) Acuvue® Advance® versus Night & Day® (r=−0.155, p=0.30).
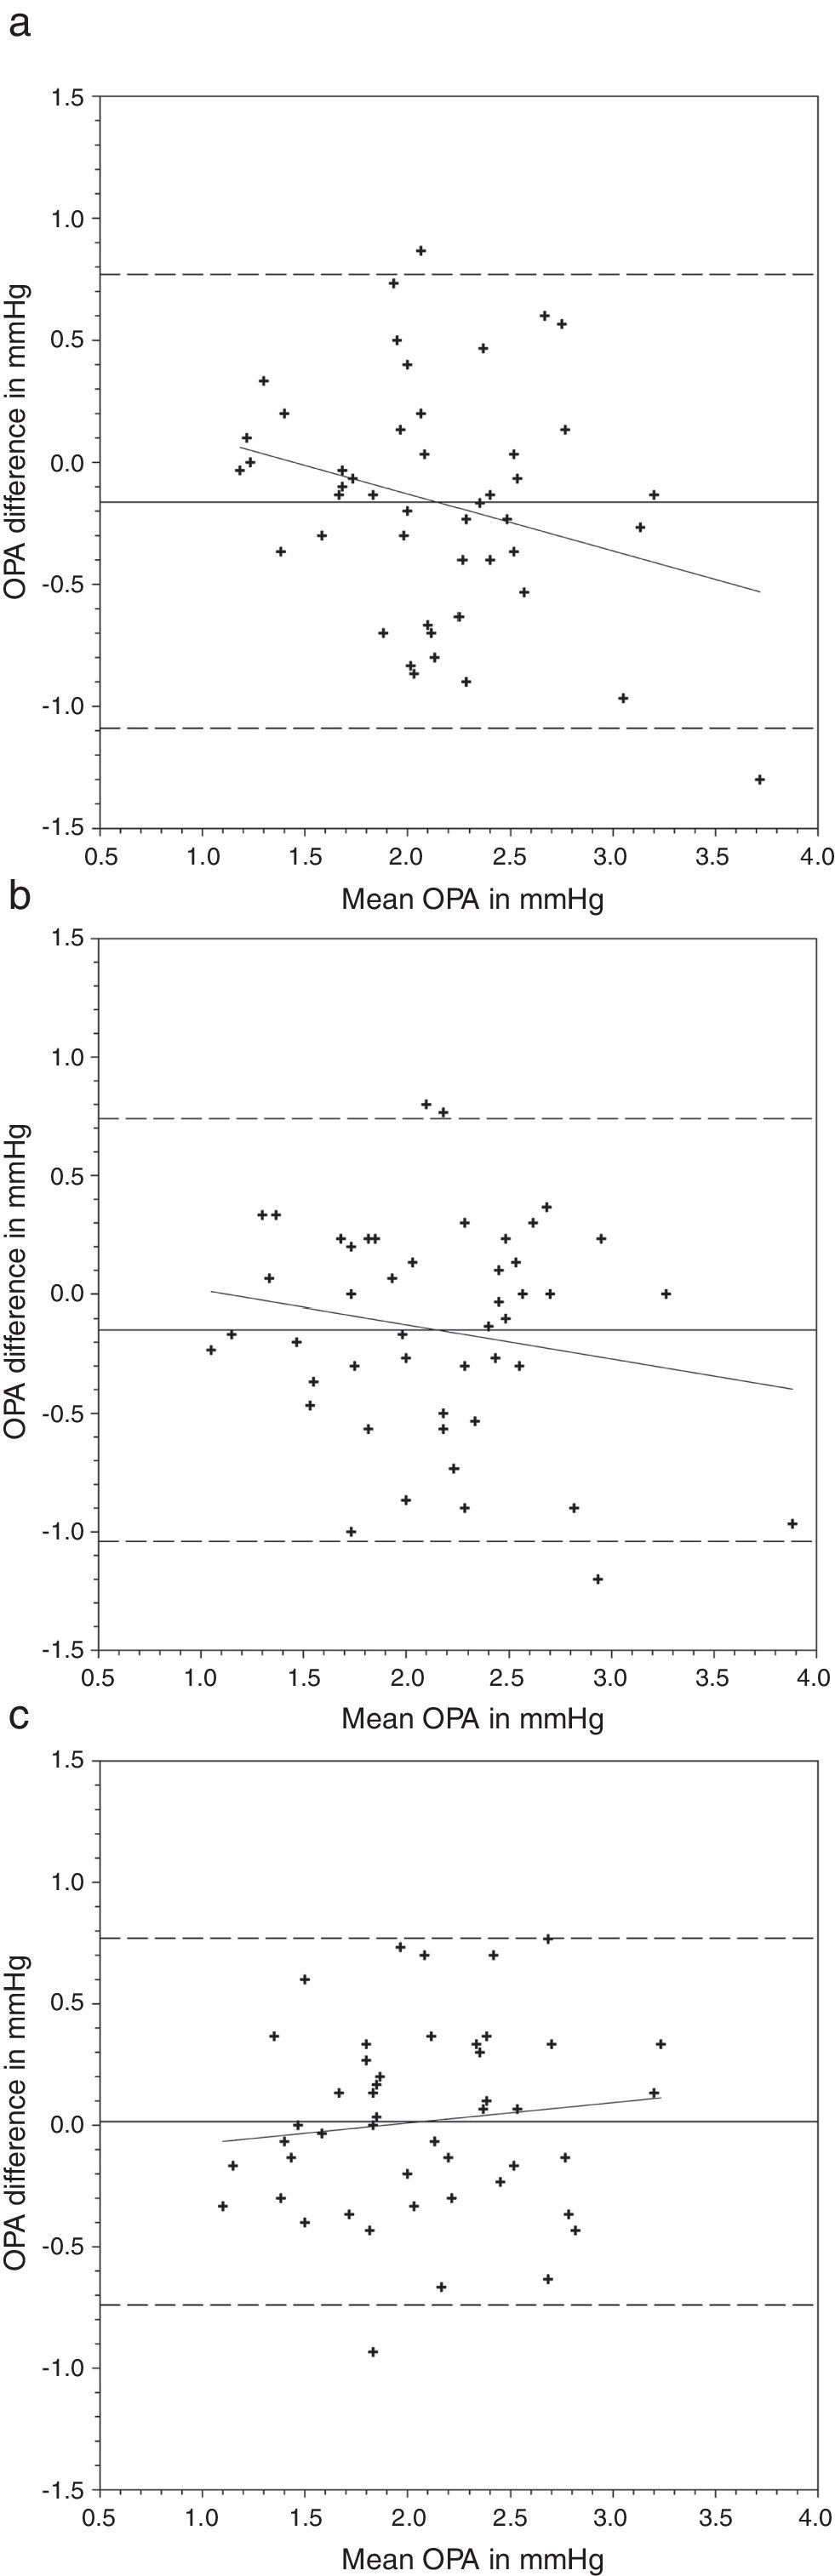
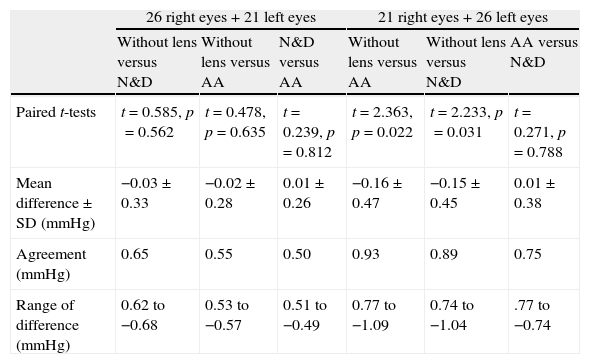
OPA demonstrated a significant difference when it was measured with AA followed by N&D, but not in the reverse sequence of lens wear (Table 2). Paired t-tests found that both lens types demonstrated a lower OPA than without lens (Table 4). Figs. 3 and 4 show the Bland and Altman plots.
Paired t-tests and agreement analyses in ocular pulse amplitude from different lens wearing sequences.
| 26 right eyes+21 left eyes | 21 right eyes+26 left eyes | |||||
| Without lens versus N&D | Without lens versus AA | N&D versus AA | Without lens versus AA | Without lens versus N&D | AA versus N&D | |
| Paired t-tests | t=0.585, p=0.562 | t=0.478, p=0.635 | t=0.239, p=0.812 | t=2.363, p=0.022 | t=2.233, p=0.031 | t=0.271, p=0.788 |
| Mean difference±SD (mmHg) | −0.03±0.33 | −0.02±0.28 | 0.01±0.26 | −0.16±0.47 | −0.15±0.45 | 0.01±0.38 |
| Agreement (mmHg) | 0.65 | 0.55 | 0.50 | 0.93 | 0.89 | 0.75 |
| Range of difference (mmHg) | 0.62 to −0.68 | 0.53 to −0.57 | 0.51 to −0.49 | 0.77 to −1.09 | 0.74 to −1.04 | .77 to −0.74 |
Agreement: 1.96×standard deviation of the difference.
 from contact lens wear and no lens. Night & Day® was inserted first followed by Acuvue® Advance®. The solid line represents the mean difference, whereas the dotted lines represent the upper and lower limits of agreement. The correlation coefficients (r) are reported. (a) Night & Day® versus no lens (r=−0.272, p=0.06). (b) Acuvue® Advance® versus no lens (r=−0.120, p=0.42). (c) Night & Day® versus Acuvue® Advance® (r=0.213, p=0.15).")
Bland and Altman plots of agreement between ocular pulse amplitude (OPA) from contact lens wear and no lens. Night & Day® was inserted first followed by Acuvue® Advance®. The solid line represents the mean difference, whereas the dotted lines represent the upper and lower limits of agreement. The correlation coefficients (r) are reported. (a) Night & Day® versus no lens (r=−0.272, p=0.06). (b) Acuvue® Advance® versus no lens (r=−0.120, p=0.42). (c) Night & Day® versus Acuvue® Advance® (r=0.213, p=0.15).
 from contact lens wear and no lens. Acuvue® Advance® was inserted first followed by Night & Day®. The solid line represents the mean difference, whereas the dotted lines represent the upper and lower limits of agreement. The correlation coefficients (r) are reported. (a) Acuvue® Advance® versus no lens (r=−0.265, p=0.07). (b) Night & Day® versus no lens (r=−0.178, p=0.23). (c) Acuvue® Advance® versus Night & Day® (r=0.113, p=0.45).")
Bland and Altman plots of agreement between ocular pulse amplitude (OPA) from contact lens wear and no lens. Acuvue® Advance® was inserted first followed by Night & Day®. The solid line represents the mean difference, whereas the dotted lines represent the upper and lower limits of agreement. The correlation coefficients (r) are reported. (a) Acuvue® Advance® versus no lens (r=−0.265, p=0.07). (b) Night & Day® versus no lens (r=−0.178, p=0.23). (c) Acuvue® Advance® versus Night & Day® (r=0.113, p=0.45).
Lenses used in this study have different modulus. The Focus Night & Day® lens was the first few brands of silicone hydrogel lenses with high modulus, or is stiffer. The two lenses are different in the water content, 24% versus 47%, respectively. Most patients, especially daily disposal soft hydrogel lens wearers, complained about the lens awareness immediately after lens insertion. The Acuvue® Advance® lens is relatively newer and softer and comes with increased lens comfort.13
Dynamic contour tonometry can be a substitute for GAT on eyes after refractive surgeries.26,27 There has been no significant change in IOP before and after laser in situ keratomileusis (LASIK) while GAT26,27 and NCT27 can be significantly reduced. We shared the same finding as previous studies that DCT parameters were not influenced by CCT.
Nosch et al.9 found similar IOP measurement with and without soft hydrogel contact lens. Gogniat et al.10 included both hydrogel and silicone hydrogel materials. They found stable DCT measurements over silicone hydrogel materials. Similar findings could be observed in rebound tonometry, that is less effect from silicone hydrogel than hydrogel materials on IOP measurements.28 This may be in concordance with the speculation that silicone hydrogel contact lens can provide a more stable contact surface than hydrogel contact lens.10 Although a significant IOP difference was found in the current study over one lens wearing sequence, this was not substantiated in the reverse wearing sequence. Agreement analyses revealed a slightly greater IOP difference when DCT was performed over Focus Night & Day® (Figs. 1 and 2). The difference may be attributed to the higher lens modulus of the material. Gogniat and co-workers10 concluded that DCT over silicone hydrogel contact lens was not influenced by lens power. The lens modulus of their silicone hydrogel lens was 0.66MPa, similar to Acuvue® Advance® in our study. Clinically, IOP variation within 3mmHg is considered acceptable.29,30 From the Bland and Altman plots (Figs. 1 and 2), only one or two subjects had IOP difference beyond this limit in each scenario. From the agreement analyses (Table 3), DCT over silicone hydrogel contact lens of low lens modulus has reasonable clinical acceptance. Optometrists not eligible to use topical anesthetics may put a low modulus silicone hydrogel lens in situ for DCT.
Nosch et al.9 found lower OPA (2.08mmHg versus 2.20mmHg) when it was measured over soft contact lenses. We demonstrated similar findings over silicone hydrogel lens (Table 2). Post hoc tests revealed significantly lower OPA with both lens types (Table 4). Agreement was within 1mmHg. OPA is a relatively new ocular parameter. Higher OPA means greater IOP fluctuation that could be associated with glaucomatous visual field loss.31 The OPA of our subjects was similar to Gogniat and co-workers10 but smaller than other studies.32,33 It may be due to longer axial length in our population,32,34 but unfortunately we did not measure their refractive status.
Ocular Response Analyzer provides corneal biomechanical properties. We found no significant change in CH and CRF when measurements were taken over silicone hydrogel lenses. We originally thought that corneal biomechanical properties could be measured differently in our experimental protocol, such as a higher corneal resistance factor over contact lens of higher modulus. From the current results, CH and CRF are measured clinically the same. There is no speculation that ORA is not measuring corneal biomechanical properties because contact lens of higher modulus over the cornea is different from a stiffer cornea. On the other hand, whether ORA is really measuring corneal biomechanics is still a question.35 For example, ORA could not find significant changes in corneal biomechanics before and after CXL in keratoconus.36–38
There were some limitations of this study. We provided a 5-min rest before inserting the other lens type because the wearing period was 10min only for each lens type. We did not anticipate much effect on IOP and corneal biomechanical properties from such a short wearing schedule. On the other hand, such short duration of lens wear could not represent the real clinical situation of long hours silicone hydrogel lens wear. Thirdly, the DCT results for comparison were actually obtained after wearing all the lenses. Since DCT measurement over the cornea requires topical anesthesia, it was therefore the last procedure to be conducted. Our study design involved repeated corneal contact, even though some of them were through contact lenses. Whether repeated DCT would affect the accuracy of IOP measurement is not clear. Perhaps massaging effect from DCT, if any, could be less than the Goldmann applanation tonometry because of less corneal deformation arising from the former.39 Both ORA and DCT were performed by the same investigator. Acceptance of measurement results was based on waveform score from ORA16,40 and quality score from DCT23 to eliminate bias from investigator. Our study included only young subjects with normal IOP. The study should be repeated on subjects who are more prone to have glaucoma, such as those over the age of 40 years.
Asian population has high prevalence of myopia. Soft contact lens is a very popular corrective means. It could be inconvenient for patients to remove their contact lenses for ophthalmic procedures. From the current results, removal of silicone hydrogel contact lenses may not be necessary for DCT measurements. For countries where optometrists are not allowed to use topical anesthetics, they may put a low modulus silicone hydrogel contact lens in situ for DCT.
Conflict of interestThe authors have no proprietary or commercial interest in any materials discussed in this paper.
The ORA and DCT were purchased from the Development of Niche Areas Funding on “Glaucoma Research – A programme Approach” J-BB76 from The Hong Kong Polytechnic University. We would like to thank Alcon Hong Kong Limited and Johnson and Johnson Hong Kong for donating the contact lenses.


