

To assess the inter and intra observer variability of subjective grading of the retinal arterio-venous ratio (AVR) using a visual grading and to compare the subjectively derived grades to an objective method using a semi-automated computer program.
MethodsFollowing intraocular pressure and blood pressure measurements all subjects underwent dilated fundus photography. 86 monochromatic retinal images with the optic nerve head centred (52 healthy volunteers) were obtained using a Zeiss FF450+ fundus camera. Arterio-venous ratios (AVR), central retinal artery equivalent (CRAE) and central retinal vein equivalent (CRVE) were calculated on three separate occasions by one single observer semi-automatically using the software VesselMap (ImedosSystems, Jena, Germany). Following the automated grading, three examiners graded the AVR visually on three separate occasions in order to assess their agreement.
ResultsReproducibility of the semi-automatic parameters was excellent (ICCs: 0.97 (CRAE); 0.985 (CRVE) and 0.952 (AVR)). However, visual grading of AVR showed inter grader differences as well as discrepancies between subjectively derived and objectively calculated AVR (all p<0.000001).
ConclusionGrader education and experience leads to inter-grader differences but more importantly, subjective grading is not capable to pick up subtle differences across healthy individuals and does not represent true AVR when compared with an objective assessment method. Technology advancements mean we no longer rely on opthalmoscopic evaluation but can capture and store fundus images with retinal cameras, enabling us to measure vessel calibre more accurately compared to visual estimation; hence it should be integrated in optometric practise for improved accuracy and reliability of clinical assessments of retinal vessel calibres.
Evaluar la variabilidad de la graduación subjetiva del ratio arterio-vernoso de la retina entre distintos observadores, utilizando la graduación visual, y comparar los grados subjetivamente calculados con un método objetivo que utiliza un programa informático semi-automatizado.
MétodosTras medir la presión intraocular y la presión sanguínea, se realizó una fotografía del fondo del ojo dilatado a todos los sujetos. Se obtuvieron 86 imágenes monocromáticas de la retina con la cabeza del nervio óptico centrada (52 voluntarios sanos), utilizando una cámara Zeiss FF450+ para el fondo del ojo. Se calcularon los ratios arterio-venosos (AVR), el equivalente de la arteria retiniana central (CRAE) y el equivalente de la vena retiniana central (CRVE) en tres ocasiones diferentes y mediante un único observador, utilizando el software VesselMap (ImedosSystems, Jena, Alemania). Tras la graduación automática, tres examinadores graduaron los AVR visualmente en tres ocasiones diferentes, a fin de valorar la concordancia.
ResultadosLa reproducibilidad de los parámetros semi-automáticos fue excelente (ICCs: 0,97 (CRAE); 0,985 (CRVE) y 0,952 (AVR)). Sin embargo, la graduación visual del AVR mostró diferencias entre los distintos graduadores, así como discrepancias entre los AVR subjetiva y objetivamente calculados (todas las comparaciones: p<0,000001).
ConclusiónLa formación y experiencia del graduador origina diferencias entre los diferentes graduadores pero lo más relevante es que la graduación subjetiva no es capaz de recoger las diferencias sutiles entre los sujetos sanos, y no representa el AVR real cuando se compara con un método de valoración objetivo. Los avances tecnológicos implican que no debemos seguir dependiendo de la valoración oftalmoscópica, sino captar y almacenar las imágenes del fondo del ojo tomadas con cámaras retinianas, lo que nos permite medir más precisamente el calibre de los vasos en comparación a la estimación visual; por tanto, dichos avances deberían integrarse en la práctica optométrica para mejorar la precisión y fiabilidad de las valoraciones clínicas de los calibres de los vasos de la retina.
Assessing retinal vessel appearance including relative diameters is part of a standard ocular examination. Retinal vessel diameters have been shown to be valuable markers of systemic and ocular vascular complications in a range of pathologies including diabetes,1–3 cardiovascular disease4–6 and cerebrovascular complications.7,8 Despite the availability of a wide range of semi-automatic programs which can measure retinal arteriolar and venular diameters in order to calculate arterio-venous ratios (AVR), most optometrists still make a visual assessment.
Changes due to vascular abnormalities and those related to age are often subtle and can be overlooked when using visual grading systems. Most optometric practices are equipped with a digital fundus camera, typically used for diabetic retinopathy screening. Some of these software packages come with further image analyses options offering the possibility to measure retinal vessel diameters.
Visual grading systems in general exhibit poor reproducibility, low sensitivity and specificity as well as being highly dependent upon observer experience.9 Changing observers/clinicians can lead to bias in analysing progression data, especially if observer variability is dependent on experience. Visual grading of arterio-venous ratio is almost binary in nature as it reflects a comparison of the relative diameter of retinal arteries to those of retinal veins. There is a wide variety of literature and educational material used to teach clinicians and it is apparent that there is not only a lack of standardisation with respect to the measurement location but also in the numerical value of the ratio reflecting the “normal/healthy” diameter relationship.10–12 While some sources recommend comparison between vessels beyond the first bifurcation10 others advise on the use of graticules superimposed on the optic nerve head (ONH)11 or to assess vessels only after their second bifurcation.12 In stark contrast to this, semi-automated programs show a great deal of standardisation using a circular grid to measure vessel diameter only in a concentric ring segment one half disc diameter (DD) distant from the outer boundaries of the ONH and one half DD in width.13 The formulae used to calculate AVR is based on the work of Parr, Spears and Hubbard14–16 or its revised formulae published by Knudson et al. in 2003.13 Clearly, for observations over a longer time period it seems obvious that a semi-automatic system is superior to visual grading, given that independent of the observer one can analyse identical vessel segments over time and there is greater precision in the measurement. The basis of an automated AVR is the application of an algorithm which includes measurement of the central retinal artery and central retinal vein diameter which results from the calculation of individual diameters of their visible branches around the ONH.13 Hence, subtle vascular changes may be identified earlier than is possible from visual assessment.
The objective of this research was threefold. Firstly we wanted to evaluate the influence of observer experience on visual grading and agreement between observers. Secondly we wanted to evaluate the reproducibility of a semi-automated program using fundus photographs of healthy Caucasian and South Asian individuals. The final objective was to evaluate how well visual grading agrees with the values derived using a semi-automated program.
Materials and methodsSubjectsThe study was approved by the Aston University Ethics Committee and followed the guidelines of the Declaration of Helsinki. All participants gave written informed consent prior to inclusion in the study. Fifty-two healthy individuals (age range: 20–61 years) participated in the study. All participants initially underwent non-contact tonometry (Pulsair, Keeler, UK) followed by pupil dilation using one drop of tropicamide 1% (Bausch & Lomb, UK). After a minimum of 15–20min acclimatisation in a temperature controlled room (21°C) systemic blood pressure and heart rate was measured using a digital sphygmomanometer (UA-767, A&D Instruments Ltd., UK). Once maximum pupil dilation was achieved, monochromatic (red free) retinal photographs were obtained using a Zeiss FF450+ fundus camera with the ONH centred and the camera field angle set to 30°.
Visual gradingTo explore the influence of experience and different educational training we asked three individuals to grade each image on three separate occasions. Each examiner was instructed to grade each image according to the way they would normally do so in clinical practice or as taught at University. Examiner 1 was a final year optometry student with little clinical experience, Examiner 2 was a fully qualified optometrist with 4 years clinical experience and Examiner 3 was a fully qualified optometrist with 20 years clinical experience.
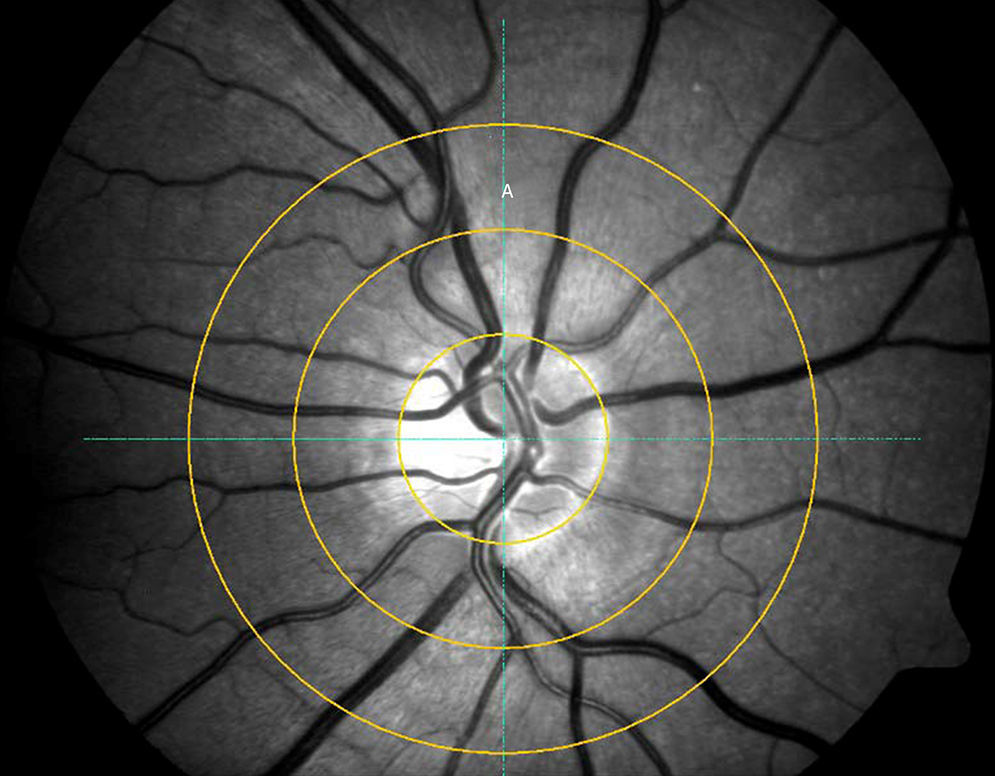
Semi-automated gradingSemi-automated grading was performed by a single observer grading each image on three different occasions using the Visualis software (ImedosSystems, Jena, Germany). In brief, following image selection a ring is placed around the ONH with 2 further concentric rings with each ½ DD and 1 DD distant from the ONH ring around it. The grader manually selects the six largest retinal arteries and veins passing through the outer ring segment A (see Fig. 1) to include in the analysis (once the vessel is selected the analyses program recognises the vessel and includes it's diameter in the calculation-no manual calliper selection is required); in cases of vessels branching in this segment, the vessel trunk was included but not its branches.
Statistical analysis
All data was analysed using STATISTICA version 6.0 (Statsoft, Tulsa, OK). All demographic and pressure data was normally distributed (Shapiro Wilk test). Intra-grader variability was assessed by calculating the Intra-class correlation coefficients (ICC) and Friedman's ANOVA, the software algorithm reproducibility was evaluated by calculating the ICC for each: CRAE, CRVE and AVR. All ICCs were calculated using a two-way mixed, absolute agreement, single measures model. More detail on the calculation and different models used to obtain ICCs can be found elsewhere.17 Between grader and software AVR values were compared using Friedman's ANOVA followed by Wilcoxon signed rank test. Statistical significance was defined as p<0.05.
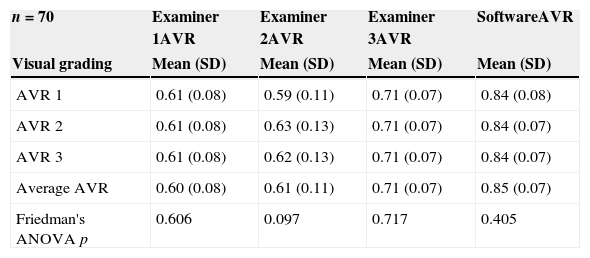
ResultsEighty-six retinal photographs of 52 participants (mean age 30 SD 9 years) were included for semi-automated vessel diameter assessment and subjective visual grading by three different examiners. Systemic circulatory and intraocular pressure (IOP) values were within normal limits for all participants (IOP: 12 (3)mmHg, systolic blood pressure: 114 (13)mmHg, diastolic blood pressure: 70 (10)mmHg, heart rate: 68 (9)bpm). Average visual gradings for all 3 occasions, all graders and software can be found in Table 1.
Grading results for all examiners and software derived grading. AVR 1: arterio-venous ratio grading 1, AVR 2: arterio-venous ratio grading 2, AVR 3: arterio-venous ratio grading 3, CRAE: central retinal arterial equivalent, CRVE: central retinal venous equivalent.
| n=70 | Examiner 1AVR | Examiner 2AVR | Examiner 3AVR | SoftwareAVR |
|---|---|---|---|---|
| Visual grading | Mean (SD) | Mean (SD) | Mean (SD) | Mean (SD) |
| AVR 1 | 0.61 (0.08) | 0.59 (0.11) | 0.71 (0.07) | 0.84 (0.08) |
| AVR 2 | 0.61 (0.08) | 0.63 (0.13) | 0.71 (0.07) | 0.84 (0.07) |
| AVR 3 | 0.61 (0.08) | 0.62 (0.13) | 0.71 (0.07) | 0.84 (0.07) |
| Average AVR | 0.60 (0.08) | 0.61 (0.11) | 0.71 (0.07) | 0.85 (0.07) |
| Friedman's ANOVA p | 0.606 | 0.097 | 0.717 | 0.405 |
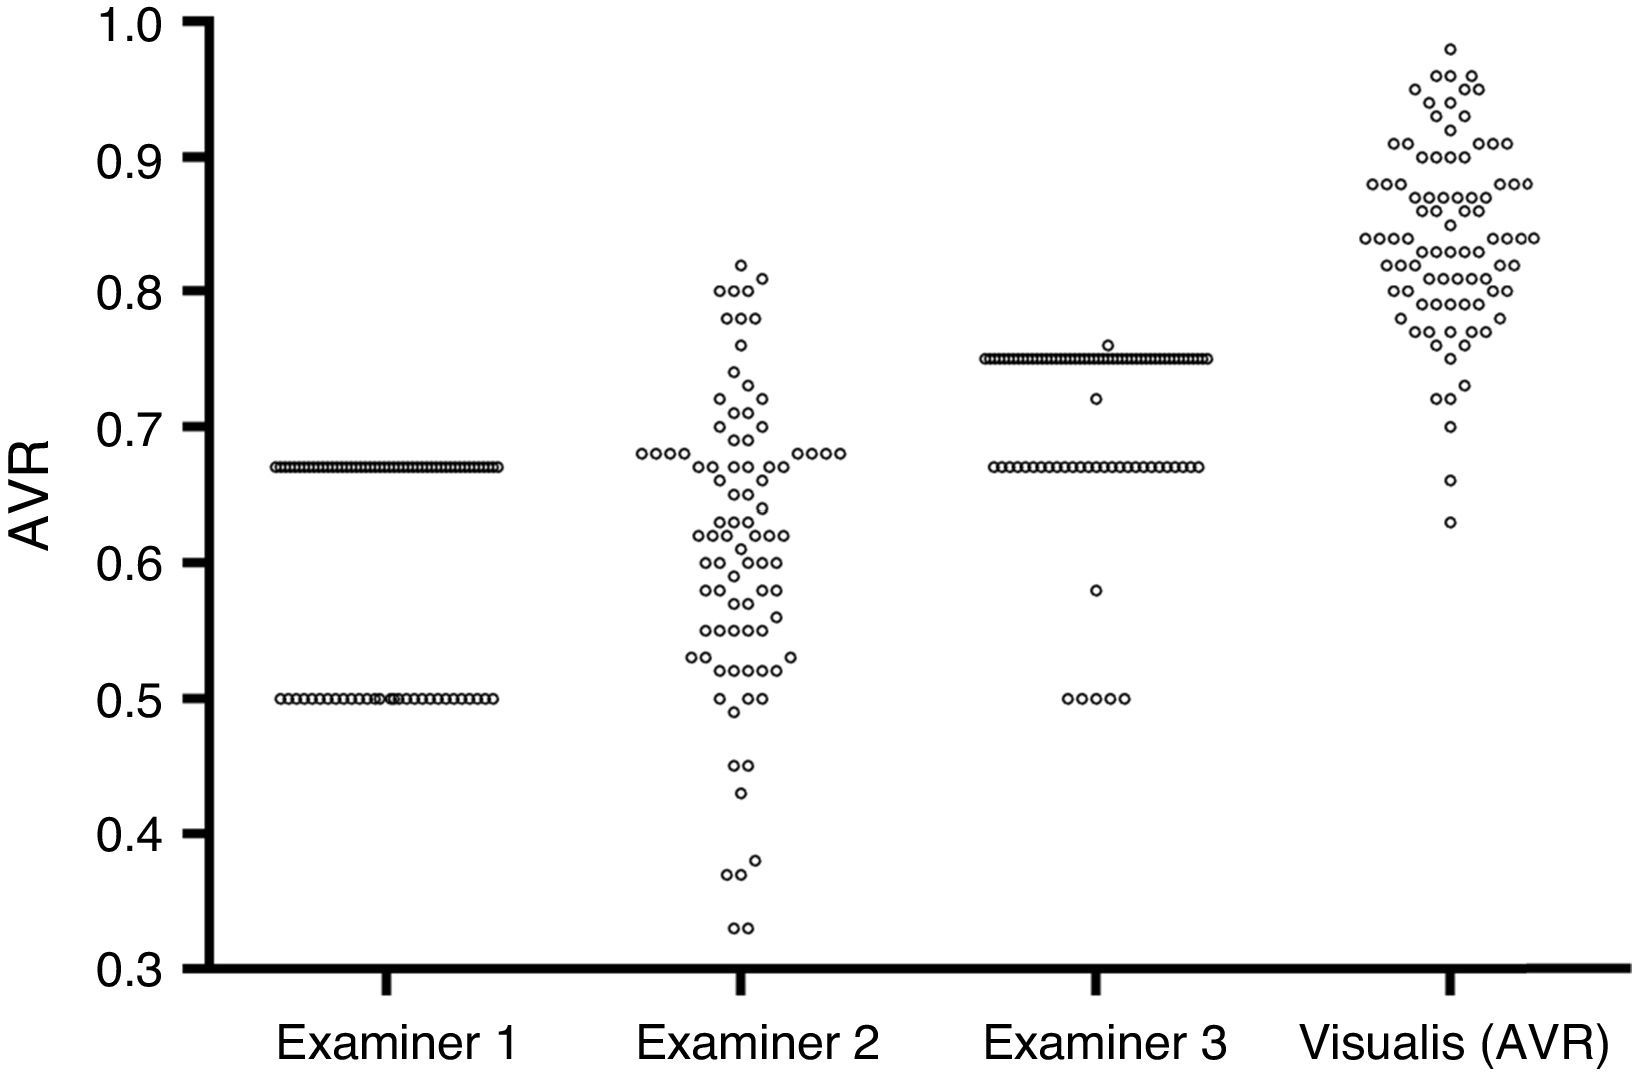
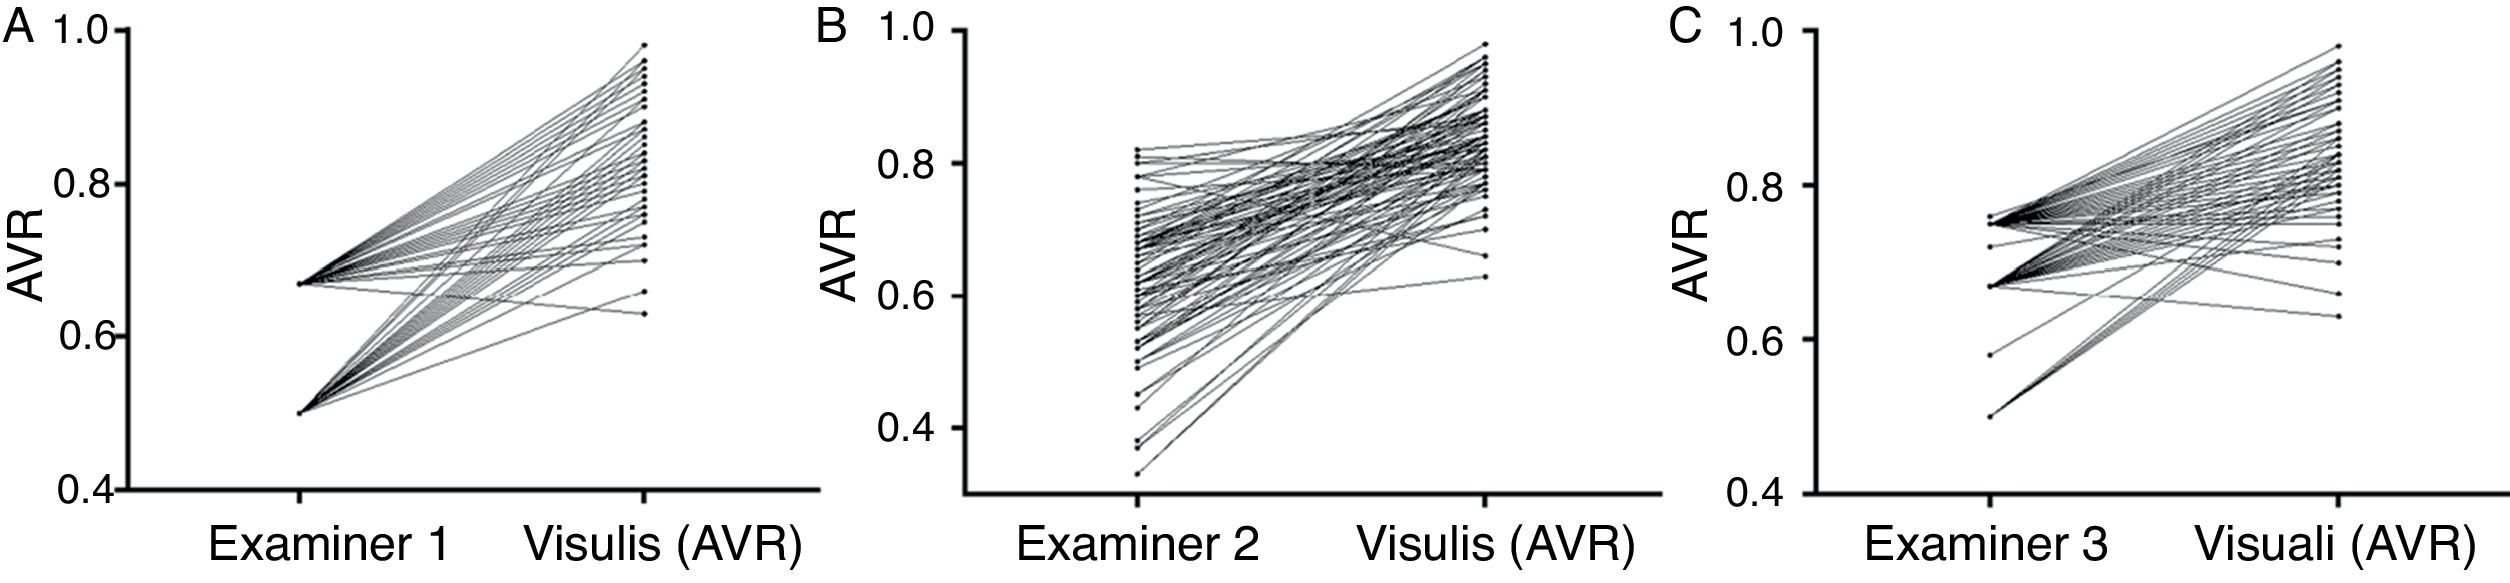
While examiner 1 and 3 apply an almost binary grading system, examiner 2 uses a more continuous approach. Despite the discrepancy between the examiners, on average all three underestimate AVR when compared to the quantitative software based measurement (Fig. 2). When using a paired t-test to compare the results of the visual grading between examiners numerically, only examiner 3 differs from both examiner 1 and 2 (p<0.0000001 and p<0.0000001 respectively). While a paired t-test is not suitable to assess examiner differences, ICCs or correlations are not ideal (but for completeness can be found in Table 2) for comparison due to the non-continuous nature of this data; hence we chose to plot a case-by-case graph connecting the results of the visual grading of each case for each examiner and the automatic grading for better illustration (see Fig. 3).
. Each point denotes a single grading.")
 and the automated grading (average AVR).")
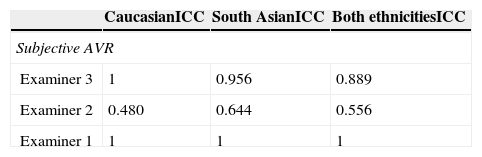
To assess visual grading reproducibility of each grader we calculated the ICC comparing each graders second and final measurement.
Reproducibility of semi-automated arterio-venous parameter in Caucasian and South Asian IndividualsReproducibility of automated arterio-venous parameter was excellent for both Caucasian and South Asian fundi. ICCs for Caucasian retinas [n=46] were 0.963 for AVR, 0.982 for CRAE and 0.988 for CRVE; similarly ICCs for South Asian retinas [n=40] was 0.927 for AVR, 0.95 for CRAE and 0.976 for CRVE.
Visual grading of AVR vs. semi-automated AVR calculationTo compare subjective AVR assessment with objective, software based AVR calculation we computed a Friedman's ANOVA which shows a significant difference (p<0.000001). As this is a non-parametric test we used the Wilcoxon signed rank test to compare each subjective grading with the semi-automated AVR. All subjective grading were significantly lower than the semi-automatically derived AVR (all p<0.000001).
DiscussionAlthough individual grader reproducibility was good, there were marked differences between the three graders. Whilst examiner 1 and 3 were using an almost binary approach to grading the images, Examiner 2 showed a more continuous approach.
The differences between graders are most likely due to their clinical experience and University training. Examiners 1 and 2 were taught that a normal AVR is 2:3. Conversely, examiner 3 was taught that a normal AVR is 3:4 which explains in part the higher values of Examiner 3. Of note is also the marked binary grading of Examiner 1 compared to Examiner 3. They are both using a binary approach but the differences between the two gradings are more subtle, probably due to the difference in clinical experience between examiners and that differences between subjects are very subtle and difficult to judge subjectively. When comparing the subjective grades of the examiners with the objective outcomes of the semi-automatic analysis it was apparent that a large discrepancy between visual and semi-automatic grading exists. Despite inter-grader differences, all examiners significantly underestimated AVR compared to the software generated output.
While AVR has shown to be a useful marker in vascular disease18–20 this data highlights the inconsistencies and lack of clinical agreement with objective data for AVR. The further advantage of objective analysis of AVR is that it can be used for follow up visits and long term observations making it beneficial in a clinical environment.
As many of these programs have been developed and tested in Caucasian individuals we wanted to explore how robust the software algorithm is when repeating the measurement procedure using the same image on three separate occasions on Caucasian and South Asian retinal photographs. Our results show excellent reproducibility of software generated values for CRAE, CRVE and AVR in both ethnic groups. The slightly lower ICC values for AVR and CRAE in the South Asian fundi is most likely due to the inherent lower contrast of the photographic images.
AVR as a standalone measurement is of limited clinical use as in the context of diagnosis it is advantageous to identify whether vessel diameters have altered because of venous, arterial changes or both.21,22 The existing subjective grading method is limited since an alteration of the AVR from for example 2:3 to 1:2 is commonly referred to as retinal arteriolar narrowing, but the same ratio will be achieved by venous dilation, commonly encountered in diabetic retinopathy. More clinically useful measures for monitoring are the CRAE and CRVE indices which can only be achieved using automated analysis.
Publications on the utility, clinical validity and applications for retinal vessel diameters are numerous but to date not widely integrated into clinical practice. For example, Liew and colleagues reported retinal vessel parameter of a subset of participants from the Atherosclerosis Risk in Communities (ARIC) study (n=8794) showing that the major systemic determinant for smaller CRAE is higher blood pressure whereas wider CRVE is mainly due to current cigarette smoking, higher blood pressure, systemic inflammation and obesity. Those with higher blood pressure (75th percentile) had on average 4.8 microns smaller CRAE and 2.6 microns wider CRVE than those with lower blood pressure (25th percentile).23 More recent work by Daien and colleagues found a strong negative correlation between renal function and retinal parameters (CRAE and CRVE) in a cohort of eighty healthy individuals which suggests a common determinant in pre-clinical target organ damage.24 This is in support of earlier studies,25,26 examining the association between retinal vascular signs and incident hypertension providing evidence that a decrease in CRAE is indeed an antecedent to clinical onset of hypertension and occurs prior to other signs of target organ damage.
Besides the value of CRAE in predicting hypertension, it also shows great potential in other pathologies including stroke and diabetes. Generalised arteriolar narrowing as reflected by a decrease in CRAE is associated with an increased risk in stroke.27–28 While in diabetes an increase of CRVE was associated with increased incidence of diabetic retinopathy (DR), progression of DR, progression to proliferative DR and macular oedema but was unrelated to CRAE.
Apart from its potential for risk prediction, screening and monitoring systemic pathologies, retinal vessel parameter have been shown to be of clinical value in ocular vascular abnormalities such as glaucoma and AMD. Results of the Handan Eye Study showed the association of increased CRAE with early AMD,29 while an increased risk of open angle glaucoma (OAG) was associated with a decrease in CRAE.30
In conclusion, the retinal circulation is an ideal vascular bed to observe changes non-invasively. Although we thoroughly assess its structure, vasculature and overall appearance, this is mostly done by subjective visual assessment despite the wide use of fundus cameras. A steep increase of patients at risk and/or suffering from cardiovascular diseases such as hypertension, diabetes and heart disease paired with an increasingly older population brings about an increased necessity for screening and monitoring. Optometrists already play an integral part in the screening of DR and with the strong evidence of retinal vessel parameters association with systemic and ocular pathology these markers might provide enhanced diagnostic/prognostic power in existing pathology (hypertension and diabetes) and for those at risk of developing future ocular vascular pathology. While retinal vascular changes themselves do not always lead to immediate loss in visual function, they are useful markers for future risk. Any measurement/assessment a patient has to undergo should be of clinical use, AVR as determined by subjective grading is an out-dated measure which has been superseded by objectively determined diameter measurements. Regular retinal photography as part of a standard eye examination is becoming a reality as cameras and computer power have increased rapidly and made imaging technology an affordable tool for everyday clinical practice.
Consequently, the implementation of automated AVR measurements would provide a much more reliable tool to monitor vascular changes as part of a routine eye examination. Current optometry practice places more emphasis on diagnosis and monitoring of both ocular and systemic diseases rather than the provision of screening. Optometry practice already has the technological infrastructure to implement such changes, but there is perhaps a need to update professional guidelines and educational training in the measurement and clinical utility of AVR, CRAE and CRVE measurement in order to improve the clinical utility of this aspect of fundus examination.
Conflicts of interestThe authors have no conflicts of interest to declare.


